
中国全科医学 ›› 2022, Vol. 25 ›› Issue (06): 742-749.DOI: 10.12114/j.issn.1007-9572.2021.02.119
所属专题: 老年人群健康最新文章合集; 衰弱最新文章合集; 老年问题最新文章合集
郭凯林1,2, 王世强1,2,*, 李丹1,2, 王一杰1,2, 王少堃1,2, 胥祉涵1,2
收稿日期:2021-08-15
修回日期:2021-11-05
出版日期:2022-02-20
发布日期:2022-01-25
通讯作者:
王世强
基金资助:Developmental Trajectory of Frailty in Chinese Elderly People:an Analysis Based on the Latent Growth Model
GUO Kailin1,2,WANG Shiqiang1,2*,LI Dan1,2,WANG Yijie1,2,WANG Shaokun1,2,XU Zhihan1,2
1.Physical Education College of Hunan University of Technology,Zhuzhou 412007,China
2.Hunan Provincial Key Laboratory of Physical Health and Sports Fitness,Zhuzhou 412007,China
*Corresponding author:WANG Shiqiang,Associate professor;E-mail:suswsq@163.com
Received:2021-08-15
Revised:2021-11-05
Published:2022-02-20
Online:2022-01-25
摘要: 背景衰弱是人口老龄化突出的表现形式,我国关于老年人衰弱的研究多为横断面研究,忽视了对老年人衰弱发展轨迹的考察。目的基于中国健康与养老追踪调查(CHARLS)4期追踪数据,考察我国老年人衰弱的发展轨迹及影响因素。方法本研究资料来源于CHARLS 2011年、2013年、2015年、2018年数据,该调查于2011年开展,随后每2~3年追踪1次,采用多阶段PPS抽样,对我国28个省级行政区的中老年人群进行家户调查,范围覆盖150个县级单位、450个村级单位。其中2011年为全国基线调查,2013年、2015年和2018年为全国追踪调查。将4期数据通过个人编码匹配合并,最终形成4期调查均参与的2 267例60岁及以上老年人作为研究样本。采用衰弱指数(FI)对老年人的衰弱状况进行评估。利用Mplus工具构建3类无条件潜变量增长模型,选取最优的拟合模型确定我国老年人衰弱的发展轨迹,并在最优模型的基础上构建条件潜变量增长模型,考察随时间恒定因素(性别、教育程度)和随时间变化因素(体力活动、吸烟、饮酒、睡眠)对老年人衰弱的影响。结果不定义曲线潜变量增长模型能更好地拟合数据,为我国老年人衰弱发展轨迹的最优模型,其中χ2(3)=36.16,比较拟合指数(CFI)=0.992,非规范拟合指数(TLI)=0.984,近似均方根误差(RMSEA)=0.070,标准化均方根残差(SRMR)=0.022,表明我国老年人衰弱水平呈曲线增长的趋势;模型截距、斜率以及截距的变异和斜率的变异均显著>0(P<0.01),表明老年人衰弱的初始水平和增长速度均存在显著的个体差异。恒定因素性别、教育程度对模型截距(性别:β=-0.113,P<0.01;教育程度:β=-0.173,P<0.01)和斜率(性别:β=-0.181,P<0.01;教育程度:β=-0.151,P<0.01)均有显著的负向预测作用,相比于男性和教育程度高的老年人,女性、低教育程度老年人衰弱的初始水平更高,增长速度更快。时间变化因素中体力活动、睡眠在4期调查中均对老年人衰弱具有显著的负向影响(P<0.05);吸烟和饮酒分别在2011年、2015年、2018年和2013年、2015年调查中对老年人的衰弱有显著的正向影响(P<0.05)。结论我国老年人的衰弱呈曲线增长的发展轨迹,初始水平和增长速度均存在显著的个体差异,女性、低教育程度能预测衰弱的发展,中高体力活动、睡眠充足有助于衰弱水平的降低,长期吸烟、饮酒过多则会使衰弱恶化。
中图分类号:
GUO Kailin, WANG Shiqiang, LI Dan, WANG Yijie, WANG Shaokun, XU Zhihan.
Developmental Trajectory of Frailty in Chinese Elderly People:an Analysis Based on the Latent Growth Model [J]. Chinese General Practice, 2022, 25(06): 742-749.
| 项目 | 2011年 | 2013年 | 2015年 | 2018年 | |
|---|---|---|---|---|---|
| 慢性疾病〔n(%)〕 | |||||
| 高血压 | 614(27.0) | 703(30.9) | 801(35.2) | 1 146(50.4) | |
| 血脂异常 | 214(9.4) | 291(12.8) | 337(14.8) | 430(19.0) | |
| 糖尿病 | 125(5.5) | 169(7.4) | 213(9.4) | 229(10.1) | |
| 肺部疾病 | 275(12.1) | 317(13.9) | 362(15.9) | 386(17.0) | |
| 肝脏疾病 | 82(3.6) | 86(3.7) | 90(4.0) | 96(4.2) | |
| 心脏病 | 313(13.8) | 368(16.2) | 421(18.5) | 521(22.9) | |
| 卒中 | 50(2.2) | 56(2.5) | 75(3.3) | 93(4.1) | |
| 肾脏疾病 | 142(6.2) | 149(6.5) | 174(7.6) | 254(11.2) | |
| 消化系统疾病 | 469(20.6) | 527(23.2) | 521(22.9) | 612(26.9) | |
| 精神疾病 | 23(0.1) | 20(0.08) | 35(1.5) | 25(1.1) | |
| 与记忆相关疾病 | 21(0.09) | 34(1.5) | 54(2.4) | 65(2.9) | |
| 关节炎或风湿 | 778(34.2) | 851(37.4) | 870(38.2) | 966(42.4) | |
| 哮喘 | 98(4.3) | 123(5.4) | 156(6.9) | 179(7.9) | |
| 残疾〔n(%)〕 | |||||
| 躯体残疾 | 81(3.6) | 129(5.7) | 172(7.6) | 188(8.3) | |
| 大脑受损 | 37(1.6) | 83(3.6) | 146(6.4) | 178(7.8) | |
| 视觉障碍〔n(%)〕 | 137(6.0) | 246(10.8) | 374(16.4) | 252(11.1) | |
| 听觉障碍〔n(%)〕 | 186(8.2) | 309(13.6) | 464(20.4) | 525(23.1) | |
| 健康变化〔n(%)〕 | 591(25.9) | 522(22.9) | 581(25.5) | 431(18.9) | |
| BADL〔n(%)〕 | |||||
| 穿衣 | 81(3.6) | 88(3.9) | 126(5.7) | 138(6.1) | |
| 吃饭 | 47(2.1) | 33(1.4) | 49(2.2) | 61(2.9) | |
| 洗澡 | 100(4.4) | 122(5.4) | 165(7.2) | 186(8.2) | |
| 起床 | 88(3.9) | 108(4.7) | 167(7.3) | 200(8.8) | |
| 上厕所 | 271(11.9) | 285(12.5) | 327(14.4) | 365(16.0) | |
| 控制大小便 | 91(4.0) | 92(4.0) | 112(4.9) | 150(6.6) | |
| IADL〔n(%)〕 | |||||
| 做家务 | 159(7.0) | 195(8.6) | 291(12.8) | 421(18.4) | |
| 做饭 | 145(6.4) | 154(6.8) | 200(8.8) | 253(11.1) | |
| 购物 | 141(6.2) | 121(5.3) | 163(7.2) | 168(7.4) | |
| 理财 | 207(9.1) | 169(7.4) | 196(8.6) | 265(11.6) | |
| 服药 | 104(4.6) | 71(3.1) | 89(3.9) | 93(4.1) | |
| 移动能力〔n(%)〕 | |||||
| 跑或慢跑1 km | 1 177(51.7) | 1 184(52.0) | 1 255(55.1) | 2 500(26.0) | |
| 走1 km | 288(12.7) | 352(15.5) | 446(19.6) | 517(22.7) | |
| 爬楼 | 922(40.5) | 902(39.6) | 976(42.9) | 1 011(44.4) | |
| 肌肉能力〔n(%)〕 | |||||
| 久坐再站立 | 600(26.4) | 640(28.0) | 679(29.8) | 719(31.6) | |
| 弯腰屈膝下蹲 | 658(28.9) | 731(32.1) | 798(35.1) | 851(37.4) | |
| 手臂向上伸展 | 191(8.4) | 208(9.1) | 242(10.6) | 284(12.5) | |
| 提5 kg重物 | 223(9.8) | 293(12.9) | 326(14.3) | 369(16.2) | |
| 从桌上拾起硬币 | 62(2.7) | 63(2.8) | 120(5.3) | 189(8.3) | |
| 抑郁〔n(%)〕 | 706(31.0) | 551(24.2) | 633(27.8) | 841(37.0) | |
认知( ±s,分) ±s,分) | 0.50±0.19 | 0.48±0.19 | 0.69±0.78 | 0.71±0.26 | |
表1 FI健康缺陷及分布(n=2 267)
Table 1 Frailty index and the distribution of health defects in participants by the wave of CHARLS
| 项目 | 2011年 | 2013年 | 2015年 | 2018年 | |
|---|---|---|---|---|---|
| 慢性疾病〔n(%)〕 | |||||
| 高血压 | 614(27.0) | 703(30.9) | 801(35.2) | 1 146(50.4) | |
| 血脂异常 | 214(9.4) | 291(12.8) | 337(14.8) | 430(19.0) | |
| 糖尿病 | 125(5.5) | 169(7.4) | 213(9.4) | 229(10.1) | |
| 肺部疾病 | 275(12.1) | 317(13.9) | 362(15.9) | 386(17.0) | |
| 肝脏疾病 | 82(3.6) | 86(3.7) | 90(4.0) | 96(4.2) | |
| 心脏病 | 313(13.8) | 368(16.2) | 421(18.5) | 521(22.9) | |
| 卒中 | 50(2.2) | 56(2.5) | 75(3.3) | 93(4.1) | |
| 肾脏疾病 | 142(6.2) | 149(6.5) | 174(7.6) | 254(11.2) | |
| 消化系统疾病 | 469(20.6) | 527(23.2) | 521(22.9) | 612(26.9) | |
| 精神疾病 | 23(0.1) | 20(0.08) | 35(1.5) | 25(1.1) | |
| 与记忆相关疾病 | 21(0.09) | 34(1.5) | 54(2.4) | 65(2.9) | |
| 关节炎或风湿 | 778(34.2) | 851(37.4) | 870(38.2) | 966(42.4) | |
| 哮喘 | 98(4.3) | 123(5.4) | 156(6.9) | 179(7.9) | |
| 残疾〔n(%)〕 | |||||
| 躯体残疾 | 81(3.6) | 129(5.7) | 172(7.6) | 188(8.3) | |
| 大脑受损 | 37(1.6) | 83(3.6) | 146(6.4) | 178(7.8) | |
| 视觉障碍〔n(%)〕 | 137(6.0) | 246(10.8) | 374(16.4) | 252(11.1) | |
| 听觉障碍〔n(%)〕 | 186(8.2) | 309(13.6) | 464(20.4) | 525(23.1) | |
| 健康变化〔n(%)〕 | 591(25.9) | 522(22.9) | 581(25.5) | 431(18.9) | |
| BADL〔n(%)〕 | |||||
| 穿衣 | 81(3.6) | 88(3.9) | 126(5.7) | 138(6.1) | |
| 吃饭 | 47(2.1) | 33(1.4) | 49(2.2) | 61(2.9) | |
| 洗澡 | 100(4.4) | 122(5.4) | 165(7.2) | 186(8.2) | |
| 起床 | 88(3.9) | 108(4.7) | 167(7.3) | 200(8.8) | |
| 上厕所 | 271(11.9) | 285(12.5) | 327(14.4) | 365(16.0) | |
| 控制大小便 | 91(4.0) | 92(4.0) | 112(4.9) | 150(6.6) | |
| IADL〔n(%)〕 | |||||
| 做家务 | 159(7.0) | 195(8.6) | 291(12.8) | 421(18.4) | |
| 做饭 | 145(6.4) | 154(6.8) | 200(8.8) | 253(11.1) | |
| 购物 | 141(6.2) | 121(5.3) | 163(7.2) | 168(7.4) | |
| 理财 | 207(9.1) | 169(7.4) | 196(8.6) | 265(11.6) | |
| 服药 | 104(4.6) | 71(3.1) | 89(3.9) | 93(4.1) | |
| 移动能力〔n(%)〕 | |||||
| 跑或慢跑1 km | 1 177(51.7) | 1 184(52.0) | 1 255(55.1) | 2 500(26.0) | |
| 走1 km | 288(12.7) | 352(15.5) | 446(19.6) | 517(22.7) | |
| 爬楼 | 922(40.5) | 902(39.6) | 976(42.9) | 1 011(44.4) | |
| 肌肉能力〔n(%)〕 | |||||
| 久坐再站立 | 600(26.4) | 640(28.0) | 679(29.8) | 719(31.6) | |
| 弯腰屈膝下蹲 | 658(28.9) | 731(32.1) | 798(35.1) | 851(37.4) | |
| 手臂向上伸展 | 191(8.4) | 208(9.1) | 242(10.6) | 284(12.5) | |
| 提5 kg重物 | 223(9.8) | 293(12.9) | 326(14.3) | 369(16.2) | |
| 从桌上拾起硬币 | 62(2.7) | 63(2.8) | 120(5.3) | 189(8.3) | |
| 抑郁〔n(%)〕 | 706(31.0) | 551(24.2) | 633(27.8) | 841(37.0) | |
| 认知(±s,分) | 0.50±0.19 | 0.48±0.19 | 0.69±0.78 | 0.71±0.26 | |
| 变量 | FI2011 | FI2013 | FI2015 | FI2018 | PA2011 | PA2013 | PA2015 | PA2018 | 吸烟2011 | 吸烟2013 | 吸烟2015 | 吸烟2018 | 饮酒2011 | 饮酒2013 | 饮酒2015 | 饮酒2018 | 睡眠2011 | 睡眠2013 | 睡眠2015 | 睡眠2018 | 性别 |
|---|---|---|---|---|---|---|---|---|---|---|---|---|---|---|---|---|---|---|---|---|---|
| FI2011 | 1.00 | - | - | - | - | - | - | - | - | - | - | - | - | - | - | - | - | - | - | - | - |
| FI2013 | 0.73a | 1.00 | - | - | - | - | - | - | - | - | - | - | - | - | - | - | - | - | - | - | |
| FI2015 | 0.65a | 0.76a | 1.00 | - | - | - | - | - | - | - | - | - | - | - | - | - | - | - | - | - | - |
| FI2018 | 0.30a | 0.31a | 0.36a | 1.00 | - | - | - | - | - | - | - | - | - | - | - | - | - | - | - | - | - |
| PA2011 | -0.03a | -0.02 | <0.01 | <0.01 | 1.00 | - | - | - | - | - | - | - | - | - | - | - | - | - | - | - | - |
| PA2013 | -0.04 | -0.03a | <0.01 | -0.01 | 0.74a | 1.00 | - | - | - | - | - | - | - | - | - | - | - | - | - | - | - |
| PA2015 | -0.05a | -0.06a | -0.08a | 0.02 | 0.04a | 0.05a | 1.00 | - | - | - | - | - | - | - | - | - | - | - | - | - | - |
| PA2018 | -0.16a | -0.17a | -0.20a | -0.14a | 0.03 | 0.04 | 0.07a | 1.00 | - | - | - | - | - | - | - | - | - | - | - | - | - |
| 吸烟2011 | 0.13a | 0.14a | 0.14a | 0.06a | -0.02 | -0.03 | -0.01 | 0.02 | 1.00 | - | - | - | - | - | - | - | - | - | - | - | - |
| 吸烟2013 | 0.11a | 0.13a | 0.13a | 0.06a | -0.03 | -0.04 | -0.01 | 0.01 | 0.92a | 1.00 | - | - | - | - | - | - | - | - | - | - | - |
| 吸烟2015 | 0.10a | 0.12a | 0.13a | 0.06a | -0.01 | -0.02 | 0.01 | 0.01 | 0.79a | 0.82a | 1.00 | - | - | - | - | - | - | - | - | - | - |
| 吸烟2018 | 0.10a | 0.12a | 0.13a | 0.06a | -0.03 | -0.04 | 0.01 | 0.03 | 0.74a | 0.75a | 0.82a | 1.00 | - | - | - | - | - | - | - | - | - |
| 饮酒2011 | 0.13a | 0.17a | 0.15a | 0.09a | -0.01 | -0.02 | -0.01 | 0.06a | 0.27a | 0.28a | 0.24a | 0.24a | 1.00 | - | - | - | - | - | - | - | - |
| 饮酒2013 | 0.13a | 0.16a | 0.14a | 0.10a | 0.01 | <0.01 | 0.01 | 0.07a | 0.25a | 0.26a | 0.24a | 0.23a | 0.63a | 1.00 | - | - | - | - | - | - | - |
| 饮酒2015 | 0.12a | 0.17a | 0.15a | 0.10a | <0.01 | -0.03 | 0.01 | 0.08a | 0.23a | 0.24a | 0.24a | 0.23a | 0.64a | 0.66a | 1.00 | - | - | - | - | - | - |
| 饮酒2018 | 0.15a | 0.19a | 0.17a | 0.09a | -0.01 | -0.04a | 0.02 | 0.08a | 0.23a | 0.24a | 0.22a | 0.22a | 0.60a | 0.62a | 0.65a | 1.00 | - | - | - | - | - |
| 睡眠2011 | -0.21a | -0.18a | -0.17a | -0.70a | 0.02 | 0.02 | 0.02 | 0.02 | 0.04 | 0.04 | 0.02 | 0.03 | 0.01 | -0.01 | -0.01 | 0.03 | 1.00 | - | - | - | - |
| 睡眠2013 | -0.17a | -0.22a | -0.17a | -0.08a | 0.03 | 0.04 | 0.01 | 0.04 | 0.08a | 0.07a | 0.05a | 0.06a | 0.02 | 0.03 | 0.02 | 0.05a | 0.35a | 1.00 | - | - | - |
| 睡眠2015 | -0.21a | -0.21a | -0.22a | -0.09a | 0.02 | 0.04 | 0.02 | 0.04a | 0.11a | 0.11a | 0.10a | 0.09a | 0.05a | 0.08a | 0.06a | 0.05a | 0.36a | 0.41a | 1.00 | - | - |
| 睡眠2018 | -0.20a | -0.23a | -0.20a | -0.10a | 0.02 | 0.02 | 0.03 | 0.02 | 0.07a | 0.08a | 0.07a | 0.06a | 0.02 | 0.05a | 0.06a | 0.05a | 0.35a | 0.38a | 0.40a | 1.00 | - |
| 性别 | -0.20a | -0.21a | -0.22a | -0.17a | 0.03 | 0.01 | 0.01 | 0.07a | 0.50a | 0.51a | 0.44a | 0.41a | 0.37a | 0.38a | 0.34a | 0.35a | 0.10a | 0.11a | 0.14a | 0.15a | 1.00 |
| 教育程度 | -0.22a | -0.20a | -0.20a | -0.21a | 0.01 | <0.01 | 0.01 | 0.10a | 0.14a | 0.15a | 0.14a | 0.13a | 0.13a | 0.13a | 0.13a | 0.15a | 0.09a | 0.08a | 0.07a | 0.10a | 0.39a |
表2 各变量相关系数矩阵(rs值)
Table 2 Correlation coefficient matrix of frailty index with PA,smoking,alcohol consumption,sleep,gender,and education level in Chinese older people
| 变量 | FI2011 | FI2013 | FI2015 | FI2018 | PA2011 | PA2013 | PA2015 | PA2018 | 吸烟2011 | 吸烟2013 | 吸烟2015 | 吸烟2018 | 饮酒2011 | 饮酒2013 | 饮酒2015 | 饮酒2018 | 睡眠2011 | 睡眠2013 | 睡眠2015 | 睡眠2018 | 性别 |
|---|---|---|---|---|---|---|---|---|---|---|---|---|---|---|---|---|---|---|---|---|---|
| FI2011 | 1.00 | - | - | - | - | - | - | - | - | - | - | - | - | - | - | - | - | - | - | - | - |
| FI2013 | 0.73a | 1.00 | - | - | - | - | - | - | - | - | - | - | - | - | - | - | - | - | - | - | |
| FI2015 | 0.65a | 0.76a | 1.00 | - | - | - | - | - | - | - | - | - | - | - | - | - | - | - | - | - | - |
| FI2018 | 0.30a | 0.31a | 0.36a | 1.00 | - | - | - | - | - | - | - | - | - | - | - | - | - | - | - | - | - |
| PA2011 | -0.03a | -0.02 | <0.01 | <0.01 | 1.00 | - | - | - | - | - | - | - | - | - | - | - | - | - | - | - | - |
| PA2013 | -0.04 | -0.03a | <0.01 | -0.01 | 0.74a | 1.00 | - | - | - | - | - | - | - | - | - | - | - | - | - | - | - |
| PA2015 | -0.05a | -0.06a | -0.08a | 0.02 | 0.04a | 0.05a | 1.00 | - | - | - | - | - | - | - | - | - | - | - | - | - | - |
| PA2018 | -0.16a | -0.17a | -0.20a | -0.14a | 0.03 | 0.04 | 0.07a | 1.00 | - | - | - | - | - | - | - | - | - | - | - | - | - |
| 吸烟2011 | 0.13a | 0.14a | 0.14a | 0.06a | -0.02 | -0.03 | -0.01 | 0.02 | 1.00 | - | - | - | - | - | - | - | - | - | - | - | - |
| 吸烟2013 | 0.11a | 0.13a | 0.13a | 0.06a | -0.03 | -0.04 | -0.01 | 0.01 | 0.92a | 1.00 | - | - | - | - | - | - | - | - | - | - | - |
| 吸烟2015 | 0.10a | 0.12a | 0.13a | 0.06a | -0.01 | -0.02 | 0.01 | 0.01 | 0.79a | 0.82a | 1.00 | - | - | - | - | - | - | - | - | - | - |
| 吸烟2018 | 0.10a | 0.12a | 0.13a | 0.06a | -0.03 | -0.04 | 0.01 | 0.03 | 0.74a | 0.75a | 0.82a | 1.00 | - | - | - | - | - | - | - | - | - |
| 饮酒2011 | 0.13a | 0.17a | 0.15a | 0.09a | -0.01 | -0.02 | -0.01 | 0.06a | 0.27a | 0.28a | 0.24a | 0.24a | 1.00 | - | - | - | - | - | - | - | - |
| 饮酒2013 | 0.13a | 0.16a | 0.14a | 0.10a | 0.01 | <0.01 | 0.01 | 0.07a | 0.25a | 0.26a | 0.24a | 0.23a | 0.63a | 1.00 | - | - | - | - | - | - | - |
| 饮酒2015 | 0.12a | 0.17a | 0.15a | 0.10a | <0.01 | -0.03 | 0.01 | 0.08a | 0.23a | 0.24a | 0.24a | 0.23a | 0.64a | 0.66a | 1.00 | - | - | - | - | - | - |
| 饮酒2018 | 0.15a | 0.19a | 0.17a | 0.09a | -0.01 | -0.04a | 0.02 | 0.08a | 0.23a | 0.24a | 0.22a | 0.22a | 0.60a | 0.62a | 0.65a | 1.00 | - | - | - | - | - |
| 睡眠2011 | -0.21a | -0.18a | -0.17a | -0.70a | 0.02 | 0.02 | 0.02 | 0.02 | 0.04 | 0.04 | 0.02 | 0.03 | 0.01 | -0.01 | -0.01 | 0.03 | 1.00 | - | - | - | - |
| 睡眠2013 | -0.17a | -0.22a | -0.17a | -0.08a | 0.03 | 0.04 | 0.01 | 0.04 | 0.08a | 0.07a | 0.05a | 0.06a | 0.02 | 0.03 | 0.02 | 0.05a | 0.35a | 1.00 | - | - | - |
| 睡眠2015 | -0.21a | -0.21a | -0.22a | -0.09a | 0.02 | 0.04 | 0.02 | 0.04a | 0.11a | 0.11a | 0.10a | 0.09a | 0.05a | 0.08a | 0.06a | 0.05a | 0.36a | 0.41a | 1.00 | - | - |
| 睡眠2018 | -0.20a | -0.23a | -0.20a | -0.10a | 0.02 | 0.02 | 0.03 | 0.02 | 0.07a | 0.08a | 0.07a | 0.06a | 0.02 | 0.05a | 0.06a | 0.05a | 0.35a | 0.38a | 0.40a | 1.00 | - |
| 性别 | -0.20a | -0.21a | -0.22a | -0.17a | 0.03 | 0.01 | 0.01 | 0.07a | 0.50a | 0.51a | 0.44a | 0.41a | 0.37a | 0.38a | 0.34a | 0.35a | 0.10a | 0.11a | 0.14a | 0.15a | 1.00 |
| 教育程度 | -0.22a | -0.20a | -0.20a | -0.21a | 0.01 | <0.01 | 0.01 | 0.10a | 0.14a | 0.15a | 0.14a | 0.13a | 0.13a | 0.13a | 0.13a | 0.15a | 0.09a | 0.08a | 0.07a | 0.10a | 0.39a |
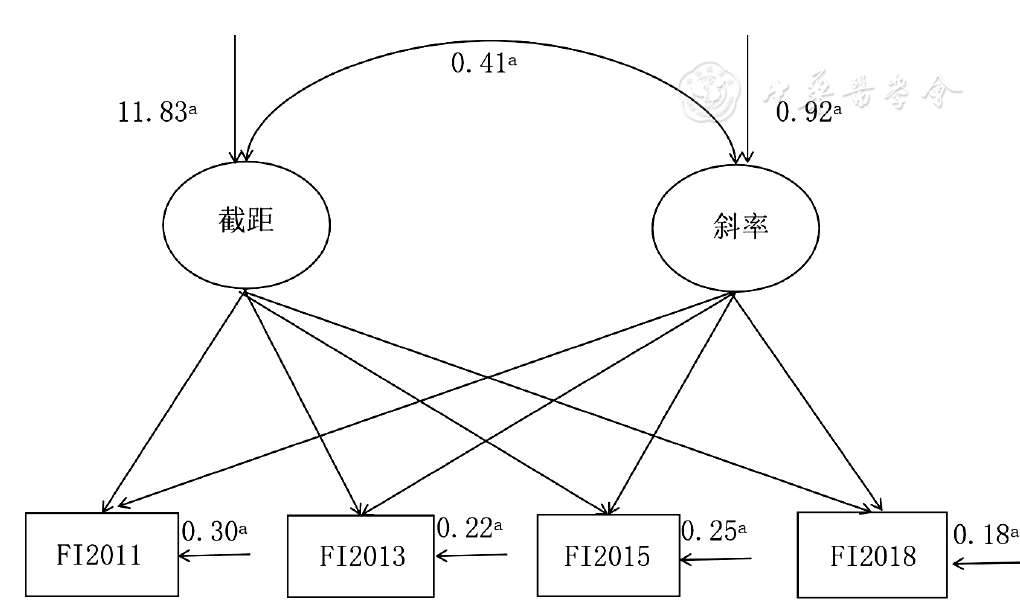
图1 我国老年人衰弱发展轨迹的不定义曲线无条件LGM
Figure 1 Unconditional latent growth model with undefined curve for analyzing the developmental trajectory and associated factors of frailty in Chinese older people
| 模型 | χ2(df) | P值 | CFI | TLI | RMSEA | SRMR | 系数 | 变异 | ||
|---|---|---|---|---|---|---|---|---|---|---|
| 截距 | 斜率 | 截距 | 斜率 | |||||||
| 线性无条件LGM | 97.87(5) | <0.01 | 0.977 | 0.973 | 0.090 | 0.053 | 11.87 | 0.79 | 58.52 | 1.87 |
| 二次函数无条件LGM | 51.05(1) | <0.01 | 0.988 | 0.927 | 0.148 | 0.033 | 11.82 | 0.51 | 85.02 | 9.85 |
| 不定义曲线无条件LGM | 36.16(3) | <0.01 | 0.992 | 0.984 | 0.070 | 0.022 | 11.83 | 0.92 | 53.16 | 1.13 |
表3 我国老年人衰弱发展轨迹的无条件潜变量增长模型的拟合指标
Table 3 Fitting indices of the unconditional latent growth model for analyzing the developmental trajectory of frailty in Chinese older people
| 模型 | χ2(df) | P值 | CFI | TLI | RMSEA | SRMR | 系数 | 变异 | ||
|---|---|---|---|---|---|---|---|---|---|---|
| 截距 | 斜率 | 截距 | 斜率 | |||||||
| 线性无条件LGM | 97.87(5) | <0.01 | 0.977 | 0.973 | 0.090 | 0.053 | 11.87 | 0.79 | 58.52 | 1.87 |
| 二次函数无条件LGM | 51.05(1) | <0.01 | 0.988 | 0.927 | 0.148 | 0.033 | 11.82 | 0.51 | 85.02 | 9.85 |
| 不定义曲线无条件LGM | 36.16(3) | <0.01 | 0.992 | 0.984 | 0.070 | 0.022 | 11.83 | 0.92 | 53.16 | 1.13 |
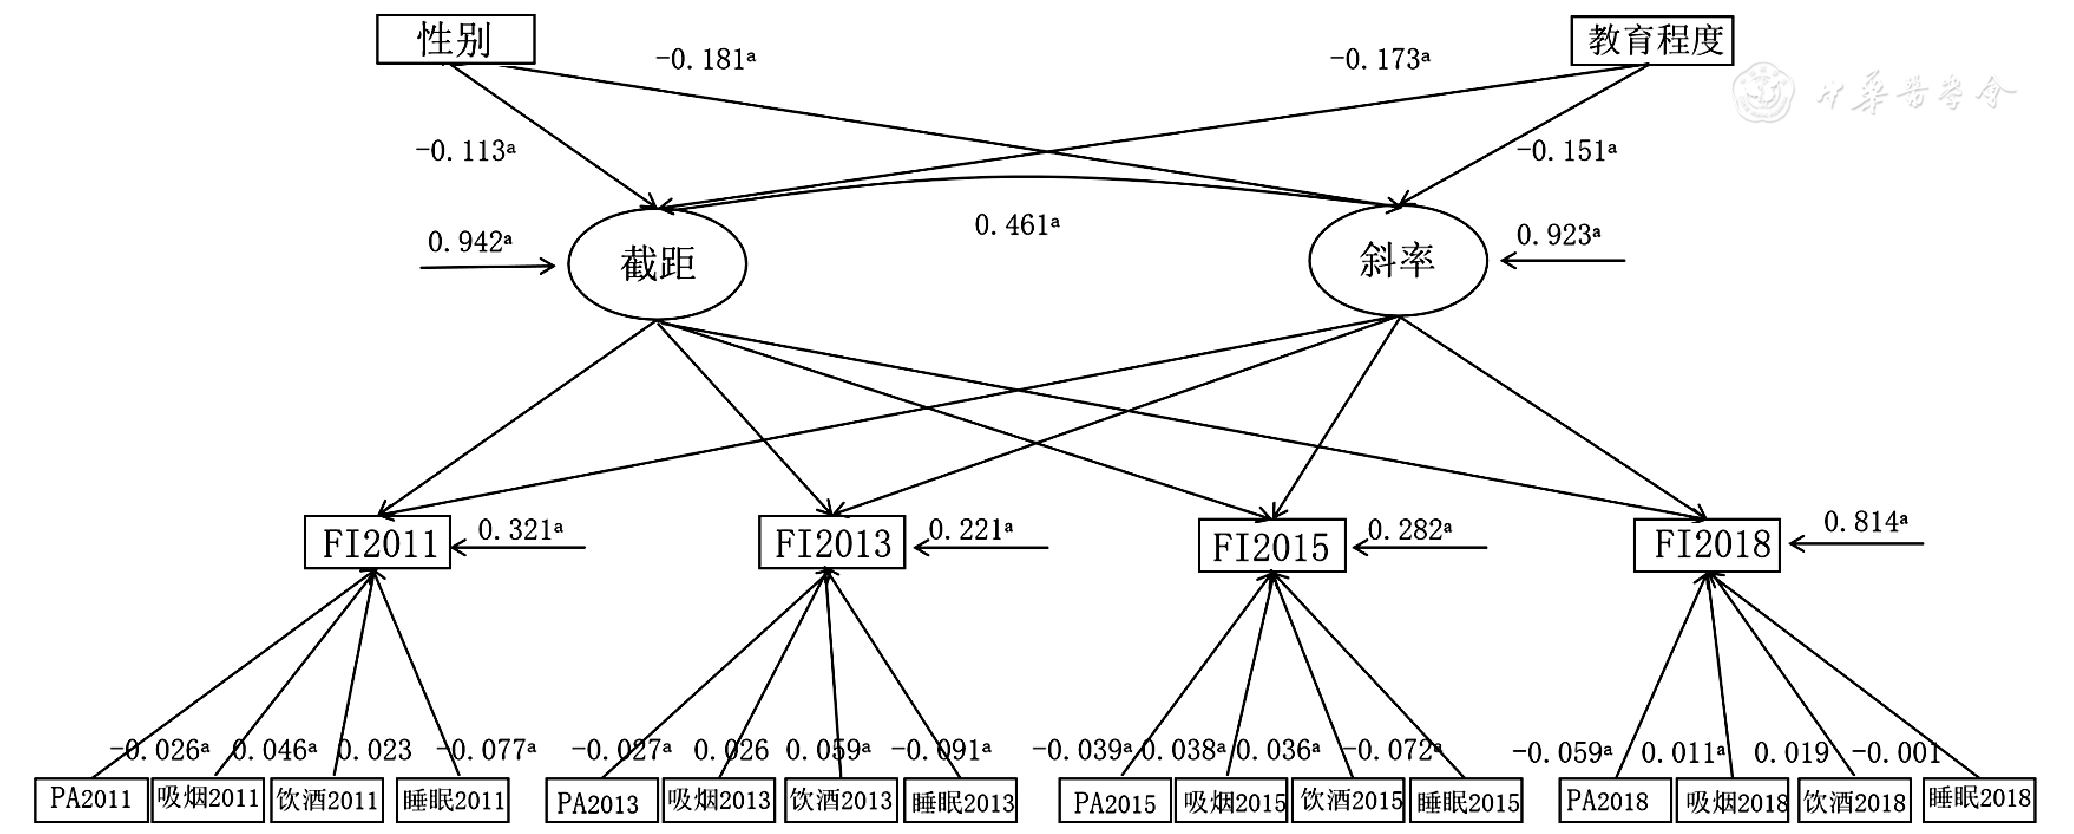
图2 我国老年人衰弱发展轨迹的不定义曲线条件LGM
Figure 2 Conditional latent growth model with undefined curve for analyzing the developmental trajectory and associated factors of frailty in Chinese older people
| [1] | United Nations.World Population Prospects 2019-Highlights[EB/OL]. (2019-12-31)[2021-02-15]. . |
| [2] | CLEGG A, YOUNG J, ILIFFE S,et al. Frailty in elderly people[J]. Lancet,2013,381(9868):752-762. DOI:10.1016/s0140-6736(12)62167-9. |
| [3] | VERMEIREN S, VELLA-AZZOPARDI R, BECKWÉE D,et al. Frailty and the prediction of negative health outcomes:a meta-analysis[J]. J Am Med Dir Assoc,2016,17(12):1163.e1-1161163.e17. DOI:10.1016/j.jamda.2016.09.010. |
| [4] | BOCK J O, KÖNIG H H, BRENNER H,et al. Associations of frailty with health care costs——results of the ESTHER cohort study[J]. BMC Health Serv Res,2016,16:128. DOI:10.1186/s12913-016-1360-3. |
| [5] | O'BRIEN T D, ROBERTS J, BRACKENRIDGE G R,et al. Some aspects of community care of the frail and elderly:the need for assessment[J]. Gerontol Clin (Basel),1968,10(4):215-227. DOI:10.1159/000245187. |
| [6] | ROCKWOOD K, SONG X W, MACKNIGHT C,et al. A global clinical measure of fitness and frailty in elderly people[J]. J De L'association Med Can,2005,173(5):489-495. DOI:10.1503/cmaj.050051. |
| [7] | ROGERS N T, FANCOURT D. Cultural engagement is a risk-reducing factor for frailty incidence and progression[J]. J Gerontol B Psychol Sci Soc Sci,2020,75(3):571-576. DOI:10.1093/geronb/gbz004. |
| [8] | STOLZ E, MAYERL H, WAXENEGGER A,et al. Impact of socioeconomic position on frailty trajectories in 10 European countries:evidence from the Survey of Health,Ageing and Retirement in Europe (2004—2013)[J]. J Epidemiol Community Health,2017,71(1):73-80. DOI:10.1136/jech-2016-207712. |
| [9] | 尹佳慧,曾雁冰,周鼒,等. 中国老年人衰弱状况及其影响因素分析[J]. 中华流行病学杂志,2018,39(9):1244-1248. DOI:10.3760/cma.j.issn.0254-6450.2018.09.019. |
| [10] | 王志燕,高欢玲,宋歌. 山西省农村老年人衰弱现状及影响因素分析[J]. 护理学杂志,2021,36(5):88-91. DOI:10.3870/j.issn.1001-4152.2021.05.088. |
| [11] | 余静雅,高静,柏丁兮,等. 成都市社区老年人衰弱现状与影响因素[J]. 中国老年学杂志,2021,41(9):1972-1977. DOI:10.3969/j.issn.1005-9202.2021.09.052. |
| [12] | 田鹏,杨宁,郝秋奎,等. 中国老年衰弱患病率的系统评价[J]. 中国循证医学杂志,2019,19(6):656-664. DOI:10.7507/1672-2531.201901056. |
| [13] | HSU H C, CHANG W C. Trajectories of frailty and related factors of the older people in Taiwan[J]. Exp Aging Res,2015,41(1):104-114. DOI:10.1080/0361073X.2015.978219. |
| [14] | STOW D, MATTHEWS F E, HANRATTY B. Frailty trajectories to identify end of life:a longitudinal population-based study[J]. BMC Med,2018,16(1):171. DOI:10.1186/s12916-018-1148-x. |
| [15] | 王宇宸,马腾,蒋晓燕,等. 老年人衰弱与睡眠障碍的关联探究[J]. 中国全科医学,2019,22(15):1766-1771. DOI:10.12114/j.issn.1007-9572.2019.00.113. |
| [16] | 崔光辉,李少杰,尹永田,等. 济南市社区老年人中医体质类型与衰弱综合征的关联性分析[J]. 中医药导报,2021,27(1):178-181. DOI:10.13862/j.cnki.cn43-1446/r.2021.01.042. |
| [17] | 中国健康与养老追踪调查[EB/OL]. (2019-09-13)[2021-02-10]. . |
| [18] | CRAIG C L, MARSHALL A L, SJÖSTRÖM M,et al. International physical activity questionnaire:12-country reliability and validity[J]. Med Sci Sports Exerc,2003,35(8):1381-1395. DOI:10.1249/01.MSS.0000078924.61453.FB. |
| [19] | 乔玉成. 身体活动水平:等级划分、度量方法和能耗估算[J]. 体育研究与教育,2017,32(3):1-12,113. DOI:10.16207/j.cnki.2095-235x.2017.03.001. |
| [20] | 樊萌语,吕筠,何平平. 国际体力活动问卷中体力活动水平的计算方法[J]. 中华流行病学杂志,2014,35(8):961-964. DOI:10.3760/cma.j.issn.0254-6450.2014.08.019. |
| [21] | APÓSTOLO J, COOKE R, BOBROWICZ-CAMPOS E,et al. Predicting risk and outcomes for frail older adults:an umbrella review of frailty screening tools[J]. JBI Database System Rev Implement Rep,2017,15(4):1154-1208. DOI:10.11124/JBISRIR-2016-003018. |
| [22] | KOJIMA G, ILIFFE S, WALTERS K. Frailty index as a predictor of mortality:a systematic review and meta-analysis[J]. Age Ageing,2018,47(2):193-200. DOI:10.1093/ageing/afx162. |
| [23] | SEARLE S D, MITNITSKI A, GAHBAUER E A,et al. A standard procedure for creating a frailty index[J]. BMC Geriatr,2008,8(1):24-33. DOI:10.1186/1471-2318-8-24. |
| [24] | ROCKWOOD K, SONG X W, MACKNIGHT C,et al. A global clinical measure of fitness and frailty in elderly people[J]. J De L'association Med Can,2005,173(5):489-495. DOI:10.1503/cmaj.050051. |
| [25] | 石婧,石冰,陶永康,等. 基于衰弱指数评估的老年人衰弱状况与死亡风险的相关性分析[J]. 中华流行病学杂志,2020,41(11):1824-1830. DOI:10.3760/cma.j.cn112338-20200506-00691. |
| [26] | GU D N, DUPRE M E, SAUTTER J,et al. Frailty and mortality among Chinese at advanced ages[J]. J Gerontol B Psychol Sci Soc Sci,2009,64(2):279-289. DOI:10.1093/geronb/gbn009. |
| [27] | 黄庆波,王晓华,陈功. 10项流调中心抑郁自评量表在中国中老人群中的信效度[J]. 中国健康心理学杂志,2015,23(7):1036-1041. DOI:10.13342/j.cnki.cjhp.2015.07.023. |
| [28] | KULMINSKI A M, UKRAINTSEVA S V, KULMINSKAYA I V,et al. Cumulative deficits better characterize susceptibility to death in elderly people than phenotypic frailty:lessons from the Cardiovascular Health Study[J]. J Am Geriatr Soc,2008,56(5):898-903. DOI:10.1111/j.1532-5415.2008.01656.x. |
| [29] | DEMIRTAS H, FREELS S A, YUCEL R M. Plausibility of multivariate normality assumption when multiply imputing non-Gaussian continuous outcomes:a simulation assessment[J]. J Stat Comput Simul,2008,78(1):69-84. DOI:10.1080/10629360600903866. |
| [30] | 张文娟,付敏. 长期护理保险制度中老年人的失能风险和照料时间——基于Barthel指数的分析[J]. 保险研究,2020(5):80-93. DOI:10.13497/j.cnki.is.2020.05.006. |
| [31] | TEO T, KHINE M S. Structural equation modeling in educational research:concepts and applications[M]. Rotterdam:Sense Publishers,2009. |
| [32] | ETMAN A, BURDORF A, VAN DER CAMMEN T J,et al. Socio-demographic determinants of worsening in frailty among community-dwelling older people in 11 European countries[J]. J Epidemiol Community Health,2012,66(12):1116-1121. DOI:10.1136/jech-2011-200027. |
| [33] | RODRIGUEZ-MAÑAS L, FRIED L P. Frailty in the clinical scenario[J]. Lancet,2015,385(9968):e7-9. DOI:10.1016/s0140-6736(14)61595-6. |
| [34] | BRAY N W, SMART R R, JAKOBI J M,et al. Exercise prescription to reverse frailty[J]. Appl Physiol Nutr Metab,2016,41(10):1112-1116. DOI:10.1139/apnm-2016-0226. |
| [35] | STOLZ E, MAYERL H, RÁSKY É,et al. Does sample attrition affect the assessment of frailty trajectories among older adults? A joint model approach[J]. Gerontology,2018,64(5):430-439. DOI:10.1159/000489335. |
| [36] | STOW D, MATTHEWS F E, HANRATTY B. Frailty trajectories to identify end of life:a longitudinal population-based study[J]. BMC Med,2018,16(1):171. DOI:10.1186/s12916-018-1148-x. |
| [37] | AGUAYO G A, HULMAN A, VAILLANT M T,et al. Prospective association among diabetes diagnosis,HbA1c,glycemia,and frailty trajectories in an elderly population[J]. Diabetes Care,2019,42(10):1903-1911. DOI:10.2337/dc19-0497. |
| [38] | GALE C R, COOPER C, SAYER A A. Prevalence of frailty and disability:findings from the English Longitudinal Study of Ageing[J]. Age Ageing,2015,44(1):162-165. DOI:10.1093/ageing/afu148. |
| [39] | HARTTGEN K, KOWAL P, STRULIK H,et al. Patterns of frailty in older adults:comparing results from higher and lower income countries using the Survey of Health,Ageing and Retirement in Europe (SHARE) and the Study on Global Ageing and Adult Health (SAGE)[J]. PLoS One,2013,8(10):e75847. DOI:10.1371/journal.pone.0075847. |
| [40] | PEL-LITTEL R E, SCHUURMANS M J, EMMELOT-VONK M H,et al. Frailty:defining and measuring of a concept[J]. J Nutr Health Aging,2009,13(4):390-394. DOI:10.1007/s12603-009-0051-8. |
| [41] | XUE Q L. The frailty syndrome:definition and natural history[J]. Clin Geriatr Med,2011,27(1):1-15. DOI:10.1016/j.cger.2010.08.009. |
| [42] | YANG Y, LEE L C. Sex and race disparities in health:cohort variations in life course patterns[J]. Soc Forces,2009,87(4):2093-2124. DOI:10.1353/sof.0.0183. |
| [43] | ETMAN A, KAMPHUIS C B, VAN DER CAMMEN T J,et al. Do lifestyle,health and social participation mediate educational inequalities in frailty worsening?[J]. Eur J Public Health,2015,25(2):345-350. DOI:10.1093/eurpub/cku093. |
| [44] | BAKKER C J, KOFFEL J B, THEIS-MAHON N R. Measuring the health literacy of the Upper Midwest[J]. J Med Libr Assoc,2017,105(1):34-43. DOI:10.5195/jmla.2017.105. |
| [45] | 侯桂云,黎光明,谢晋艳,等. 老年人认知功能的变化轨迹:基于潜变量增长模型的分析[J]. 心理科学,2018,41(4):835-841. DOI:10.16719/j.cnki.1671-6981.20180411. |
| [46] | 解瑞宁,李英娥. 社区老年人认知功能及影响因素[J]. 中国健康心理学杂志,2015,23(8):1222-1224. DOI:10.13342/j.cnki.cjhp.2015.08.029. |
| [47] | 王会会,王君俏,谢博钦,等. 养老机构非卧床老年人衰弱影响因素的路径分析[J]. 护理学杂志,2018,33(13):76-80. DOI:10.3870/j.issn.1001-4152.2018.13.076. |
| [48] | DENT E, MORLEY J E, CRUZ-JENTOFT A J,et al. Physical frailty:ICFSR international clinical practice guidelines for identification and management[J]. J Nutr Health Aging,2019,23(9):771-787. DOI:10.1007/s12603-019-1273-z. |
| [49] | PAULO T R S, TRIBESS S, SASAKI J E,et al. A cross-sectional study of the relationship of physical activity with depression and cognitive deficit in older adults[J]. J Aging Phys Act,2016,24 (2):311-321. DOI:10.1123/japa.2014-0253. |
| [50] | VIRTUOSO JÚNIOR J S, TRIBESS S, PAULO T R,et al. Physical activity as an indicator of predictive functional disability in elderly[J]. Rev Lat Am Enfermagem,2012,20(2):259-265. DOI:10.1590/s0104-11692012000200007. |
| [51] | TRIBESS S, VIRTUOSO JÚNIOR J S, OLIVEIRA R J. Physical activity as a predictor of absence of frailty in the elderly[J]. Rev Assoc Med Bras:1992,2012,58(3):341-347. DOI:10.1590/s0104-42302012000300015. |
| [52] | ROBERTS C K, HEVENER A L, BARNARD R J. Metabolic syndrome and insulin resistance:underlying causes and modification by exercise training[J]. Compr Physiol,2013,3(1):1-58. DOI:10.1002/cphy.c110062. |
| [53] | LAUTENSCHLAGER N T, COX K L, FLICKER L,et al. Effect of physical activity on cognitive function in older adults at risk for Alzheimer disease:a randomized trial[J]. JAMA,2008,300(9):1027-1037. DOI:10.1001/jama.300.9.1027. |
| [54] | POWER G A, DALTON B H, BEHM D G,et al. Motor unit survival in lifelong runners is muscle dependent[J]. Med Sci Sports Exerc,2012,44(7):1235-1242. DOI:10.1249/mss.0b013e318249953c. |
| [55] | GILLESPIE L D, ROBERTSON M C, GILLESPIE W J,et al. Interventions for preventing Falls in older people living in the community[J]. Cochrane Database Syst Rev,2012(9):CD007146. DOI:10.1002/14651858.cd007146.pub3. |
| [56] | IRELAND A, MADEN-WILKINSON T, GANSE B,et al. Effects of age and starting age upon side asymmetry in the arms of veteran tennis players:a cross-sectional study[J]. Osteoporos Int,2014,25(4):1389-1400. DOI:10.1007/s00198-014-2617-5. |
| [57] | WALSTON J, MCBURNIE M A, NEWMAN A,et al. Frailty and activation of the inflammation and coagulation systems with and without clinical comorbidities:results from the Cardiovascular Health Study[J]. Arch Intern Med,2002,162(20):2333-2341. DOI:10.1001/archinte.162.20.2333. |
| [58] | KOJIMA G, ILIFFE S, TANIGUCHI Y,et al. Prevalence of frailty in Japan:a systematic review and meta-analysis[J]. J Epidemiol,2017,27(8):347-353. DOI:10.1016/j.je.2016.09.008. |
| [1] | 冯晓玉, 李婉玲, 吕思漫, 倪翠萍, 王浩成, 刘宇. 基于文献计量学的interRAI家庭护理评估工具国际研究现状及热点分析[J]. 中国全科医学, 2023, 26(34): 4351-4358. |
| [2] | 顾晗昕, 刘洋, 刘远立. 政策工具视角下社区老年人跌倒干预国际比较研究[J]. 中国全科医学, 2023, 26(34): 4231-4238. |
| [3] | 王越, 陈晴, 刘鲁蓉. 中国老年人抑郁检出率及影响因素的Meta分析[J]. 中国全科医学, 2023, 26(34): 4329-4335. |
| [4] | 余新艳, 赵珺, 赵晓晔, 姜清茹, 陈雅田, 王艳, 张海澄. 移动智慧医疗在基层老年慢性病患者心血管病防控中的应用研究[J]. 中国全科医学, 2023, 26(33): 4167-4172. |
| [5] | 辛功恺, 丛欣, 袁磊, 程悦彤, 倪翠萍, 张巍巍, 張平平, 刘宇. 失智症老年人综合评估工具的研究进展[J]. 中国全科医学, 2023, 26(33): 4103-4109. |
| [6] | 张帅, 李琴, 李东锋, 肖金平, 李云鹏. 使用固体燃料与中国老年人高血压发病风险的前瞻性队列研究[J]. 中国全科医学, 2023, 26(32): 4001-4006. |
| [7] | 陈希, 章娟, 李霖, 张佳琪, 吴耀丽, 郭慧, 王超群. 中国中老年人体力活动与全因死亡风险的关系:前瞻性队列研究[J]. 中国全科医学, 2023, 26(31): 3890-3895. |
| [8] | 张鹏, 高鹰, 杨洪喜, 万春晓. 中国长寿地区老年人血尿酸水平与慢性肾脏病发病风险研究[J]. 中国全科医学, 2023, 26(31): 3884-3889. |
| [9] | 段妍琴, 彭颖, 刘胜兰, 刘海姣, 杨慧琼, 胡海清. 门诊老年患者潜在不适当用药情况及影响因素分析[J]. 中国全科医学, 2023, 26(31): 3902-3907. |
| [10] | 张明, 许静, 孙振华, 赵文浩, 马樱倩, 张建桥, 沈海萍. 图像引导的光动力治疗改善老年重度梗阻食管癌患者营养状况的研究[J]. 中国全科医学, 2023, 26(30): 3780-3784. |
| [11] | 周思静, 罗邦安, 曹慧, 张熙, 王东欣. ≥65岁居民老年痴呆流行病学特征及其与慢性病共病的相关性研究[J]. 中国全科医学, 2023, 26(29): 3616-3621. |
| [12] | 王萧冉, 张丹. 慢性病共病对我国老年人焦虑症状的影响研究:基于倾向性评分匹配[J]. 中国全科医学, 2023, 26(29): 3622-3627. |
| [13] | 周小琦, 刘新会, 张微, 李长风, 严亚琼. 老年人丙氨酸氨基转移酶和天冬氨酸氨基转移酶/丙氨酸氨基转移酶与2型糖尿病及代谢综合征的相关性研究[J]. 中国全科医学, 2023, 26(29): 3645-3649. |
| [14] | 赵晓华, 杜林, 高胜男, 蒋子云. 老年糖尿病合并多发肌肉深部脓肿一例报道并文献分析[J]. 中国全科医学, 2023, 26(29): 3715-3718. |
| [15] | 孙梦杰, 刘腊梅, 王佳南, 王鹏, 张振香. 老年慢性病患者医院-家庭过渡期真实经历与护理体验质性研究的Meta整合[J]. 中国全科医学, 2023, 26(28): 3565-3572. |
| 阅读次数 | ||||||
|
全文 |
|
|||||
|
摘要 |
|
|||||


