中国全科医学 ›› 2022, Vol. 25 ›› Issue (04): 489-496.DOI: 10.12114/j.issn.1007-9572.2021.00.333

所属专题: 老年人群健康最新文章合集 营养最新文章合集 老年问题最新文章合集

• 论著·方法与工具 • 上一篇    下一篇

基于预测模型的养老机构简版老年人营养筛查工具构建与信效度验证

朱丹, 谢红*   

  1. 100083 北京市,北京大学护理学院
  • 收稿日期:2021-05-15 修回日期:2021-11-13 出版日期:2022-02-05 发布日期:2022-01-29
  • 通讯作者: 谢红

DevelopmentReliability and Validity of a ConcisePrediction Model-based Nutritional Risk Assessment Scale for Nursing Home-dwelling Older People

ZHU DanXIE Hong*   

  1. Peking University School of NursingBeijing 100083China

    *Corresponding authorXIE HongAssociate professorMaster supervisorE-mailxh6959@163.com

  • Received:2021-05-15 Revised:2021-11-13 Published:2022-02-05 Online:2022-01-29

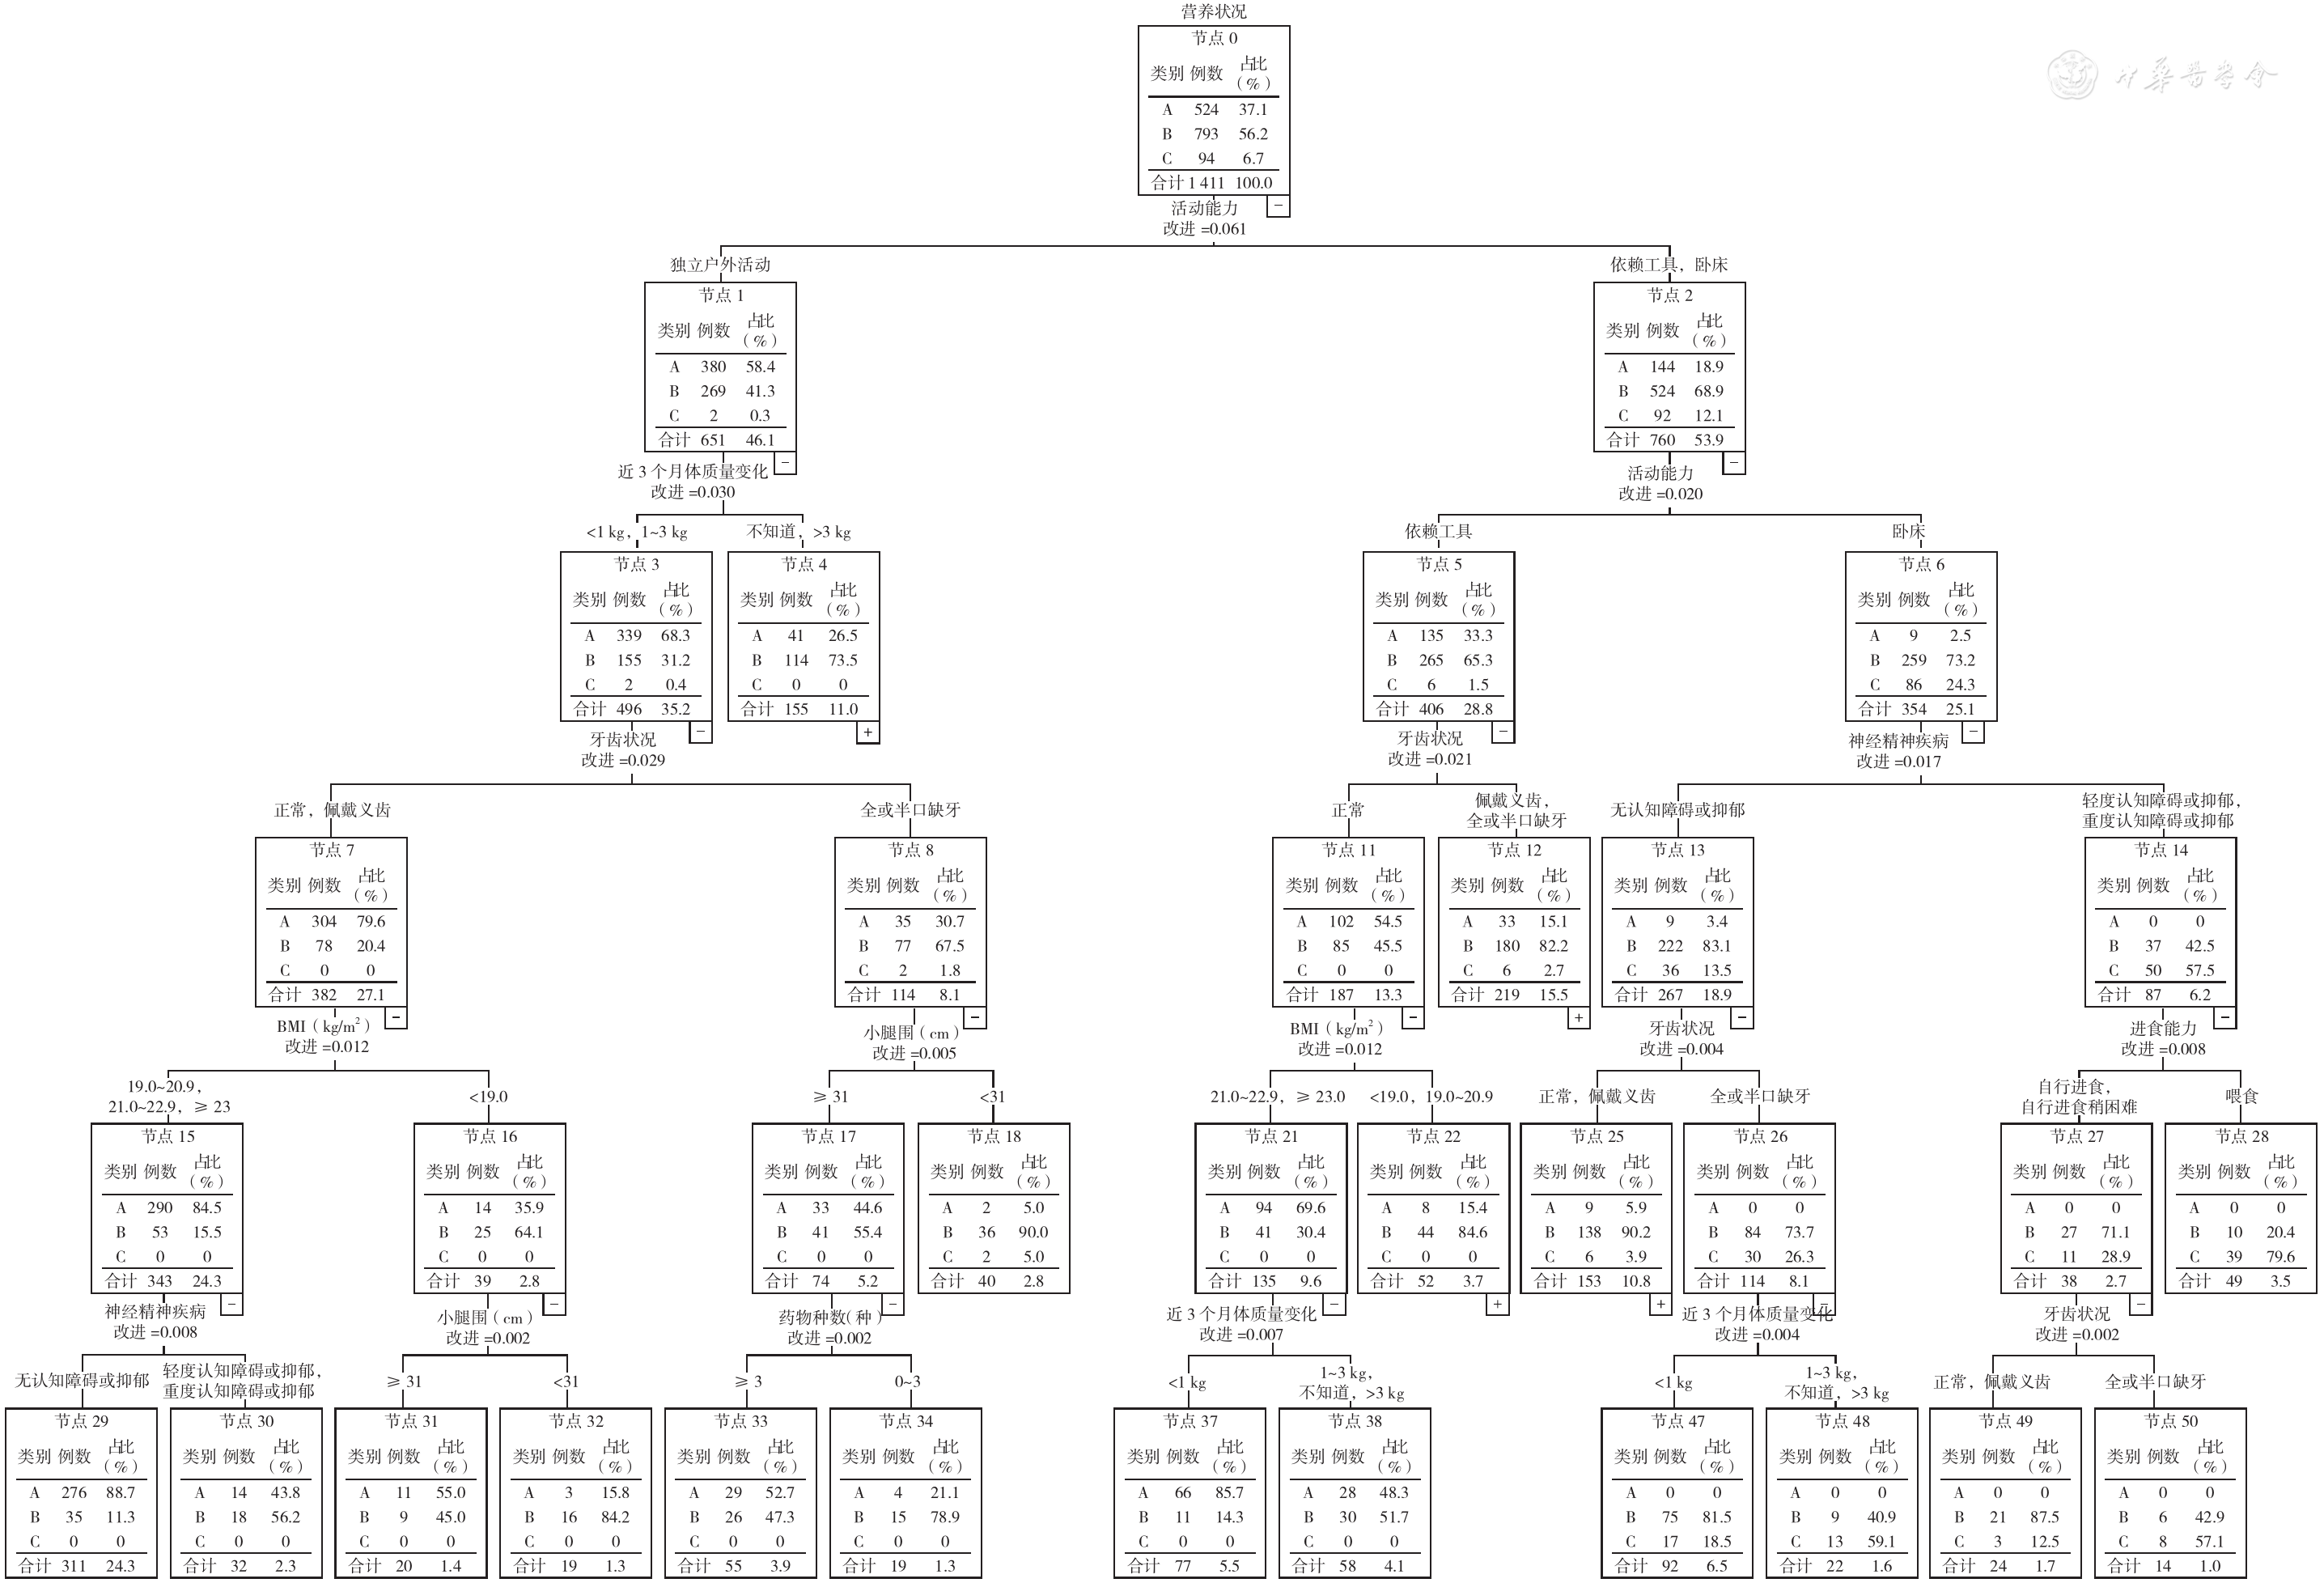
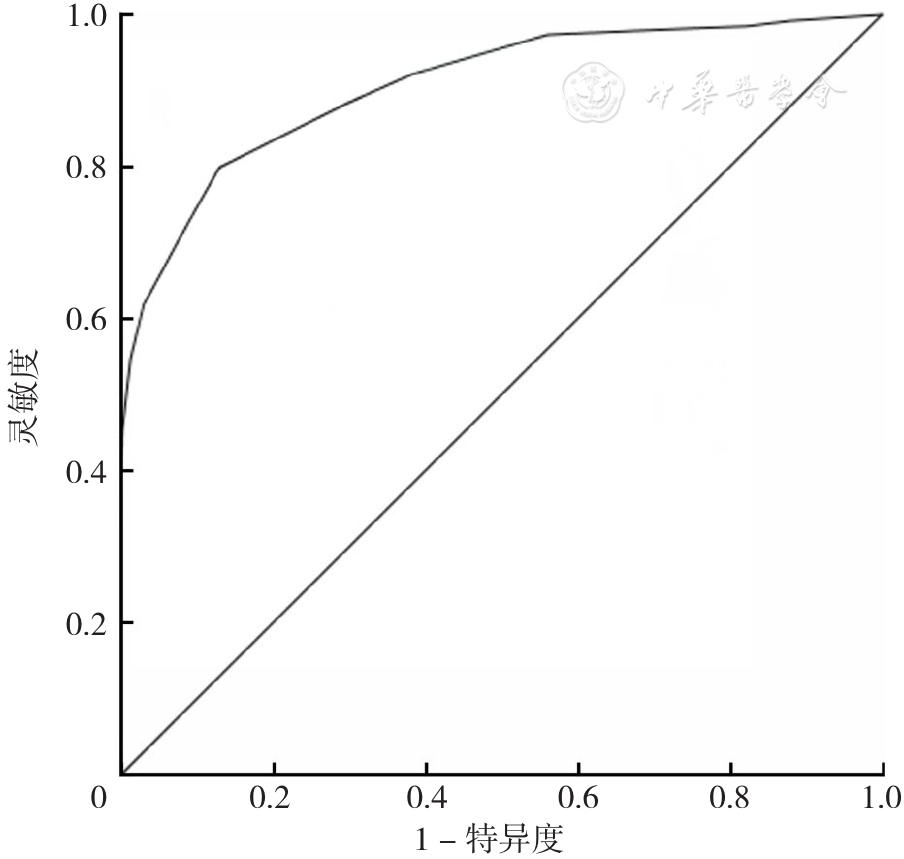
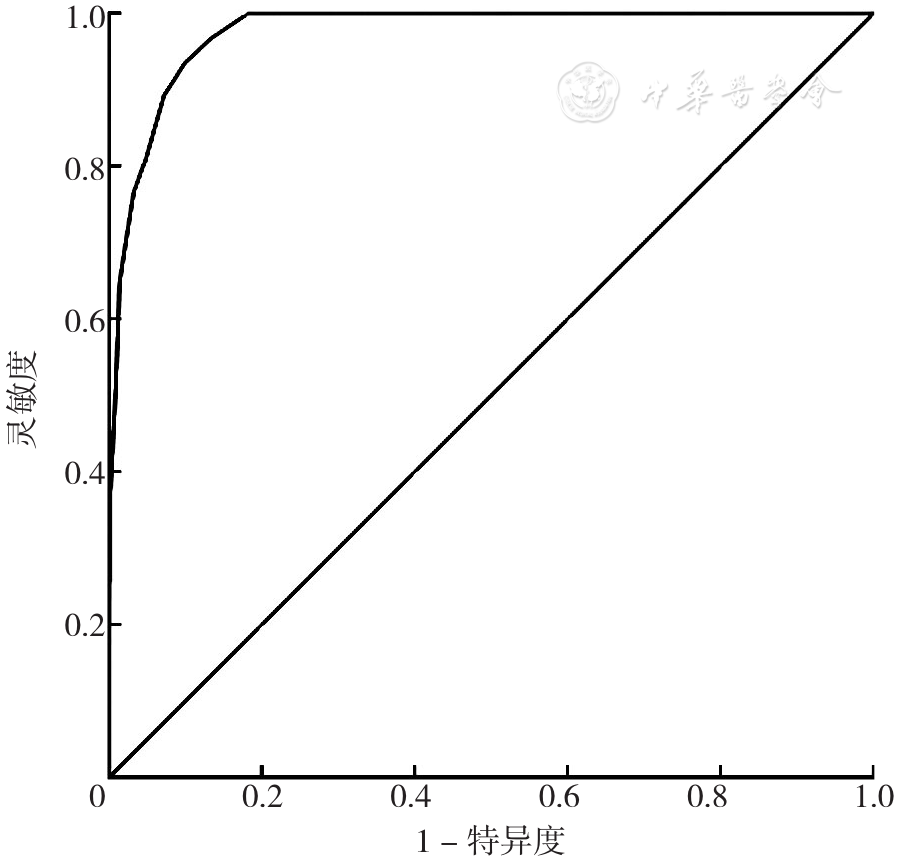
摘要: 背景国家卫生健康委员会行业标准《老年人营养不良风险评估》(WS/T 552-2017)在养老机构老年人应用中信效度不理想,部分条目不适用于养老机构,造成养老机构老年人营养状况识别缺乏统一工具。目的构建可靠、应用性强且适于养老机构使用的简版老年人营养筛查工具,并检验其信效度。方法2019年11月至2020年1月,采用方便抽样对6城市12家养老机构中1 411例老年人进行问卷调查,内容包括一般资料和《老年人营养不良风险评估》量表,经项目分析初筛变量后代入有序多分类Logistic回归模型,将有统计学意义的变量再代入决策树模型,分析老年人工作特征(ROC)曲线和曲线下面积(AUC),优选最佳模型,构建简版老年人营养筛查工具,采用ROC曲线进行临界值划分。通过Cronbach's α系数、探索性因子分析、AUC、灵敏度、特异度、约登指数、Kappa系数评价工具信效度。结果Logistic回归模型预测营养良好、营养不良风险、营养不良的AUC分别为0.962、0.942、0.989,决策树模型分别为0.914、0.868、0.968。Logistic回归模型为最优模型,形成的简版老年人营养筛查工具由BMI、近3个月体质量变化、活动能力、牙齿状况、神经精神疾病、疾病种数、药物种数、户外独立活动时间、进食能力、小腿围10个条目组成,总分0~14.5分,评分0~3.0分表示营养良好,3.5~7.5分表示有营养不良风险,8.0~14.5分表示营养不良。工具的Cronbach's α系数为0.463,探索性因子分析得到5个特征值>1的公因子,累积解释变异量为69.9%。判断营养不良风险和营养不良的灵敏度为0.799、0.809,特异度为0.870、0.953,约登指数为0.670、0.761,AUC为0.902、0.976,Kappa系数为0.627。使用最终版简版老年人营养筛查工具对1 411例老年人的营养状况进行分类统计,结果显示634例(44.93%)老年人营养状况良好,639例(45.29%)有营养不良风险,138例(9.78%)营养不良。结论基于Logistic回归模型构建的简版养老机构老年人营养筛查工具有较好的信效度,可有效识别有营养不良风险和营养不良的老年人。

关键词: 老年人, 营养筛查, 养老机构, 预测模型, 信度, 效度

Abstract: Background

The Malnutrition Risk Assessment for Elderly Adults (WS/T 552-2017) , a malnutrition risk assessment scale issued by the National Health Commission has proven to have unsatisfied reliability and validity, with some inappropriate items in nursing home-dwelling older people. There is a lack of nutritional risk assessment scale for nursing home-dwelling Chinese older people.

Objective

To establish a reliable, concise, prediction model-based nutritional risk assessment scale applicable for nursing home-dwelling older people, and test its reliability and validity.

Methods

A survey using a questionnaire consisting of general demographic information and the Malnutrition Risk Assessment for Elderly Adults (WS/T 552-2017) was conducted with a convenience sample of 1 411 elderly people in 12 nursing homes of 6 cities, from November 2019 to January 2020. Variables screened by item analysis were included in an ordinal, multinominal Logistic regression model, and the statistically significant ones of them were then incorporated into a decision tree model. After that, ROC analysis was used to estimate the AUC of Logistic regression model and decision tree model in predicting nutrition status to select a better model to develop a concise nutritional risk assessment scale, and to determine the diagnostic threshold for nutrition status. Cronbach's α, exploratory factor analysis, estimation of AUC, sensitivity, specificity, Youden index and Kappa coefficient were used to evaluate the reliability and validity of the scale.

Results

For predicting good nutrition, malnutritional risk, and malnutrition, the AUC of Logistic regression model was 0.962, 0.942, 0.989, respectively, and that of the decision tree model was 0.914, 0.868, and 0.968, respectively, indicating that the Logistic regression model was better, and suitable for developing the nutritional risk assessment scale. The final concise Nutritional Risk Assessment Scale for Nursing Home-dwelling Older People is composed of 10 items: BMI, changes in weight in recent 3 months, ability of engaging in daily activities, dental status, nervous and mental diseases, number of illnesses, types of drugs used, time spent on doing outdoor activities independently, eating ability, and the circumference of the shin. The total score of the scale for nursing home-dwelling older people can be 0-14.5 points, with 0-3.0 stands for good nutrition, 3.5-7.5 for nutritional risk, and 8.0-14.5 for malnutrition. The Cronbach's α of the scale was 0.463. Exploratory factor analysis obtained five common factors with eigenvalues greater than 1, explaining 69.9% of the total variance. When predicting the malnutritional risk, the AUC of the scale was 0.902, with 0.799 sensitivity, 0.870 specificity, and 0.670 Youden index. When predicting malnutrition, the AUC of the scale was 0.976, with 0.809 sensitivity, 0.953 specificity, and 0.761 Youden index. The Kappa coefficient for the scale was 0.627. The nutritional status of the 1 411 participants assessed by the scale was: 634 (44.93%) had good nutrition, 639 (45.29%) had malnutritional risk, and 138 (9.78%) had malnutrition.

Conclusion

The concise, Nutritional Risk Assessment Scale for Nursing Home-dwelling Older People developed using a Logistic regression model has proven to have good reliability and validity, which could be used as a tool to identify malnutrition risk or malnutrition in nursing home-dwelling older people.

Key words: Aged, Nutritional screening, Long-term care facilities, Prediction model, Reliability, Validity

中图分类号: