中国全科医学 ›› 2025, Vol. 28 ›› Issue (26): 3258-3263.DOI: 10.12114/j.issn.1007-9572.2024.0549

• 论著 • 上一篇    下一篇

腰高比和腰臀比及BMI对代谢综合征的预测价值研究

殷佳慧, 杨昕晖, 王京京, 张雅静, 王丽娟, 付佐娣, 孔祥双, 郭光霞, 李玉凤*()   

  1. 101200 北京市,首都医科大学附属北京友谊医院平谷医院
  • 收稿日期:2024-09-10 修回日期:2025-02-10 出版日期:2025-09-15 发布日期:2025-07-22
  • 通讯作者: 李玉凤

  • 作者贡献:

    殷佳慧负责数据统计、数据解释和文章撰写;杨昕晖负责数据整理核查、数据统计;王京京、张雅静、王丽娟、付佐娣负责项目执行、数据收集、数据整理;孔祥双、郭光霞负责项目管理和监督;李玉凤负责文章审阅、提供修改意见,对文章整体负责。

  • 基金资助:
    首都卫生发展科研专项(首发2020-2-7131)

Predictive Value Waist-to-height Ratio, Waist-to-hip Ratio and Body Mass Index for Metabolic Syndrome

YIN Jiahui, YANG Xinhui, WANG Jingjing, ZHANG Yajing, WANG Lijuan, FU Zuodi, KONG Xiangshuang, GUO Guangxia, LI Yufeng*()   

  1. Beijing Friendship Hospital Pinggu Campus, Capital Medical University, Beijing 101200, China
  • Received:2024-09-10 Revised:2025-02-10 Published:2025-09-15 Online:2025-07-22
  • Contact: LI Yufeng

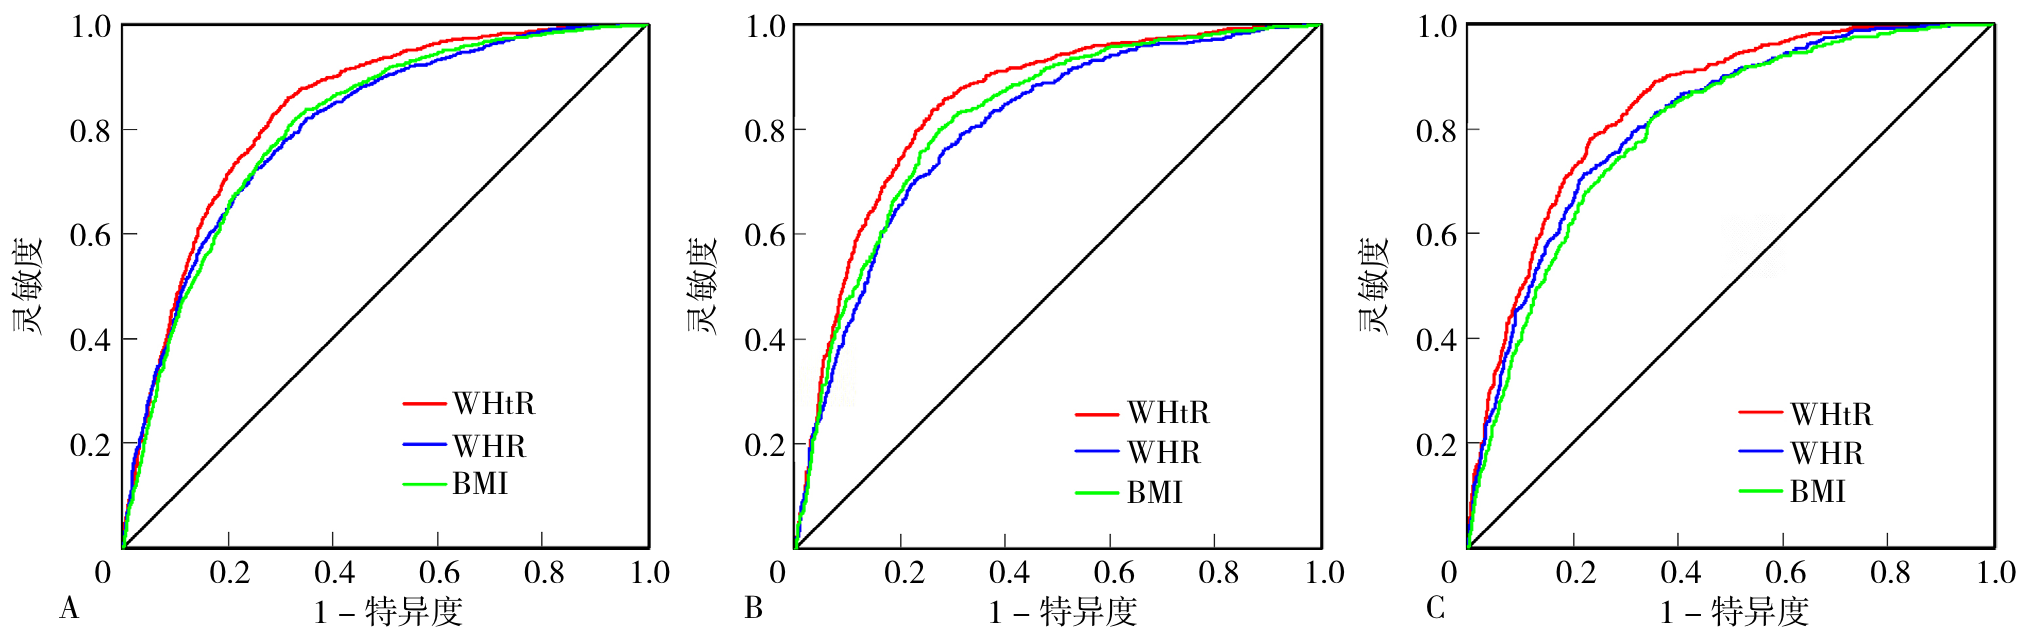
摘要: 背景 代谢综合征(MS)显著增加了心血管疾病等慢性病的发生风险,对MS进行早期筛查和干预至关重要。BMI不能反映中心性肥胖,有指南建议将腰高比(WHtR)作为肥胖诊断新指标,目前关于WHtR与MS关联的研究较少。 目的 探讨WHtR、腰臀比(WHR)及BMI与MS的相关性,比较以上3项人体测量学指标对MS的预测价值。 方法 本研究利用2013年6月—2014年9月在北京平谷地区进行的代谢性疾病调查队列数据库。采用中华医学会糖尿病学分会2020年制订的MS的诊断标准,依据是否患有MS将研究对象分为非MS组与MS组,比较两组的一般临床特征。采用Logistic回归分析探究MS患病的影响因素,采用受试者工作特征(ROC)曲线评价WHtR、WHR和BMI对MS的预测价值。 结果 共有4 001例有效数据纳入分析,平均年龄(50.3±11.8)岁,MS组1 617例,非MS组2 384例。MS的患病率为40.4%(1 617/4 001),加权后患病率为39.5%。MS组WHtR、WHR和BMI高于非MS组(P<0.05)。多因素Logistic回归分析结果显示,WHtR≥0.5(OR=2.074,95%CI=1.523~2.823)、男性WHR≥0.90/女性WHR≥0.85(OR=2.646,95%CI=2.185~3.204)、24.0 kg/m2≤BMI<28.0 kg/m2(OR=2.259,95%CI=1.717~2.973)、BMI≥28.0 kg/m2(OR=4.530,95%CI=3.320~6.181)是MS的独立影响因素(P<0.05)。分别在总体人群、男性和女性中分析WHtR、WHR和BMI对于MS的预测价值,结果发现,在上述3个人群中,WHtR预测MS的曲线下面积(AUC)均大于WHR和BMI(P<0.05)。WHtR在以上3个人群中预测MS的AUC分别为0.835、0.847和0.842,最佳截断值分别为0.526、0.526和0.548。 结论 WHtR对MS风险的预测作用优于WHR和BMI,可作为预测MS风险的简易指标。

关键词: 代谢综合征, 腰围-身高比, 腰臀比, BMI, 预测, 横断面研究

Abstract:

Background

Metabolic syndrome (MS) significantly increases the risk of chronic diseases like cardiovascular diseases. Early screening and interventions for MS are crucial. Body mass index (BMI) does not reflect central obesity, and the recent guideline suggests the waist-to-height ratio (WHtR) as a new diagnostic indicator for obesity. There is limited research on the predictive value of WHtR for MS.

Objective

To explore the correlation of WHtR, waist-to-hip ratio (WHR), and BMI with MS, and compare the predictive value of the three anthropometric indicators for MS.

Methods

This study using data available from the metabolic disease survey cohort database conducted from June 2013 to September 2014 in Pinggu, Beijing. MS was diagnosed based on the standards of the Chinese Diabetes Society 2020. Subjects were divided into non-MS and MS groups based on the presence or absence of MS, and the general clinical characteristics of the two groups were compared. Logistic regression analysis was used to identify risk factors for MS, and the receiver operating characteristic (ROC) curve was used to evaluate the predictive value of WHtR, WHR, and BMI for MS.

Results

A total of 4 001 valid cases were included in the analysis, with an average age of (50.3±11.8) years. There were 1 617 cases in the MS group, and 2 384 cases in non-MS group, with a prevalence of MS of 40.4% (1 617/4 001), and the weighted prevalence rate is 39.5%. The WHtR, WHR and BMI in the MS group were all significantly higher than those of the non-MS group (all P<0.05). Multivariable Logistic regression analysis indicated that WHtR≥0.5 (OR=2.074, 95%CI=1.523-2.823), male WHR≥0.90/female WHR≥0.85 (OR=2.646, 95%CI=2.185-3.204), 24.0 kg/m2≤BMI<28.0 kg/m2 (OR=2.259, 95%CI=1.717-2.973), and BMI≥28.0 kg/m2 (OR=4.530, 95%CI=3.320-6.181) were independent risk factors for MS (all P<0.05). The predictive value of WHtR, WHR and BMI for MS was analyzed in the overall population, males, and females, respectively. It was found that the area under the curve (AUC) of WHtR in predicting MS was significantly higher than that of WHR and BMI in all three groups (P<0.05). The AUC of WHtR in predicting MS in the above three groups was 0.835, 0.847, and 0.842, respectively; with the optimal cutoff values of 0.526, 0.526, and 0.548, respectively.

Conclusion

WHtR is superior to WHR and BMI in predicting the risk of MS, and it can be used as a simple indicator for predicting the risk of MS.

Key words: Metabolic syndrome, Waist-to-height ratio, Waist-to-hip ratio, BMI, Forecasting, Cross-sectional studies