
中国全科医学 ›› 2022, Vol. 25 ›› Issue (23): 2856-2863.DOI: 10.12114/j.issn.1007-9572.2022.0236
潘梓末, 褚琳, 陈陵霞*( ), 王晶桐
收稿日期:2022-01-08
修回日期:2022-04-20
出版日期:2022-08-15
发布日期:2022-05-26
通讯作者:
陈陵霞
基金资助:
Zimo PAN, Lin CHU, Lingxia CHEN*(), Jingtong WANG
Received:2022-01-08
Revised:2022-04-20
Published:2022-08-15
Online:2022-05-26
Contact:
Lingxia CHEN
About author:摘要: 背景 随着血糖监测技术的发展,近些年来人们开始使用扫描式葡萄糖监测系统(FGMS)"全景式"地观察2型糖尿病(T2DM)患者的血糖水平,明确FGMS指标与T2DM并发症之间的关系有助于提高其临床应用价值,但目前相关研究较少。 目的 探究佩戴FGMS的T2DM患者葡萄糖在目标范围内时间(TIR)等指标与尿白蛋白/肌酐比值(UACR)的相关性。 方法 选取2019年1月至2021年10月于北京大学人民医院老年科就诊并佩戴FGMS的T2DM患者79例,以尿液检查中UACR是否<30 mg/g将患者分为无白蛋白尿组(n=50)和白蛋白尿组(n=29)。比较两组患者的临床特征、实验室检查指标及FGMS指标等。采用Pearson相关、Spearman秩相关分析探讨TIR、高血糖时间(TAR)与糖化血红蛋白(HbA1c)的相关性。分别采用Pearson相关、Spearman秩相关、偏相关分析探讨FGMS指标与lnUACR的相关性。使用多因素Logistic回归分析探究T2DM患者发生白蛋白尿的影响因素,采用受试者工作特征(ROC)曲线评估TIR对白蛋白尿的预测价值。 结果 白蛋白尿组T2DM病程长于无白蛋白尿组,三酰甘油(TG)、HbA1c、平均血糖(MBG)、TAR、平均血糖标准差(SDBG)、最大葡萄糖波动幅度(LAGE)、平均葡萄糖波动幅度(MAGE)、连续每隔2 h血糖净作用(CONGA2)高于无白蛋白尿组,TIR低于无白蛋白尿组(P<0.05)。Pearson相关、Spearman秩相关分析结果显示,TIR与HbA1c呈负相关(P<0.001),TAR与HbA1c呈正相关(P<0.001)。Pearson相关、Spearman秩相关、偏相关分析结果均表明,TIR与lnUACR呈负相关(P<0.001),MBG、TAR、SDBG、LAGE、MAGE、CONGA2与lnUACR呈正相关(P<0.001)。多因素Logistic回归分析结果显示,TIR>70%〔OR=0.038,95%CI(0.003,0.467)〕是T2DM患者出现白蛋白尿的保护因素(P<0.05),TAR升高〔OR=1.046,95%CI(1.000,1.094)〕是T2DM患者出现白蛋白尿的危险因素(P<0.05)。TIR预测T2DM患者出现白蛋白尿的ROC曲线下面积(AUC)为0.784〔95%CI(0.674,0.894)〕(P=0.003),灵敏度为78%,特异度为83%,最佳切点为69.71%。 结论 在FGMS指标中,TIR>70%是T2DM患者出现白蛋白尿的保护因素,TAR升高是T2DM患者出现白蛋白尿的危险因素。同时,SDBG、LAGE、MAGE、CONGA2等多种反映血糖波动的指标也与UACR密切相关。对TIR水平较低及TAR、SDBG、LAGE、MAGE、CONGA2水平较高的T2DM患者进行FGMS筛查有助于早期识别及预防白蛋白尿的发生、发展。
| 组别 | 例数 | 年龄(岁) | 性别(男/女) | BMI(kg/m2) | T2DM病程〔M(P25,P75),年〕 | 高血压病史〔n(%)〕 | ACEI/ARB使用史〔n(%)〕 | SGLT-2抑制剂使用史〔n(%)〕 | 降压药物使用史〔n(%)〕 | 吸烟史〔n(%)〕 |
|---|---|---|---|---|---|---|---|---|---|---|
| 无白蛋白尿组 | 50 | 66.6±13.5 | 33/17 | 24.9±3.1 | 12(5,20) | 34(68.0) | 20(40.0) | 2(4.0) | 21(42.0) | 18(36.0) |
| 白蛋白尿组 | 29 | 66.7±14.4 | 18/11 | 26.2±5.1 | 20(12,30) | 21(72.4) | 11(37.9) | 4(13.8) | 12(41.4) | 11(37.9) |
| 检验统计量值 | -0.030 | 0.124a | -1.105 | 930.000b | 0.169a | 0.033a | 2.508a | 0.003a | 0.029a | |
| P值 | 0.977 | 0.725 | 0.278 | 0.003 | 0.681 | 0.856 | 0.113 | 0.957 | 0.864 | |
| 组别 | 收缩压(mm Hg) | 舒张压(mm Hg) | HbA1c(%) | TC(mmol/L) | TG〔M(P25,P75),mmol/L〕 | LDL-C(mmol/L) | HDL-C(mmol/L) | ALB(g/L) | FINS〔M(P25,P75),μU/ml〕 | |
| 无白蛋白尿组 | 131±18 | 75±10 | 7.7±1.4 | 4.21±1.05 | 1.31(1.04,2.01) | 2.55±0.85 | 1.14±0.31 | 41.3±4.9 | 10.54(7.53,13.67) | |
| 白蛋白尿组 | 140±18 | 76±12 | 9.2±2.0 | 4.52±1.22 | 1.64(1.22,3.02) | 2.68±0.77 | 1.17±0.59 | 39.7±4.6 | 7.62(5.96,27.11) | |
| 检验统计量值 | -1.893 | -0.353 | -3.256 | -1.206 | 922.000b | -0.655 | -0.314 | 1.432 | 382.500b | |
| P值 | 0.063 | 0.725 | 0.002 | 0.232 | 0.045 | 0.514 | 0.755 | 0.156 | 0.890 | |
| 组别 | FCP〔M(P25,P75),μg/L〕 | eGFR〔ml·min-1·(1.73 m2)-1〕 | FGMS佩戴天数(d) | FGMS计算次数(次) | MBG(mmol/L) | TAR〔M(P25,P75),%〕 | TIR(%) | TBR〔M(P25,P75),%〕 | ||
| 无白蛋白尿组 | 2.13(1.20,2.99) | 86.80±19.61 | 11.6±3.1 | 1 187±224 | 7.5±1.8 | 9.64(2.73,26.61) | 77.9±19.1 | 1.45(0.26,4.28) | ||
| 白蛋白尿组 | 2.59(1.52,3.80) | 81.34±25.88 | 11.1±3.5 | 1 169±250 | 9.6±1.8 | 44.13(31.50,58.29) | 55.4±21.0 | 0.60(0,1.91) | ||
| 检验统计量值 | 232.000b | 1.058 | 0.680 | 0.120 | -5.087 | 1 174.500b | 4.869 | 527.000b | ||
| P值 | 0.279 | 0.293 | 0.498 | 0.905 | <0.001 | <0.001 | <0.001 | 0.042 |
表1 两组患者的临床特征、血生化参数及FGMS指标比较
Table 1 Clinical characteristics,laboratory test parameters and blood glucose merics monitored by a flash glucose monitoring system in T2DM patients with and without albuminuria
| 组别 | 例数 | 年龄(岁) | 性别(男/女) | BMI(kg/m2) | T2DM病程〔M(P25,P75),年〕 | 高血压病史〔n(%)〕 | ACEI/ARB使用史〔n(%)〕 | SGLT-2抑制剂使用史〔n(%)〕 | 降压药物使用史〔n(%)〕 | 吸烟史〔n(%)〕 |
|---|---|---|---|---|---|---|---|---|---|---|
| 无白蛋白尿组 | 50 | 66.6±13.5 | 33/17 | 24.9±3.1 | 12(5,20) | 34(68.0) | 20(40.0) | 2(4.0) | 21(42.0) | 18(36.0) |
| 白蛋白尿组 | 29 | 66.7±14.4 | 18/11 | 26.2±5.1 | 20(12,30) | 21(72.4) | 11(37.9) | 4(13.8) | 12(41.4) | 11(37.9) |
| 检验统计量值 | -0.030 | 0.124a | -1.105 | 930.000b | 0.169a | 0.033a | 2.508a | 0.003a | 0.029a | |
| P值 | 0.977 | 0.725 | 0.278 | 0.003 | 0.681 | 0.856 | 0.113 | 0.957 | 0.864 | |
| 组别 | 收缩压(mm Hg) | 舒张压(mm Hg) | HbA1c(%) | TC(mmol/L) | TG〔M(P25,P75),mmol/L〕 | LDL-C(mmol/L) | HDL-C(mmol/L) | ALB(g/L) | FINS〔M(P25,P75),μU/ml〕 | |
| 无白蛋白尿组 | 131±18 | 75±10 | 7.7±1.4 | 4.21±1.05 | 1.31(1.04,2.01) | 2.55±0.85 | 1.14±0.31 | 41.3±4.9 | 10.54(7.53,13.67) | |
| 白蛋白尿组 | 140±18 | 76±12 | 9.2±2.0 | 4.52±1.22 | 1.64(1.22,3.02) | 2.68±0.77 | 1.17±0.59 | 39.7±4.6 | 7.62(5.96,27.11) | |
| 检验统计量值 | -1.893 | -0.353 | -3.256 | -1.206 | 922.000b | -0.655 | -0.314 | 1.432 | 382.500b | |
| P值 | 0.063 | 0.725 | 0.002 | 0.232 | 0.045 | 0.514 | 0.755 | 0.156 | 0.890 | |
| 组别 | FCP〔M(P25,P75),μg/L〕 | eGFR〔ml·min-1·(1.73 m2)-1〕 | FGMS佩戴天数(d) | FGMS计算次数(次) | MBG(mmol/L) | TAR〔M(P25,P75),%〕 | TIR(%) | TBR〔M(P25,P75),%〕 | ||
| 无白蛋白尿组 | 2.13(1.20,2.99) | 86.80±19.61 | 11.6±3.1 | 1 187±224 | 7.5±1.8 | 9.64(2.73,26.61) | 77.9±19.1 | 1.45(0.26,4.28) | ||
| 白蛋白尿组 | 2.59(1.52,3.80) | 81.34±25.88 | 11.1±3.5 | 1 169±250 | 9.6±1.8 | 44.13(31.50,58.29) | 55.4±21.0 | 0.60(0,1.91) | ||
| 检验统计量值 | 232.000b | 1.058 | 0.680 | 0.120 | -5.087 | 1 174.500b | 4.869 | 527.000b | ||
| P值 | 0.279 | 0.293 | 0.498 | 0.905 | <0.001 | <0.001 | <0.001 | 0.042 |
| 组别 | 例数 | SDBG(mmol/L) | CV(%) | MAGE(mmol/L) | LAGE(mmol/L) | MODD(mmol/L) | CONGA2(mmol/L) |
|---|---|---|---|---|---|---|---|
| 无白蛋白尿组 | 44 | 2.17±0.69 | 28.3±5.0 | 4.92±1.37 | 12.02±3.21 | 0.81±0.37 | 6.39±1.71 |
| 白蛋白尿组 | 17 | 2.98±1.23 | 30.1±7.8 | 6.32±2.30 | 15.20±4.81 | 0.64±0.27 | 8.44±2.29 |
| t值 | -2.551 | -0.898 | -2.357 | -3.006 | 1.642 | -3.805 | |
| P值 | 0.019 | 0.379 | 0.028 | 0.004 | 0.106 | <0.001 |
表2 两组患者FGMS血糖波动指标比较(±s)
Table 2 Metrics of blood glucose fluctuation monitored by a flash glucose monitoring system in T2DM patients with and without albuminuria
| 组别 | 例数 | SDBG(mmol/L) | CV(%) | MAGE(mmol/L) | LAGE(mmol/L) | MODD(mmol/L) | CONGA2(mmol/L) |
|---|---|---|---|---|---|---|---|
| 无白蛋白尿组 | 44 | 2.17±0.69 | 28.3±5.0 | 4.92±1.37 | 12.02±3.21 | 0.81±0.37 | 6.39±1.71 |
| 白蛋白尿组 | 17 | 2.98±1.23 | 30.1±7.8 | 6.32±2.30 | 15.20±4.81 | 0.64±0.27 | 8.44±2.29 |
| t值 | -2.551 | -0.898 | -2.357 | -3.006 | 1.642 | -3.805 | |
| P值 | 0.019 | 0.379 | 0.028 | 0.004 | 0.106 | <0.001 |
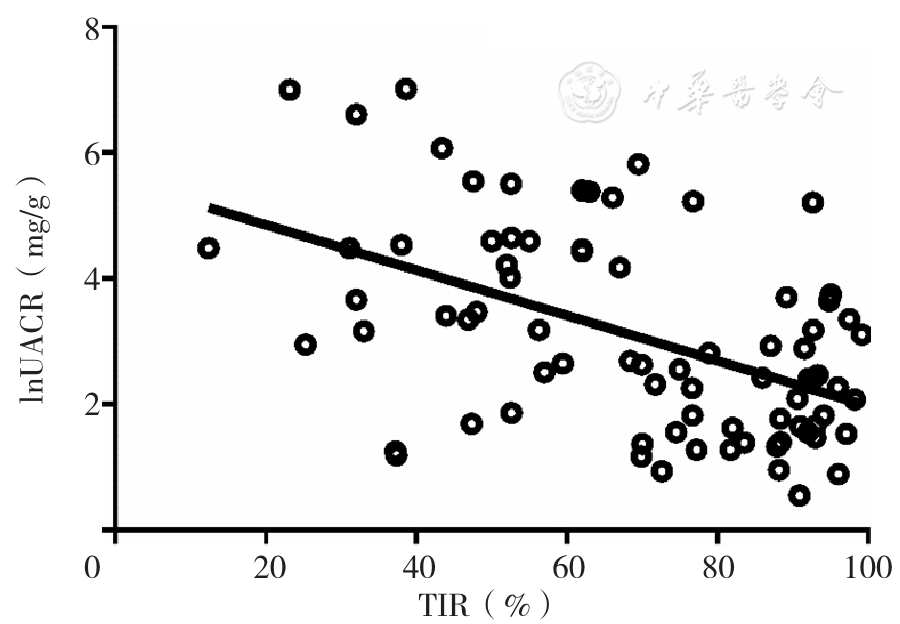
图1 TIR与lnUACR关系的散点图注:R2=0.258,P<0.001;UACR=尿白蛋白/肌酐比值,TIR=葡萄糖在目标范围内时间
Figure 1 Scatter plot of TIR and the natural logarithm-transformed UACR
| 变量 | r(rs)值 | P值 | 偏相关系数 | P值 |
|---|---|---|---|---|
| MBG | 0.516 | <0.001 | 0.299 | 0.024 |
| TAR | 0.469a | <0.001 | 0.338 | 0.010 |
| TIR | -0.508 | <0.001 | -0.373 | 0.004 |
| TBR | -0.143a | 0.210 | 0.101 | 0.455 |
| SDBG | 0.509 | <0.001 | 0.368 | 0.018 |
| CV | 0.245 | 0.057 | 0.184 | 0.251 |
| MAGE | 0.467 | <0.001 | 0.387 | 0.012 |
| LAGE | 0.425 | 0.001 | 0.318 | 0.043 |
| MODD | -0.195 | 0.132 | -0.019 | 0.904 |
| CONGA2 | 0.508 | <0.001 | 0.361 | 0.020 |
表3 FGMS指标与lnUACR的相关性分析
Table 3 Pearson correlation,Spearman correlation and partial correlation of blood glucose metrics monitored by a flash glucose monitoring system with the natural logarithm-transformed UACR
| 变量 | r(rs)值 | P值 | 偏相关系数 | P值 |
|---|---|---|---|---|
| MBG | 0.516 | <0.001 | 0.299 | 0.024 |
| TAR | 0.469a | <0.001 | 0.338 | 0.010 |
| TIR | -0.508 | <0.001 | -0.373 | 0.004 |
| TBR | -0.143a | 0.210 | 0.101 | 0.455 |
| SDBG | 0.509 | <0.001 | 0.368 | 0.018 |
| CV | 0.245 | 0.057 | 0.184 | 0.251 |
| MAGE | 0.467 | <0.001 | 0.387 | 0.012 |
| LAGE | 0.425 | 0.001 | 0.318 | 0.043 |
| MODD | -0.195 | 0.132 | -0.019 | 0.904 |
| CONGA2 | 0.508 | <0.001 | 0.361 | 0.020 |
| 变量 | 模型 | β | SE | Wald χ2值 | OR(95%CI) | P值 |
|---|---|---|---|---|---|---|
| TIR | 单变量 | -2.513 | 0.584 | 18.528 | 0.081(0.026,0.254) | <0.001 |
| 模型1 | -4.328 | 1.128 | 14.717 | 0.013(0.001,0.120) | <0.001 | |
| 模型2 | -3.834 | 1.174 | 10.664 | 0.022(0.002,0.216) | 0.001 | |
| 模型3 | -3.275 | 1.282 | 6.523 | 0.038(0.003,0.467) | 0.011 | |
| MBG | 单变量 | 0.630 | 0.160 | 15.459 | 1.878(1.372,2.571) | <0.001 |
| 模型1 | 0.901 | 0.234 | 14.854 | 2.463(1.557,3.896) | <0.001 | |
| 模型2 | 0.710 | 0.236 | 9.024 | 2.033(1.280,3.230) | 0.003 | |
| 模型3 | 0.482 | 0.260 | 3.436 | 1.620(0.973,2.697) | 0.064 | |
| TAR | 单变量 | 0.051 | 0.013 | 16.438 | 1.052(1.027,1.079) | <0.001 |
| 模型1 | 0.079 | 0.019 | 17.049 | 1.082(1.042,1.123) | <0.001 | |
| 模型2 | 0.067 | 0.020 | 10.906 | 1.069(1.028,1.113) | 0.001 | |
| 模型3 | 0.045 | 0.023 | 3.927 | 1.046(1.000,1.094) | 0.048 | |
| SDBG | 单变量 | 0.979 | 0.369 | 7.051 | 2.661(1.292,5.480) | 0.008 |
| 模型1 | 1.379 | 0.491 | 7.887 | 3.973(1.517,10.403) | 0.005 | |
| 模型2 | 1.504 | 0.637 | 5.580 | 4.499(1.292,15.670) | 0.018 | |
| 模型3 | 1.553 | 1.087 | 2.041 | 4.724(0.561,39.765) | 0.153 | |
| MAGE | 单变量 | 0.458 | 0.180 | 6.488 | 1.581(1.111,2.250) | 0.011 |
| 模型1 | 0.679 | 0.241 | 7.900 | 1.971(1.228,3.164) | 0.005 | |
| 模型2 | 0.736 | 0.280 | 6.916 | 2.087(1.206,3.612) | 0.009 | |
| 模型3 | 0.580 | 0.351 | 2.727 | 1.786(0.897,3.554) | 0.099 | |
| LAGE | 单变量 | 0.219 | 0.084 | 6.773 | 1.245(1.055,1.467) | 0.009 |
| 模型1 | 0.339 | 0.122 | 7.753 | 1.404(1.106,1.783) | 0.005 | |
| 模型2 | 0.356 | 0.145 | 6.001 | 1.427(1.074,1.897) | 0.014 | |
| 模型3 | 0.320 | 0.212 | 2.270 | 1.377(0.908,2.086) | 0.132 | |
| CONGA2 | 单变量 | 0.513 | 0.168 | 9.297 | 1.670(1.201,2.323) | 0.002 |
| 模型1 | 0.782 | 0.273 | 8.227 | 2.185(1.281,3.728) | 0.004 | |
| 模型2 | 0.682 | 0.296 | 5.302 | 1.978(1.107,3.534) | 0.021 | |
| 模型3 | 0.622 | 0.399 | 2.436 | 1.864(0.853,4.072) | 0.119 |
表4 FGMS指数与T2DM患者发生白蛋白尿关系的多因素Logistic回归分析
Table 4 Multivariate Logistic regression of the associations of blood glucose metrics monitored by a flash glucose monitoring system and albuminuria
| 变量 | 模型 | β | SE | Wald χ2值 | OR(95%CI) | P值 |
|---|---|---|---|---|---|---|
| TIR | 单变量 | -2.513 | 0.584 | 18.528 | 0.081(0.026,0.254) | <0.001 |
| 模型1 | -4.328 | 1.128 | 14.717 | 0.013(0.001,0.120) | <0.001 | |
| 模型2 | -3.834 | 1.174 | 10.664 | 0.022(0.002,0.216) | 0.001 | |
| 模型3 | -3.275 | 1.282 | 6.523 | 0.038(0.003,0.467) | 0.011 | |
| MBG | 单变量 | 0.630 | 0.160 | 15.459 | 1.878(1.372,2.571) | <0.001 |
| 模型1 | 0.901 | 0.234 | 14.854 | 2.463(1.557,3.896) | <0.001 | |
| 模型2 | 0.710 | 0.236 | 9.024 | 2.033(1.280,3.230) | 0.003 | |
| 模型3 | 0.482 | 0.260 | 3.436 | 1.620(0.973,2.697) | 0.064 | |
| TAR | 单变量 | 0.051 | 0.013 | 16.438 | 1.052(1.027,1.079) | <0.001 |
| 模型1 | 0.079 | 0.019 | 17.049 | 1.082(1.042,1.123) | <0.001 | |
| 模型2 | 0.067 | 0.020 | 10.906 | 1.069(1.028,1.113) | 0.001 | |
| 模型3 | 0.045 | 0.023 | 3.927 | 1.046(1.000,1.094) | 0.048 | |
| SDBG | 单变量 | 0.979 | 0.369 | 7.051 | 2.661(1.292,5.480) | 0.008 |
| 模型1 | 1.379 | 0.491 | 7.887 | 3.973(1.517,10.403) | 0.005 | |
| 模型2 | 1.504 | 0.637 | 5.580 | 4.499(1.292,15.670) | 0.018 | |
| 模型3 | 1.553 | 1.087 | 2.041 | 4.724(0.561,39.765) | 0.153 | |
| MAGE | 单变量 | 0.458 | 0.180 | 6.488 | 1.581(1.111,2.250) | 0.011 |
| 模型1 | 0.679 | 0.241 | 7.900 | 1.971(1.228,3.164) | 0.005 | |
| 模型2 | 0.736 | 0.280 | 6.916 | 2.087(1.206,3.612) | 0.009 | |
| 模型3 | 0.580 | 0.351 | 2.727 | 1.786(0.897,3.554) | 0.099 | |
| LAGE | 单变量 | 0.219 | 0.084 | 6.773 | 1.245(1.055,1.467) | 0.009 |
| 模型1 | 0.339 | 0.122 | 7.753 | 1.404(1.106,1.783) | 0.005 | |
| 模型2 | 0.356 | 0.145 | 6.001 | 1.427(1.074,1.897) | 0.014 | |
| 模型3 | 0.320 | 0.212 | 2.270 | 1.377(0.908,2.086) | 0.132 | |
| CONGA2 | 单变量 | 0.513 | 0.168 | 9.297 | 1.670(1.201,2.323) | 0.002 |
| 模型1 | 0.782 | 0.273 | 8.227 | 2.185(1.281,3.728) | 0.004 | |
| 模型2 | 0.682 | 0.296 | 5.302 | 1.978(1.107,3.534) | 0.021 | |
| 模型3 | 0.622 | 0.399 | 2.436 | 1.864(0.853,4.072) | 0.119 |
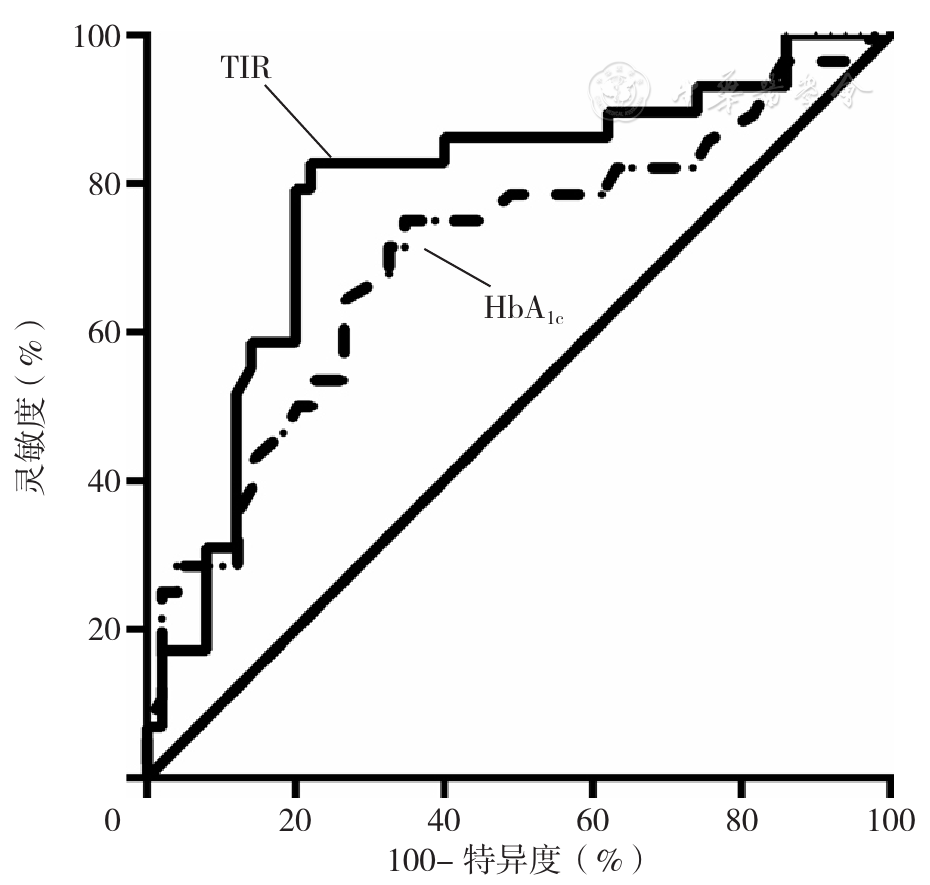
图2 HbA1c和TIR预测T2DM患者发生白蛋白尿的ROC曲线注:HbA1c=糖化血红蛋白
Figure 2 ROC curves of HbA1c and TIR for predicting albuminuria in T2DM
| [1] |
|
| [2] |
中华医学会糖尿病学分会. 中国持续葡萄糖监测临床应用指南(2017年版)[J]. 中华糖尿病杂志,2017,9(11):667-675. DOI:10.3760/cma.j.issn.1674-5809.2017.11.002.
|
| [3] |
|
| [4] |
|
| [5] |
|
| [6] |
|
| [7] |
|
| [8] |
|
| [9] |
|
| [10] |
|
| [11] |
中华医学会糖尿病学分会微血管并发症学组. 中国糖尿病肾脏疾病防治临床指南[J]. 中华糖尿病杂志,2019,11(1):15-28. DOI:10.3760/cma.j.issn.1674-5809.2019.01.004.
|
| [12] |
|
| [13] |
Professional practice committee:Standards of medical care in diabetes-2021[J]. Diabetes Care,2021,44(Suppl 1):S3. DOI:10.2337/dc21-Sppc.
|
| [14] |
|
| [15] |
|
| [16] |
The Action to Control Cardiovascular Risk in Diabetes Study Group. Effects of intensive glucose lowering in type 2 diabetes[J]. N Engl J Med,2008,358:2545-2559. DOI:10.1056/NEJMoa0802743.
|
| [17] |
中华医学会糖尿病学分会.中国血糖监测临床应用指南(2021年版)[J]. 中华糖尿病杂志,2021,13(10):936-948.DOI:10.3760/cma.j.cn115791-20210810-00436.
|
| [18] |
|
| [19] |
|
| [20] |
|
| [21] |
|
| [22] |
|
| [23] |
|
| [24] |
|
| [25] |
|
| [26] |
|
| [27] |
|
| [28] |
邓明群,周丽媛,翟笑,等. 扫描式葡萄糖监测系统中目标范围时间与糖化血红蛋白的相关性[J]. 协和医学杂志,2021,12(4):526-530. DOI:10.12290/xhyxzz.20200035.
|
| [29] |
|
| [30] |
|
| [31] |
|
| [32] |
|
| [33] |
|
| [34] |
|
| [35] | |
| [36] |
|
| [37] |
|
| [38] |
|
| [39] |
|
| [40] |
|
| [1] | 李殿江, 潘恩春, 孙中明, 文进博, 王苗苗, 武鸣, 沈冲. 社区2型糖尿病患者临床惰性现状及其影响因素分析[J]. 中国全科医学, 2023, 26(34): 4296-4301. |
| [2] | 林恺, 姚弥, 陈章, 纪欣鑫, 林润琪, 陈永松, Sim MOIRA. 2型糖尿病治疗负担的概念框架及应对方式:基于视频记录分析[J]. 中国全科医学, 2023, 26(34): 4302-4307. |
| [3] | 周小琦, 刘新会, 张微, 李长风, 严亚琼. 老年人丙氨酸氨基转移酶和天冬氨酸氨基转移酶/丙氨酸氨基转移酶与2型糖尿病及代谢综合征的相关性研究[J]. 中国全科医学, 2023, 26(29): 3645-3649. |
| [4] | 孔德先, 邢煜玲, 孙文文, 张智敏, 周霏, 马慧娟. 预估葡萄糖处理率与2型糖尿病合并代谢相关脂肪性肝病的相关性研究[J]. 中国全科医学, 2023, 26(26): 3252-3258. |
| [5] | 陈伦文, 周阳, 闫国栋, 沈怡, 孙晨, 蔡婉丽, 褚敏捷, 肖静. 2型糖尿病的恶性肿瘤风险:一项基于人群的前瞻性研究[J]. 中国全科医学, 2023, 26(26): 3238-3245. |
| [6] | 费思杰, 张强, 刘方方, 白璐, 孙彩红, 信彩凤. 糖化血红蛋白变异性与2型糖尿病合并射血分数保留心力衰竭患者新发心房颤动的关系研究[J]. 中国全科医学, 2023, 26(26): 3246-3251. |
| [7] | 卢作维, 曹宏伟, 刘涛, 张娜娜, 陈艳艳, 史勤利, 刘向阳, 王琼, 赖敬波, 李晓苗. 2型糖尿病患者微量白蛋白尿进展至大量白蛋白尿的风险预测模型研究[J]. 中国全科医学, 2023, 26(26): 3259-3268. |
| [8] | 赵丽珍, 李卫民, 姜瑞霞. 系统免疫炎症指数对社区老年2型糖尿病患者并发糖尿病肾病的临床诊断价值研究[J]. 中国全科医学, 2023, 26(18): 2227-2231. |
| [9] | 方福生, 刘星宇, 闫双通, 王宁, 李春霖, 田慧. 老年男性2型糖尿病患者目标范围内时间与长期血糖变异性的关系研究[J]. 中国全科医学, 2023, 26(16): 1979-1983. |
| [10] | 张丽娜, 王岩, 张抗怀, 李友佳. 新型降糖药物替西帕肽的临床研究进展[J]. 中国全科医学, 2023, 26(15): 1902-1908. |
| [11] | 王海燕, 黄源, 桂春. 2型糖尿病对扩张型心肌病患者预后的影响研究[J]. 中国全科医学, 2023, 26(15): 1840-1846. |
| [12] | 王凌霄, 董荣娜, 周冰, 郭丽娜, 李晶. 人机交互智能管理对初发2型糖尿病患者血糖控制的影响研究[J]. 中国全科医学, 2023, 26(15): 1817-1823. |
| [13] | 宋华隆, 高鹰. 血尿酸水平与2型糖尿病发病风险的关联队列研究[J]. 中国全科医学, 2023, 26(15): 1831-1839. |
| [14] | 舒涛, 郭正, 王飞, 陈书艳. 葡萄糖在目标范围内时间与糖尿病肾脏疾病的相关性研究[J]. 中国全科医学, 2023, 26(15): 1873-1879. |
| [15] | 孟启哲, 奚志, 王铭, 王洋, 杨霄鹏. 2型糖尿病合并近期皮质下小梗死患者血糖变异性与梗死负担及认知功能障碍的相关性研究[J]. 中国全科医学, 2023, 26(15): 1885-1891. |
| 阅读次数 | ||||||
|
全文 |
|
|||||
|
摘要 |
|
|||||


