
中国全科医学 ›› 2023, Vol. 26 ›› Issue (14): 1716-1725.DOI: 10.12114/j.issn.1007-9572.2022.0755
陈一佳1, 戚圣香1, 杜金玲1,2, 王琛琛1, 周海茸1, 叶青1, 秦真真1, 苏健3, 武鸣3, 洪忻1,2,*( )
)
收稿日期:2022-06-20
修回日期:2022-12-12
出版日期:2023-05-15
发布日期:2023-01-05
通讯作者:
洪忻
基金资助:
CHEN Yijia1, QI Shengxiang1, DU Jinling1,2, WANG Chenchen1, ZHOU Hairong1, YE Qing1, QIN Zhenzhen1, SU Jian3, WU Ming3, HONG Xin1,2,*()
Received:2022-06-20
Revised:2022-12-12
Published:2023-05-15
Online:2023-01-05
Contact:
HONG Xin
摘要: 背景 心脏代谢指数(CMI)是一种衡量血脂的简易指标,与糖尿病、脑卒中密切相关。体质量正常代谢异常(MONW)表型个体糖尿病、心脑血管疾病发病和死亡风险更高,正确识别MONW表型个体对代谢相关疾病的预防和控制至关重要。但CMI对MONW表型预测价值如何,相关研究较少。 目的 探讨CMI与MONW表型的关系,并评估CMI对MONW表型的预测价值。 方法 采用多阶段分层整群抽样方法调查南京市≥18岁的常住居民,调查时间为2017-01-01至2018-06-30。收集患者基本资料,采用多因素稳健Poisson回归模型评价CMI对MONW表型的RR值及其95%CI。绘制受试者工作特征(ROC)曲线评估相关指标对MONW表型的预测能力,采用DeLong检验比较各指标间的ROC曲线下面积(AUC),并进一步探讨不同性别、年龄分层CMI预测MONW表型的价值。 结果 共纳入30 408例研究对象,其中男13 213例,女17 195例;体质量正常代谢正常(MHNW)表型23 691例,MONW表型6 717例。MHNW表型和MONW表型研究对象年龄、受教育程度、职业、吸烟、饮酒、体力活动、静态行为时间、高红肉摄入、疾病史、用药史、身高、腰围(WC)、体质指数(BMI)、总胆固醇(TC)、三酰甘油(TG)、高密度脂蛋白胆固醇(HDL-C)、低密度脂蛋白胆固醇(LDL-C)、收缩压(SBP)、舒张压(DBP)、空腹血糖(FPG)、TG/HDL-C、腰高比(WHtR)和CMI比较,差异有统计学意义(P<0.05);男性MHNW表型研究对象和MONW表型年龄、受教育程度、职业、吸烟、饮酒、静态行为时间、高红肉摄入、疾病史、用药史、身高、WC、BMI、TC、TG、HDL-C、LDL-C、SBP、DBP、FPG、TG/HDL-C、WHtR和CMI比较,差异有统计学意义(P<0.05);女性MHNW表型研究对象和MONW表型年龄、受教育程度、职业、吸烟、饮酒、体力活动、静态行为时间、疾病史、用药史、身高、WC、BMI、TC、TG、HDL-C、LDL-C、SBP、DBP、FPG、TG/HDL-C、WHtR和CMI比较,差异有统计学意义(P<0.05)。所有研究对象Q1~Q4组例数分别为7 739、7 940、7 904、6 825例,CMI范围分别为≤0.253、0.254~0.382、0.383~0.539、≥0.540。男性研究对象Q1~Q4组例数分别为2 697、3 410、3 661、3 445例,CMI范围分别为≤0.281、0.282~0.407、0.408~0.569、≥0.570。女性研究对象Q1~Q4组例数分别为5 042、4 530、4 243、3 380例,CMI范围分别为≤0.235、0.236~0.361、0.362~0.516、≥0.517。校正各项混杂因素后,CMI四分位数分组是所有研究对象、男性研究对象和女性研究对象代谢表型的影响因素(P<0.05)。多因素稳健Poisson回归模型分析显示CMI每增加1个SD,总人群、男性和女性MONW表型发生的风险分别增加68%、55%、81%。男性研究对象中CMI对MONW表型的预测能力高于WHtR(Z=18.97,P<0.001)、TG/HDL-C(Z=12.53,P<0.001)、WC(Z=23.85,P<0.001)和BMI(Z=24.13,P<0.001);女性研究对象中CMI对MONW表型的预测能力高于WHtR(Z=27.38,P<0.001)、TG/HDL-C(Z=15.27,P<0.001)、WC(Z=30.83,P<0.001)和BMI(Z=30.84,P<0.001)。女性研究对象CMI预测MONW表型的AUC大于男性(Z=-6.10,P<0.001)。在男性研究对象中,18~34岁CMI预测MONW表型的AUC为0.835〔95%CI(0.818,0.852)〕,高于35~44岁(Z=1.55,P=0.04)、45~54岁(Z=6.92,P<0.001)、55~64岁(Z=4.95,P<0.001)、≥65岁(Z=7.92,P<0.001);在女性研究对象中,18~34岁CMI预测MONW表型的AUC为0.832〔95%CI(0.817,0.847)〕,高于35~44岁(Z=1.95,P=0.03)、45~54岁(Z=2.56,P=0.02)、55~64岁(Z=3.79,P<0.001)、≥65岁(Z=5.71,P<0.001)。 结论 CMI与MONW表型的患病风险呈正相关,且CMI具有较强的预测效能,可作为识别体质量正常人群中MONW表型的有效工具,尤其适用于18~34岁人群。
| 组别 | 例数 | 年龄(岁) | 受教育程度〔n(%)〕 | 职业〔n(%)〕 | 吸烟〔n(%)〕 | |||||
|---|---|---|---|---|---|---|---|---|---|---|
| 小学及以下 | 初中及高中 | 大学及以上 | 体力劳动者 | 非体力劳动者 | 未就业/离退休 | 学生 | ||||
| MHNW表型 | 23 691 | 37.9±14.5 | 1 215(5.13) | 8 769(37.09) | 13 707(57.78) | 5 939(25.07) | 12 023(50.75) | 3 443(14.53) | 2 286(9.65) | 3 764(15.89) |
| MONW表型 | 6 717 | 50.9±16.3 | 784(11.67) | 3 538(52.67) | 2 395(35.66) | 1 745(25.98) | 2 402(35.76) | 2 389(35.57) | 181(2.69) | 1 532(22.81) |
| 检验统计量值 | -63.19a | 1 144.99b | 1 768.72b | 174.23b | ||||||
| P值 | <0.001 | <0.001 | <0.001 | <0.001 | ||||||
| 组别 | 饮酒〔n(%)〕 | 体力活动〔M(P25,P75),MET-h/d〕 | 静态行为时间〔M(P25,P75),h〕 | 高红肉摄入〔n(%)〕 | 低水果蔬菜摄入〔n(%)〕 | 疾病史〔n(%)〕 | ||||
| 高血压 | 糖尿病 | 血脂异常 | ||||||||
| MHNW表型 | 6 027(25.44) | 2.95(1.14,6.00) | 4.50(3.00,7.00) | 10 564(44.59) | 7 476(31.56) | 2 023(8.54) | 452(1.91) | 2 997(12.65) | ||
| MONW表型 | 1 855(27.62) | 3.43(1.33,6.67) | 4.00(3.00,6.00) | 2 851(42.44) | 2 134(31.77) | 2 838(42.25) | 1 362(20.28) | 2 930(43.62) | ||
| 检验统计量值 | 12.91b | -6.74 | -7.50 | 15.36b | 0.43b | 4 428.41b | 3 147.79b | 3 198.70b | ||
| P值 | <0.001 | <0.001 | <0.001 | <0.001 | 0.806 | <0.001 | <0.001 | <0.001 | ||
| 组别 | 用药史〔n(%)〕c | 身高(cm) | WC(cm) | BMI(kg/m2) | TC(mmol/L) | TG〔M(P25,P75),mmol/L〕 | HDL-C(mmol/L) | |||
| 高血压用药 | 糖尿病用药 | |||||||||
| MHNW表型 | 913(3.85) | 171(0.72) | 166.2±7.9 | 76.8±7.3 | 21.6±1.5 | 4.43±0.98 | 1.10(0.80,1.40) | 1.54±0.50 | ||
| MONW表型 | 1 771(26.37) | 854(12.71) | 165.2±8.1 | 79.6±7.5 | 22.1±1.4 | 4.74±1.15 | 1.70(1.20,2.19) | 1.37±0.54 | ||
| 检验统计量值 | 3 295.66b | 2 310.60b | 9.63a | -27.53a | -25.96a | -21.86a | -65.33 | 24.56a | ||
| P值 | <0.001 | <0.001 | <0.001 | <0.001 | <0.001 | <0.001 | <0.001 | <0.001 | ||
| 组别 | LDL-C(mmol/L) | SBP(mm Hg) | DBP(mm Hg) | FPG(mmol/L) | TG/HDL-C〔M(P25,P75)〕 | WHtR〔M(P25,P75)〕 | CMI〔M(P25,P75)〕 | |||
| MHNW表型 | 2.49±0.78 | 112±16 | 74±12 | 4.88±0.86 | 0.75(0.51,1.00) | 0.46(0.43,0.49) | 0.35(0.23,0.47) | |||
| MONW表型 | 2.76±0.87 | 129±24 | 80±17 | 5.92±1.88 | 1.27(0.89,1.80) | 0.48(0.45,0.51) | 0.61(0.43,0.87) | |||
| 检验统计量值 | -24.80a | -45.64a | -29.92a | -64.51a | -69.63 | -33.70 | -72.82 | |||
| P值 | <0.001 | <0.001 | <0.001 | <0.001 | <0.001 | <0.001 | <0.001 | |||
表1 研究对象的基本资料比较
Table 1 Comparison of basic data of the subjects
| 组别 | 例数 | 年龄(岁) | 受教育程度〔n(%)〕 | 职业〔n(%)〕 | 吸烟〔n(%)〕 | |||||
|---|---|---|---|---|---|---|---|---|---|---|
| 小学及以下 | 初中及高中 | 大学及以上 | 体力劳动者 | 非体力劳动者 | 未就业/离退休 | 学生 | ||||
| MHNW表型 | 23 691 | 37.9±14.5 | 1 215(5.13) | 8 769(37.09) | 13 707(57.78) | 5 939(25.07) | 12 023(50.75) | 3 443(14.53) | 2 286(9.65) | 3 764(15.89) |
| MONW表型 | 6 717 | 50.9±16.3 | 784(11.67) | 3 538(52.67) | 2 395(35.66) | 1 745(25.98) | 2 402(35.76) | 2 389(35.57) | 181(2.69) | 1 532(22.81) |
| 检验统计量值 | -63.19a | 1 144.99b | 1 768.72b | 174.23b | ||||||
| P值 | <0.001 | <0.001 | <0.001 | <0.001 | ||||||
| 组别 | 饮酒〔n(%)〕 | 体力活动〔M(P25,P75),MET-h/d〕 | 静态行为时间〔M(P25,P75),h〕 | 高红肉摄入〔n(%)〕 | 低水果蔬菜摄入〔n(%)〕 | 疾病史〔n(%)〕 | ||||
| 高血压 | 糖尿病 | 血脂异常 | ||||||||
| MHNW表型 | 6 027(25.44) | 2.95(1.14,6.00) | 4.50(3.00,7.00) | 10 564(44.59) | 7 476(31.56) | 2 023(8.54) | 452(1.91) | 2 997(12.65) | ||
| MONW表型 | 1 855(27.62) | 3.43(1.33,6.67) | 4.00(3.00,6.00) | 2 851(42.44) | 2 134(31.77) | 2 838(42.25) | 1 362(20.28) | 2 930(43.62) | ||
| 检验统计量值 | 12.91b | -6.74 | -7.50 | 15.36b | 0.43b | 4 428.41b | 3 147.79b | 3 198.70b | ||
| P值 | <0.001 | <0.001 | <0.001 | <0.001 | 0.806 | <0.001 | <0.001 | <0.001 | ||
| 组别 | 用药史〔n(%)〕c | 身高(cm) | WC(cm) | BMI(kg/m2) | TC(mmol/L) | TG〔M(P25,P75),mmol/L〕 | HDL-C(mmol/L) | |||
| 高血压用药 | 糖尿病用药 | |||||||||
| MHNW表型 | 913(3.85) | 171(0.72) | 166.2±7.9 | 76.8±7.3 | 21.6±1.5 | 4.43±0.98 | 1.10(0.80,1.40) | 1.54±0.50 | ||
| MONW表型 | 1 771(26.37) | 854(12.71) | 165.2±8.1 | 79.6±7.5 | 22.1±1.4 | 4.74±1.15 | 1.70(1.20,2.19) | 1.37±0.54 | ||
| 检验统计量值 | 3 295.66b | 2 310.60b | 9.63a | -27.53a | -25.96a | -21.86a | -65.33 | 24.56a | ||
| P值 | <0.001 | <0.001 | <0.001 | <0.001 | <0.001 | <0.001 | <0.001 | <0.001 | ||
| 组别 | LDL-C(mmol/L) | SBP(mm Hg) | DBP(mm Hg) | FPG(mmol/L) | TG/HDL-C〔M(P25,P75)〕 | WHtR〔M(P25,P75)〕 | CMI〔M(P25,P75)〕 | |||
| MHNW表型 | 2.49±0.78 | 112±16 | 74±12 | 4.88±0.86 | 0.75(0.51,1.00) | 0.46(0.43,0.49) | 0.35(0.23,0.47) | |||
| MONW表型 | 2.76±0.87 | 129±24 | 80±17 | 5.92±1.88 | 1.27(0.89,1.80) | 0.48(0.45,0.51) | 0.61(0.43,0.87) | |||
| 检验统计量值 | -24.80a | -45.64a | -29.92a | -64.51a | -69.63 | -33.70 | -72.82 | |||
| P值 | <0.001 | <0.001 | <0.001 | <0.001 | <0.001 | <0.001 | <0.001 | |||
| 组别 | 例数 | 年龄(岁) | 受教育程度〔n(%)〕 | 职业〔n(%)〕 | 吸烟〔n(%)〕 | |||||
|---|---|---|---|---|---|---|---|---|---|---|
| 小学及以下 | 初中及高中 | 大学及以上 | 体力劳动者 | 非体力劳动者 | 未就业/离退休 | 学生 | ||||
| MHNW表型 | 10 129 | 37.8±15.5 | 430(4.25) | 3 823(37.74) | 5 876(58.01) | 2 707(26.73) | 4 996(49.32) | 1 124(11.10) | 1 302(12.85) | 3 619(35.73) |
| MONW表型 | 3 084 | 51.1±16.5 | 258(8.37) | 1 651(53.53) | 1 175(38.10) | 862(27.95) | 1 200(38.91) | 924(29.96) | 98(3.18) | 1 466(47.54) |
| 检验统计量值 | -41.46a | 395.04b | 807.70b | 139.21b | ||||||
| P值 | <0.001 | <0.001 | <0.001 | <0.001 | ||||||
| 组别 | 饮酒〔n(%)〕 | 体力活动〔M(P25,P75),MET-h/d〕 | 静态行为时间〔M(P25,P75),h〕 | 高红肉摄入〔n(%)〕 | 低水果蔬菜摄入〔n(%)〕 | 疾病史〔n(%)〕 | ||||
| 高血压 | 糖尿病 | 血脂异常 | ||||||||
| MHNW表型 | 4 381(43.25) | 3.05(1.14,6.00) | 5.00(3.00,7.00) | 5 105(50.40) | 5 822(57.48) | 1 059(10.46) | 206(2.03) | 1 258(12.42) | ||
| MONW表型 | 1 489(48.28) | 3.24(1.24,6.00) | 4.50(3.00,6.00) | 1 453(47.11) | 1 784(57.85) | 1 410(45.72) | 713(23.12) | 1 437(46.60) | ||
| 检验统计量值 | 24.22b | -1.64 | -5.51 | 19.41b | 2.65b | 1 934.98b | 1 624.22b | 1 700.68b | ||
| P值 | <0.001 | 0.102 | <0.001 | <0.001 | 0.266 | <0.001 | <0.001 | <0.001 | ||
| 组别 | 用药史〔n(%)〕c | 身高(cm) | WC(cm) | BMI(kg/m2) | TC(mmol/L) | TG〔M(P25,P75),mmol/L〕 | HDL-C(mmol/L) | |||
| 高血压用药 | 糖尿病用药 | |||||||||
| MHNW表型 | 492(4.86) | 90(0.89) | 172.8±5.8 | 79.9±7.1 | 21.9±1.4 | 4.36±0.94 | 1.14(0.86,1.44) | 1.48±0.47 | ||
| MONW表型 | 869(28.18) | 447(14.49) | 171.3±6.0 | 82.4±7.1 | 22.3±1.3 | 4.68±1.13 | 1.72(1.20,2.20) | 1.36±0.57 | ||
| 检验统计量值 | 1 391.56b | 1 122.44b | 12.39a | -16.73a | -15.07a | -15.63a | -42.39 | 11.30a | ||
| P值 | <0.001 | <0.001 | <0.001 | <0.001 | <0.001 | <0.001 | <0.001 | <0.001 | ||
| 组别 | LDL-C(mmol/L) | SBP(mm Hg) | DBP(mm Hg) | FPG(mmol/L) | TG/HDL-C〔M(P25,P75)〕 | WHtR〔M(P25,P75)〕 | CMI〔M(P25,P75)〕 | |||
| MHNW表型 | 2.48±0.78 | 120±16 | 76±14 | 4.91±0.99 | 0.82(0.57,1.07) | 0.46(0.44,0.49) | 0.37(0.26,0.49) | |||
| MONW表型 | 2.72±0.85 | 131±21 | 81±12 | 6.07±2.10 | 1.31(0.89,1.89) | 0.48(0.45,0.51) | 0.63(0.43,0.91) | |||
| 检验统计量值 | -15.07a | -29.64a | -17.97a | -41.87a | -21.92 | -43.00 | -45.04 | |||
| P值 | <0.001 | <0.001 | <0.001 | <0.001 | <0.001 | <0.001 | <0.001 | |||
表2 男性研究对象基本资料比较
Table 2 Basic data comparison of male subjects
| 组别 | 例数 | 年龄(岁) | 受教育程度〔n(%)〕 | 职业〔n(%)〕 | 吸烟〔n(%)〕 | |||||
|---|---|---|---|---|---|---|---|---|---|---|
| 小学及以下 | 初中及高中 | 大学及以上 | 体力劳动者 | 非体力劳动者 | 未就业/离退休 | 学生 | ||||
| MHNW表型 | 10 129 | 37.8±15.5 | 430(4.25) | 3 823(37.74) | 5 876(58.01) | 2 707(26.73) | 4 996(49.32) | 1 124(11.10) | 1 302(12.85) | 3 619(35.73) |
| MONW表型 | 3 084 | 51.1±16.5 | 258(8.37) | 1 651(53.53) | 1 175(38.10) | 862(27.95) | 1 200(38.91) | 924(29.96) | 98(3.18) | 1 466(47.54) |
| 检验统计量值 | -41.46a | 395.04b | 807.70b | 139.21b | ||||||
| P值 | <0.001 | <0.001 | <0.001 | <0.001 | ||||||
| 组别 | 饮酒〔n(%)〕 | 体力活动〔M(P25,P75),MET-h/d〕 | 静态行为时间〔M(P25,P75),h〕 | 高红肉摄入〔n(%)〕 | 低水果蔬菜摄入〔n(%)〕 | 疾病史〔n(%)〕 | ||||
| 高血压 | 糖尿病 | 血脂异常 | ||||||||
| MHNW表型 | 4 381(43.25) | 3.05(1.14,6.00) | 5.00(3.00,7.00) | 5 105(50.40) | 5 822(57.48) | 1 059(10.46) | 206(2.03) | 1 258(12.42) | ||
| MONW表型 | 1 489(48.28) | 3.24(1.24,6.00) | 4.50(3.00,6.00) | 1 453(47.11) | 1 784(57.85) | 1 410(45.72) | 713(23.12) | 1 437(46.60) | ||
| 检验统计量值 | 24.22b | -1.64 | -5.51 | 19.41b | 2.65b | 1 934.98b | 1 624.22b | 1 700.68b | ||
| P值 | <0.001 | 0.102 | <0.001 | <0.001 | 0.266 | <0.001 | <0.001 | <0.001 | ||
| 组别 | 用药史〔n(%)〕c | 身高(cm) | WC(cm) | BMI(kg/m2) | TC(mmol/L) | TG〔M(P25,P75),mmol/L〕 | HDL-C(mmol/L) | |||
| 高血压用药 | 糖尿病用药 | |||||||||
| MHNW表型 | 492(4.86) | 90(0.89) | 172.8±5.8 | 79.9±7.1 | 21.9±1.4 | 4.36±0.94 | 1.14(0.86,1.44) | 1.48±0.47 | ||
| MONW表型 | 869(28.18) | 447(14.49) | 171.3±6.0 | 82.4±7.1 | 22.3±1.3 | 4.68±1.13 | 1.72(1.20,2.20) | 1.36±0.57 | ||
| 检验统计量值 | 1 391.56b | 1 122.44b | 12.39a | -16.73a | -15.07a | -15.63a | -42.39 | 11.30a | ||
| P值 | <0.001 | <0.001 | <0.001 | <0.001 | <0.001 | <0.001 | <0.001 | <0.001 | ||
| 组别 | LDL-C(mmol/L) | SBP(mm Hg) | DBP(mm Hg) | FPG(mmol/L) | TG/HDL-C〔M(P25,P75)〕 | WHtR〔M(P25,P75)〕 | CMI〔M(P25,P75)〕 | |||
| MHNW表型 | 2.48±0.78 | 120±16 | 76±14 | 4.91±0.99 | 0.82(0.57,1.07) | 0.46(0.44,0.49) | 0.37(0.26,0.49) | |||
| MONW表型 | 2.72±0.85 | 131±21 | 81±12 | 6.07±2.10 | 1.31(0.89,1.89) | 0.48(0.45,0.51) | 0.63(0.43,0.91) | |||
| 检验统计量值 | -15.07a | -29.64a | -17.97a | -41.87a | -21.92 | -43.00 | -45.04 | |||
| P值 | <0.001 | <0.001 | <0.001 | <0.001 | <0.001 | <0.001 | <0.001 | |||
| 组别 | 例数 | 年龄(岁) | 受教育程度〔n(%)〕 | 职业〔n(%)〕 | 吸烟〔n(%)〕 | |||||
|---|---|---|---|---|---|---|---|---|---|---|
| 小学及以下 | 初中及高中 | 大学及以上 | 体力劳动者 | 非体力劳动者 | 未就业/离退休 | 学生 | ||||
| MHNW表型 | 13 562 | 38.0±13.6 | 785(5.79) | 4 946(36.47) | 7 831(57.74) | 3 232(23.83) | 7 027(51.81) | 2 319(17.10) | 984(7.26) | 145(1.07) |
| MONW表型 | 3 633 | 50.7±16.0 | 526(14.48) | 1 887(51.94) | 1 220(33.58) | 883(24.30) | 1 202(33.09) | 1 465(40.32) | 83(2.28) | 66(1.82) |
| 检验统计量值 | -47.77a | 774.19b | 1 026.76b | 13.21b | ||||||
| P值 | <0.001 | <0.001 | <0.001 | <0.001 | ||||||
| 组别 | 饮酒〔n(%)〕 | 体力活动〔M(P25,P75),MET-h/d〕 | 静态行为时间〔M(P25,P75),h〕 | 高红肉摄入〔n(%)〕 | 低水果蔬菜摄入〔n(%)〕 | 疾病史〔n(%)〕 | ||||
| 高血压 | 糖尿病 | 血脂异常 | ||||||||
| MHNW表型 | 1 646(12.14) | 2.86(1.14,6.00) | 4.50(3.00,6.50) | 5 459(40.25) | 7 265(53.57) | 964(7.11) | 246(1.81) | 1 739(12.82) | ||
| MONW表型 | 366(10.07) | 3.71(1.43,7.00) | 4.00(2.50,6.00) | 1 398(38.48) | 1 932(53.18) | 1 428(39.31) | 649(17.86) | 1 493(41.10) | ||
| 检验统计量值 | 11.80b | -7.69 | -5.48 | 4.27b | 0.41b | 2 480.53b | 1 496.02b | 1 500.66b | ||
| P值 | <0.001 | <0.001 | <0.001 | 0.118 | 0.815 | <0.001 | <0.001 | <0.001 | ||
| 组别 | 用药史〔n(%)〕c | 身高(cm) | WC(cm) | BMI(kg/m2) | TC(mmol/L) | TG〔M(P25,P75),mmol/L〕 | HDL-C(mmol/L) | |||
| 高血压用药 | 糖尿病用药 | |||||||||
| MHNW表型 | 421(3.10) | 81(0.60) | 161.3±5.0 | 74.5±6.5 | 21.3±1.5 | 4.48±1.01 | 1.07(1.20,2.14) | 1.60±0.51 | ||
| MONW表型 | 902(24.83) | 407(11.20) | 156.0±5.5 | 77.2±7.1 | 21.9±1.4 | 4.97±1.17 | 1.70(1.20,2.14) | 1.38±0.52 | ||
| 检验统计量值 | 1 904.00b | 1 168.81b | 13.99a | -22.38a | -20.77a | -15.80a | -49.69 | 22.35a | ||
| P值 | <0.001 | <0.001 | <0.001 | <0.001 | <0.001 | <0.001 | <0.001 | <0.001 | ||
| 组别 | LDL-C(mmol/L) | SBP(mm Hg) | DBP(mm Hg) | FPG(mmol/L) | TG/HDL-C〔M(P25,P75)〕 | WHtR〔M(P25,P75)〕 | CMI〔M(P25,P75)〕 | |||
| MHNW表型 | 2.49±0.79 | 116±16 | 73±10 | 4.85±1.01 | 0.70(0.48,0.95) | 0.46(0.43,0.49) | 0.32(0.22,0.44) | |||
| MONW表型 | 2.79±0.88 | 128±26 | 79±20 | 5.79±1.67 | 1.22(0.88,1.73) | 0.48(0.45,0.51) | 0.59(0.42,0.84) | |||
| 检验统计量值 | -19.90a | -34.50a | -23.73a | -49.81a | -25.55 | -54.91 | -57.35 | |||
| P值 | <0.001 | <0.001 | <0.001 | <0.001 | <0.001 | <0.001 | <0.001 | |||
表3 女性研究对象基本资料比较
Table 3 Basic data comparison of female subjects
| 组别 | 例数 | 年龄(岁) | 受教育程度〔n(%)〕 | 职业〔n(%)〕 | 吸烟〔n(%)〕 | |||||
|---|---|---|---|---|---|---|---|---|---|---|
| 小学及以下 | 初中及高中 | 大学及以上 | 体力劳动者 | 非体力劳动者 | 未就业/离退休 | 学生 | ||||
| MHNW表型 | 13 562 | 38.0±13.6 | 785(5.79) | 4 946(36.47) | 7 831(57.74) | 3 232(23.83) | 7 027(51.81) | 2 319(17.10) | 984(7.26) | 145(1.07) |
| MONW表型 | 3 633 | 50.7±16.0 | 526(14.48) | 1 887(51.94) | 1 220(33.58) | 883(24.30) | 1 202(33.09) | 1 465(40.32) | 83(2.28) | 66(1.82) |
| 检验统计量值 | -47.77a | 774.19b | 1 026.76b | 13.21b | ||||||
| P值 | <0.001 | <0.001 | <0.001 | <0.001 | ||||||
| 组别 | 饮酒〔n(%)〕 | 体力活动〔M(P25,P75),MET-h/d〕 | 静态行为时间〔M(P25,P75),h〕 | 高红肉摄入〔n(%)〕 | 低水果蔬菜摄入〔n(%)〕 | 疾病史〔n(%)〕 | ||||
| 高血压 | 糖尿病 | 血脂异常 | ||||||||
| MHNW表型 | 1 646(12.14) | 2.86(1.14,6.00) | 4.50(3.00,6.50) | 5 459(40.25) | 7 265(53.57) | 964(7.11) | 246(1.81) | 1 739(12.82) | ||
| MONW表型 | 366(10.07) | 3.71(1.43,7.00) | 4.00(2.50,6.00) | 1 398(38.48) | 1 932(53.18) | 1 428(39.31) | 649(17.86) | 1 493(41.10) | ||
| 检验统计量值 | 11.80b | -7.69 | -5.48 | 4.27b | 0.41b | 2 480.53b | 1 496.02b | 1 500.66b | ||
| P值 | <0.001 | <0.001 | <0.001 | 0.118 | 0.815 | <0.001 | <0.001 | <0.001 | ||
| 组别 | 用药史〔n(%)〕c | 身高(cm) | WC(cm) | BMI(kg/m2) | TC(mmol/L) | TG〔M(P25,P75),mmol/L〕 | HDL-C(mmol/L) | |||
| 高血压用药 | 糖尿病用药 | |||||||||
| MHNW表型 | 421(3.10) | 81(0.60) | 161.3±5.0 | 74.5±6.5 | 21.3±1.5 | 4.48±1.01 | 1.07(1.20,2.14) | 1.60±0.51 | ||
| MONW表型 | 902(24.83) | 407(11.20) | 156.0±5.5 | 77.2±7.1 | 21.9±1.4 | 4.97±1.17 | 1.70(1.20,2.14) | 1.38±0.52 | ||
| 检验统计量值 | 1 904.00b | 1 168.81b | 13.99a | -22.38a | -20.77a | -15.80a | -49.69 | 22.35a | ||
| P值 | <0.001 | <0.001 | <0.001 | <0.001 | <0.001 | <0.001 | <0.001 | <0.001 | ||
| 组别 | LDL-C(mmol/L) | SBP(mm Hg) | DBP(mm Hg) | FPG(mmol/L) | TG/HDL-C〔M(P25,P75)〕 | WHtR〔M(P25,P75)〕 | CMI〔M(P25,P75)〕 | |||
| MHNW表型 | 2.49±0.79 | 116±16 | 73±10 | 4.85±1.01 | 0.70(0.48,0.95) | 0.46(0.43,0.49) | 0.32(0.22,0.44) | |||
| MONW表型 | 2.79±0.88 | 128±26 | 79±20 | 5.79±1.67 | 1.22(0.88,1.73) | 0.48(0.45,0.51) | 0.59(0.42,0.84) | |||
| 检验统计量值 | -19.90a | -34.50a | -23.73a | -49.81a | -25.55 | -54.91 | -57.35 | |||
| P值 | <0.001 | <0.001 | <0.001 | <0.001 | <0.001 | <0.001 | <0.001 | |||
| 自变量 | b | SE | Wald χ2值 | P值 | RR(95%CI) |
|---|---|---|---|---|---|
| 模型1 | |||||
| CMI分组(以Q1组为参照) | |||||
| Q2组 | 0.43 | 0.08 | 8.60 | <0.001 | 1.54(1.39,1.70) |
| Q3组 | 0.88 | 0.12 | 20.34 | <0.001 | 2.42(2.20,2.65) |
| Q4组 | 1.86 | 0.28 | 45.11 | <0.001 | 6.44(5.92,7.00) |
| 模型2 | |||||
| CMI分组(以Q1组为参照) | |||||
| Q2组 | 0.43 | 0.08 | 8.33 | <0.001 | 1.53(1.39,1.70) |
| Q3组 | 0.88 | 0.11 | 18.60 | <0.001 | 2.40(2.19,2.64) |
| Q4组 | 1.85 | 0.27 | 42.89 | <0.001 | 6.36(5.84,6.92) |
| 模型3 | |||||
| CMI分组(以Q1组为参照) | |||||
| Q2组 | 0.39 | 0.08 | 8.33 | <0.001 | 1.48(1.35,1.63) |
| Q3组 | 0.83 | 0.11 | 18.60 | <0.001 | 2.29(2.10,2.51) |
| Q4组 | 1.63 | 0.28 | 42.89 | <0.001 | 5.09(4.68,5.53) |
表4 研究对象不同CMI分组的多因素稳健Poisson回归模型
Table 4 Multivariate Robust Poisson regression models with different CMI groups
| 自变量 | b | SE | Wald χ2值 | P值 | RR(95%CI) |
|---|---|---|---|---|---|
| 模型1 | |||||
| CMI分组(以Q1组为参照) | |||||
| Q2组 | 0.43 | 0.08 | 8.60 | <0.001 | 1.54(1.39,1.70) |
| Q3组 | 0.88 | 0.12 | 20.34 | <0.001 | 2.42(2.20,2.65) |
| Q4组 | 1.86 | 0.28 | 45.11 | <0.001 | 6.44(5.92,7.00) |
| 模型2 | |||||
| CMI分组(以Q1组为参照) | |||||
| Q2组 | 0.43 | 0.08 | 8.33 | <0.001 | 1.53(1.39,1.70) |
| Q3组 | 0.88 | 0.11 | 18.60 | <0.001 | 2.40(2.19,2.64) |
| Q4组 | 1.85 | 0.27 | 42.89 | <0.001 | 6.36(5.84,6.92) |
| 模型3 | |||||
| CMI分组(以Q1组为参照) | |||||
| Q2组 | 0.39 | 0.08 | 8.33 | <0.001 | 1.48(1.35,1.63) |
| Q3组 | 0.83 | 0.11 | 18.60 | <0.001 | 2.29(2.10,2.51) |
| Q4组 | 1.63 | 0.28 | 42.89 | <0.001 | 5.09(4.68,5.53) |
| 自变量 | b | SE | Wald χ2值 | P值 | RR(95%CI) |
|---|---|---|---|---|---|
| 模型1 | |||||
| CMI分组(以Q1组为参照) | |||||
| Q2组 | 0.22 | 0.09 | 3.04 | 0.002 | 1.24(1.08,1.43) |
| Q3组 | 0.58 | 0.12 | 8.78 | <0.001 | 1.78(1.57,2.03) |
| Q4组 | 1.62 | 0.29 | 27.55 | <0.001 | 5.03(4.48,5.64) |
| 模型2 | |||||
| CMI分组(以Q1组为参照) | |||||
| Q2组 | 0.22 | 0.09 | 3.03 | 0.002 | 1.24(1.08,1.43) |
| Q3组 | 0.57 | 0.12 | 8.68 | <0.001 | 1.77(1.56,2.02) |
| Q4组 | 1.60 | 0.29 | 27.32 | <0.001 | 4.97(4.43,5.58) |
| 模型3 | |||||
| CMI分组(以Q1组为参照) | |||||
| Q2组 | 0.17 | 0.08 | 2.70 | 0.007 | 1.19(1.05,1.36) |
| Q3组 | 0.53 | 0.10 | 8.53 | <0.001 | 1.69(1.50,1.90) |
| Q4组 | 1.32 | 0.21 | 22.64 | <0.001 | 3.76(3.28,4.10) |
表5 男性研究对象不同CMI分组的多因素稳健Poisson回归模型
Table 5 Multivariate Robust Poisson regression model of male subjects in different CMI groups
| 自变量 | b | SE | Wald χ2值 | P值 | RR(95%CI) |
|---|---|---|---|---|---|
| 模型1 | |||||
| CMI分组(以Q1组为参照) | |||||
| Q2组 | 0.22 | 0.09 | 3.04 | 0.002 | 1.24(1.08,1.43) |
| Q3组 | 0.58 | 0.12 | 8.78 | <0.001 | 1.78(1.57,2.03) |
| Q4组 | 1.62 | 0.29 | 27.55 | <0.001 | 5.03(4.48,5.64) |
| 模型2 | |||||
| CMI分组(以Q1组为参照) | |||||
| Q2组 | 0.22 | 0.09 | 3.03 | 0.002 | 1.24(1.08,1.43) |
| Q3组 | 0.57 | 0.12 | 8.68 | <0.001 | 1.77(1.56,2.02) |
| Q4组 | 1.60 | 0.29 | 27.32 | <0.001 | 4.97(4.43,5.58) |
| 模型3 | |||||
| CMI分组(以Q1组为参照) | |||||
| Q2组 | 0.17 | 0.08 | 2.70 | 0.007 | 1.19(1.05,1.36) |
| Q3组 | 0.53 | 0.10 | 8.53 | <0.001 | 1.69(1.50,1.90) |
| Q4组 | 1.32 | 0.21 | 22.64 | <0.001 | 3.76(3.28,4.10) |
| 自变量 | b | SE | Wald χ2值 | P值 | RR(95%CI) |
|---|---|---|---|---|---|
| 模型1 | |||||
| CMI分组(以Q1组为参照) | |||||
| Q2组 | 0.58 | 0.12 | 8.37 | <0.001 | 1.79(1.56,2.05) |
| Q3组 | 1.19 | 0.21 | 18.78 | <0.001 | 3.28(2.90,3.72) |
| Q4组 | 2.10 | 0.49 | 35.35 | <0.001 | 8.20(7.30,9.21) |
| 模型2 | |||||
| CMI分组(以Q1组为参照) | |||||
| Q2组 | 0.58 | 0.12 | 8.35 | <0.001 | 1.79(1.56,2.05) |
| Q3组 | 1.19 | 0.21 | 18.74 | <0.001 | 3.28(2.90,3.71) |
| Q4组 | 2.10 | 0.48 | 35.18 | <0.001 | 8.13(7.24,9.14) |
| 模型3 | |||||
| CMI分组(以Q1组为参照) | |||||
| Q2组 | 0.55 | 0.12 | 8.23 | <0.001 | 1.74(1.52,1.98) |
| Q3组 | 1.15 | 0.19 | 18.81 | <0.001 | 3.16(2.81,3.57) |
| Q4组 | 1.94 | 0.42 | 32.34 | <0.001 | 6.94(6.17,7.80) |
表6 女性研究对象不同CMI分组的多因素稳健Poisson回归模型
Table 6 Multivariate Robust Poisson regression model of female subjects in different CMI groups
| 自变量 | b | SE | Wald χ2值 | P值 | RR(95%CI) |
|---|---|---|---|---|---|
| 模型1 | |||||
| CMI分组(以Q1组为参照) | |||||
| Q2组 | 0.58 | 0.12 | 8.37 | <0.001 | 1.79(1.56,2.05) |
| Q3组 | 1.19 | 0.21 | 18.78 | <0.001 | 3.28(2.90,3.72) |
| Q4组 | 2.10 | 0.49 | 35.35 | <0.001 | 8.20(7.30,9.21) |
| 模型2 | |||||
| CMI分组(以Q1组为参照) | |||||
| Q2组 | 0.58 | 0.12 | 8.35 | <0.001 | 1.79(1.56,2.05) |
| Q3组 | 1.19 | 0.21 | 18.74 | <0.001 | 3.28(2.90,3.71) |
| Q4组 | 2.10 | 0.48 | 35.18 | <0.001 | 8.13(7.24,9.14) |
| 模型3 | |||||
| CMI分组(以Q1组为参照) | |||||
| Q2组 | 0.55 | 0.12 | 8.23 | <0.001 | 1.74(1.52,1.98) |
| Q3组 | 1.15 | 0.19 | 18.81 | <0.001 | 3.16(2.81,3.57) |
| Q4组 | 1.94 | 0.42 | 32.34 | <0.001 | 6.94(6.17,7.80) |
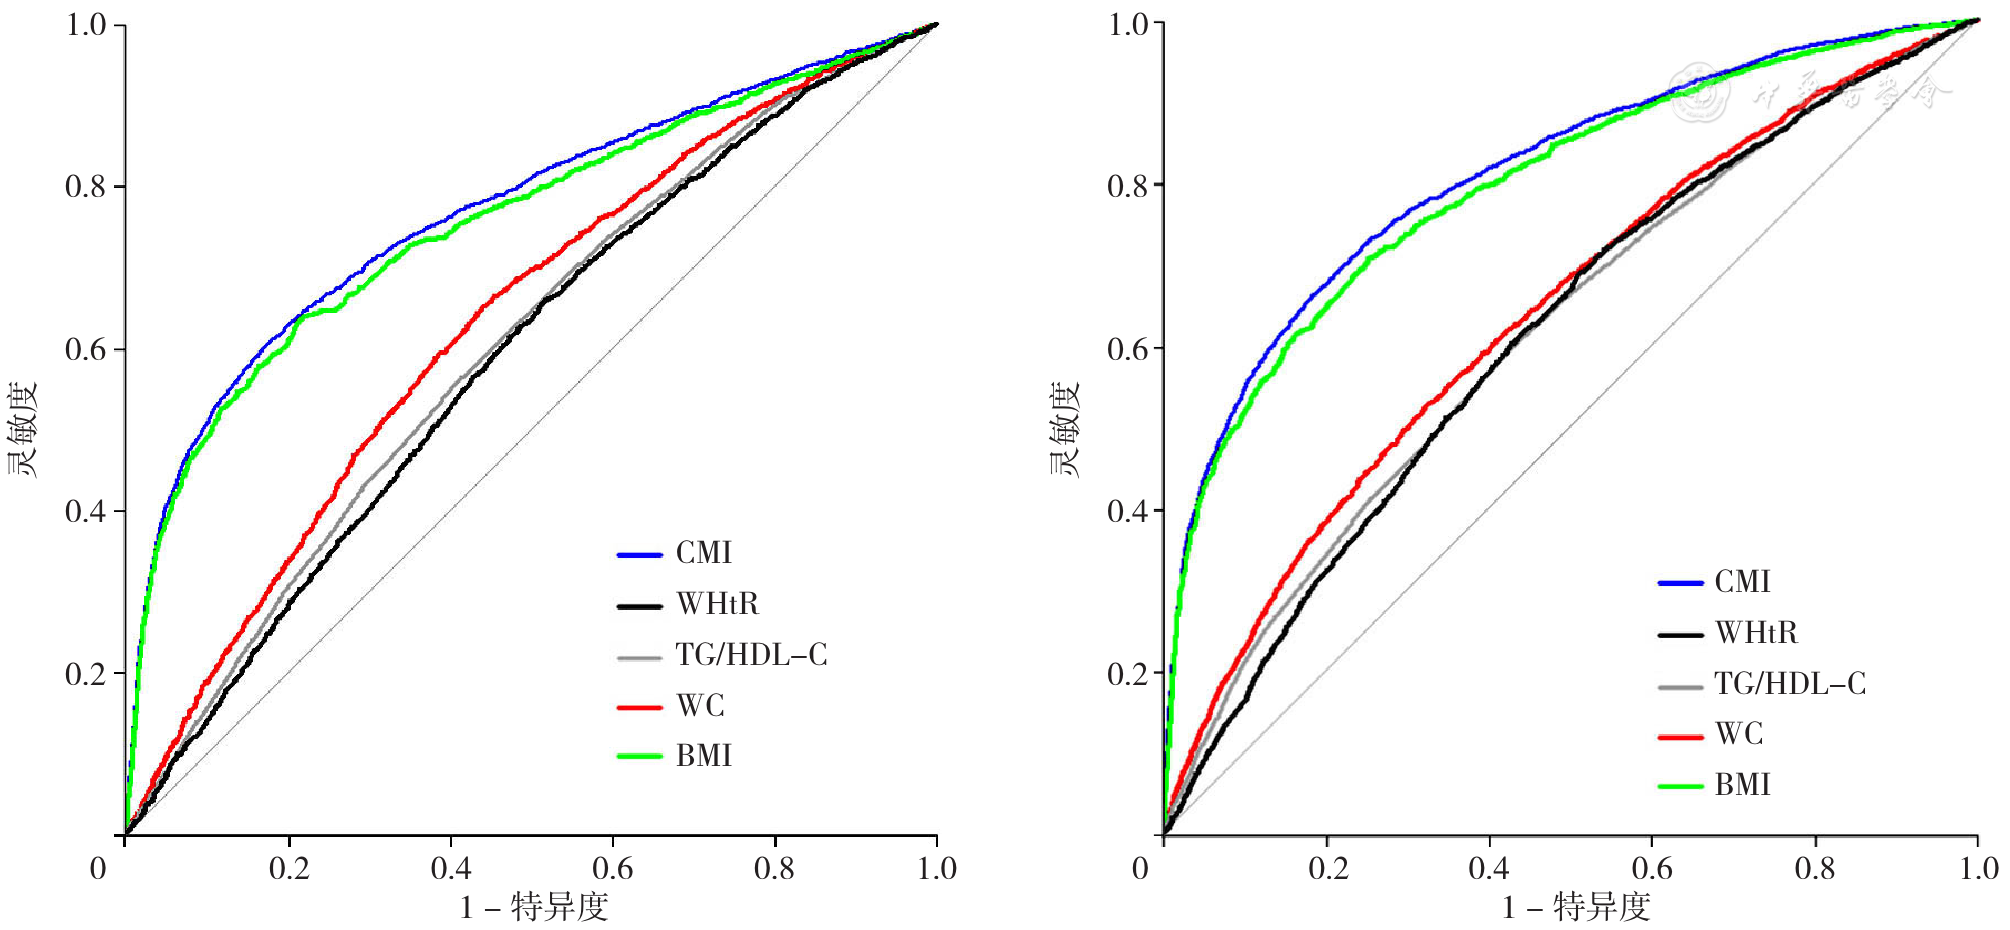
图1 CMI、WHtR、TG/HDL-C、WC和BMI预测MONW表型的ROC曲线注:CMI=心脏代谢指数,WHtR=腰高比,TG/HDL-C=三酰甘油和高密度脂蛋白胆固醇的比值,WC=腰围,BMI=体质指数;A为男性研究对象CMI、WHtR、TG/HDL-C、WC和BMI预测MONW表型的ROC曲线,B为女性研究对象CMI、WHtR、TG/HDL-C、WC和BMI预测MONW表型的ROC曲线
Figure 1 ROC curves of CMI,WHtR,TG/HDL-C ratio,WC and BMI to predict MONW phenotype
| 项目 | 最佳截断值 | AUC(95%CI) | 灵敏度(%) | 特异度(%) |
|---|---|---|---|---|
| CMI | 0.55 | 0.767(0.757,0.778) | 82.9 | 60.3 |
| WHtR | 0.47 | 0.630(0.619,0.641) | 56.1 | 65.0 |
| TG/HDL-C | 1.09 | 0.755(0.745,0.766) | 78.2 | 63.9 |
| WC | 80.75 cm | 0.601(0.590,0.612) | 58.8 | 56.3 |
| BMI | 22.02 kg/m2 | 0.588(0.577,0.599) | 45.6 | 65.6 |
表7 不同指标对男性研究对象MONW表型的预测价值比较
Table 7 Comparison of the predictive value of different indicators for MONW phenotype in male subjects
| 项目 | 最佳截断值 | AUC(95%CI) | 灵敏度(%) | 特异度(%) |
|---|---|---|---|---|
| CMI | 0.55 | 0.767(0.757,0.778) | 82.9 | 60.3 |
| WHtR | 0.47 | 0.630(0.619,0.641) | 56.1 | 65.0 |
| TG/HDL-C | 1.09 | 0.755(0.745,0.766) | 78.2 | 63.9 |
| WC | 80.75 cm | 0.601(0.590,0.612) | 58.8 | 56.3 |
| BMI | 22.02 kg/m2 | 0.588(0.577,0.599) | 45.6 | 65.6 |
| 项目 | 最佳截断值 | AUC(95%CI) | 灵敏度(%) | 特异度(%) |
|---|---|---|---|---|
| CMI | 0.49 | 0.809(0.801,0.818) | 81.6 | 66.1 |
| WHtR | 0.48 | 0.638(0.628,0.648) | 67.6 | 52.6 |
| TG/HDL-C | 0.94 | 0.796(0.787,0.805) | 74.8 | 70.6 |
| WC | 75.25 cm | 0.616(0.606,0.626) | 57.5 | 59.5 |
| BMI | 21.32 kg/m2 | 0.611(0.601,0.621) | 49.2 | 68.3 |
表8 不同指标对女性研究对象MONW表型的预测价值比较
Table 8 Comparison of the predictive value of different indicators for MONW phenotype in female subjects
| 项目 | 最佳截断值 | AUC(95%CI) | 灵敏度(%) | 特异度(%) |
|---|---|---|---|---|
| CMI | 0.49 | 0.809(0.801,0.818) | 81.6 | 66.1 |
| WHtR | 0.48 | 0.638(0.628,0.648) | 67.6 | 52.6 |
| TG/HDL-C | 0.94 | 0.796(0.787,0.805) | 74.8 | 70.6 |
| WC | 75.25 cm | 0.616(0.606,0.626) | 57.5 | 59.5 |
| BMI | 21.32 kg/m2 | 0.611(0.601,0.621) | 49.2 | 68.3 |
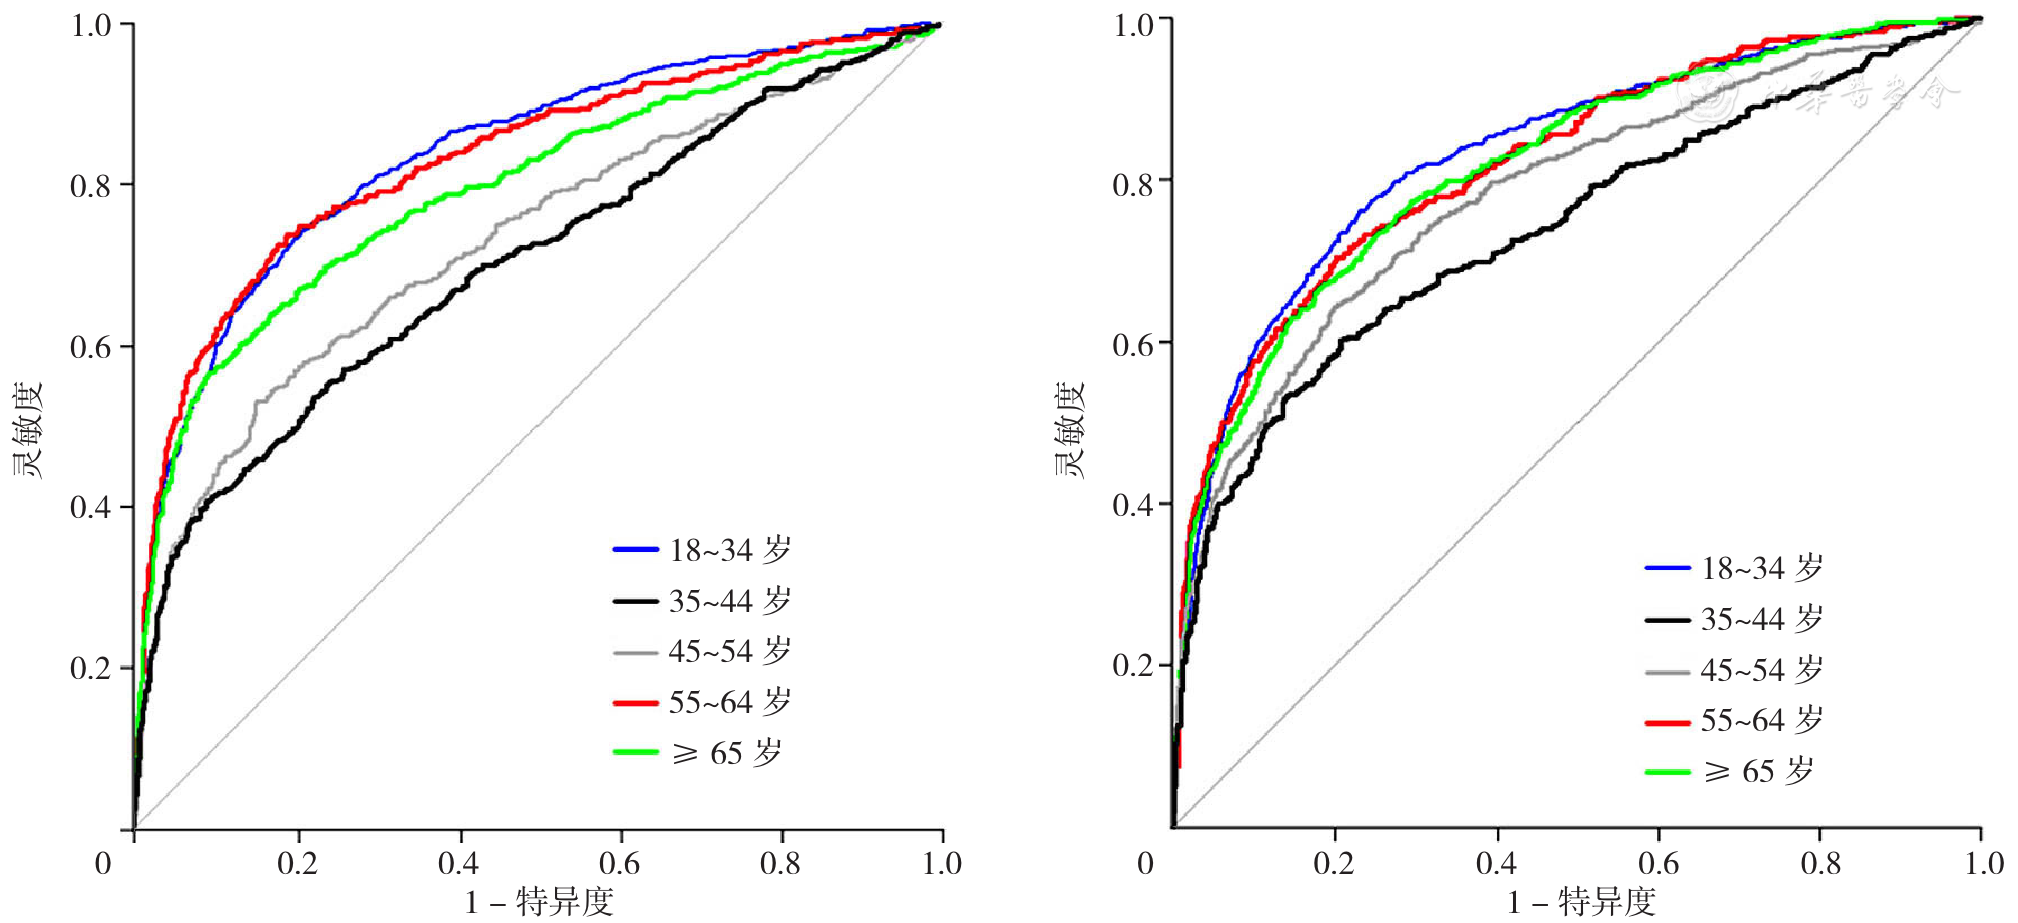
图2 按年龄分层分析CMI预测MONW表型的ROC曲线注:A为男性研究对象CMI预测MONW表型的ROC曲线,B为女性研究对象CMI预测MONW表型的ROC曲线
Figure 2 ROC curves of the CMI for the identification of MONW phenotype in male and female subjects of different ages
| [1] |
|
| [2] |
|
| [3] |
|
| [4] |
|
| [5] |
|
| [6] |
|
| [7] |
|
| [8] |
|
| [9] |
|
| [10] |
中华人民共和国卫生部疾病控制司. 中国成人超重和肥胖症预防控制指南[M]. 北京:人民卫生出版社,2006.
|
| [11] |
|
| [12] |
中国预防医学科学院. 1996年全国吸烟行为的流行病学调查:中国吸烟与健康研究[M]. 北京:中国科学技术出版社,1997:155-158.
|
| [13] |
|
| [14] |
|
| [15] |
|
| [16] |
中国高血压防治指南修订委员会,高血压联盟(中国,中华医学会心血管病学分会中国医师协会高血压专业委员会,等. 中国高血压防治指南(2018年修订版)[J]. 中国心血管杂志,2019,24(1):24-56. DOI:10.3969/j.issn.1007-5410.2019.01.002.
|
| [17] |
中华医学会糖尿病分会.中国2型糖尿病防治指南(2017年版)[J].中国实用内科杂志,2018,38(4):292-344.DOI:10.3760/cma.j.issn.1674-5809.2018.01.003.
|
| [18] |
中国成人血脂异常防治指南修订联合委员会. 中国成人血脂异常防治指南(2016年修订版)[J]. 中国循环杂志,2016,31(10):937-950. DOI:10.3969/j.issn.1000-3614.2016.10.001.
|
| [19] |
|
| [20] |
|
| [21] |
|
| [22] |
|
| [23] |
|
| [24] |
|
| [25] |
|
| [26] |
|
| [27] |
|
| [28] |
|
| [29] |
|
| [30] |
|
| [31] |
|
| [32] |
|
| [1] | 张宇诺, 李瑞斌, 王玮. 血清Nesfatin-1和Ghrelin水平与糖脂代谢及2型糖尿病的关系研究[J]. 中国全科医学, 2025, 28(26): 3264-3270. |
| [2] | 王鹏, 仇丽霞, 许姗姗, 张洋, 张晶, 杜晓菲. 代谢相关脂肪性肝病与2型糖尿病共同管理研究进展[J]. 中国全科医学, 2025, 28(23): 2846-2851. |
| [3] | 黄志杰, 麦志华, 王皓翔, 何煜明, 邓巧妍, 戴燃然, 周志衡. 老年"三高"共患情况和家庭功能的现状及影响因素研究[J]. 中国全科医学, 2025, 28(16): 2001-2010. |
| [4] | 汪蝶, 吴帮云, 谭存瑶, 谌世晖, 李游, 蒙玥, 王大珊, 胡瑾, 王子云, 汪俊华. 40~65岁人群睡眠效率与血脂异常关联性研究[J]. 中国全科医学, 2025, 28(13): 1601-1606. |
| [5] | 凡豪杰, 刘乐伟, 夏磊, 田英汉, 杨铖, 郝明茹, 赵鑫, 申晴晴, 莫大明, 耿峰, 刘寰忠. 青少年抑郁障碍患者非自杀性自伤行为与25羟维生素D3和血脂水平的相关性研究[J]. 中国全科医学, 2025, 28(05): 612-618. |
| [6] | 杨红, 刘成, 刘森, 邵琪琪, 夭元昊, 付真彦. 残余胆固醇与进展为主要不良心血管事件的非罪犯病变易损斑块的相关性研究[J]. 中国全科医学, 2025, 28(03): 299-304. |
| [7] | 张俊, 罗雯, 王绿娅, 杨娅, 陈彦. 综合医院血脂管理门诊模式建设探索与实践[J]. 中国全科医学, 2024, 27(36): 4527-4533. |
| [8] | 张龙, 李建平. 立足分级诊疗的血脂异常管控体系的建立与推广[J]. 中国全科医学, 2024, 27(36): 4493-4497. |
| [9] | 李一光, 刘荷君, 赵锦鹏, 冯焱, 徐银兰. 碳水化合物对心血管疾病风险因素影响的Meta分析[J]. 中国全科医学, 2024, 27(34): 4341-4349. |
| [10] | 郑传雷, 丁睿聪, 王琪, 郭逸星, 李剑, 黄争春, 董明华, 罗晓婷, 吴清锋. ≥35岁居民膳食模式与血脂异常相关性研究:基于赣南慢病队列调查数据[J]. 中国全科医学, 2024, 27(30): 3739-3745. |
| [11] | 北京高血压防治协会, 中国老年学和老年医学学会, 北京市社区卫生协会, 北京社区健康促进会. 成人高血压合并2型糖尿病和血脂异常基层防治中国专家共识(2024年版)[J]. 中国全科医学, 2024, 27(28): 3453-3475. |
| [12] | 谭璐, 陈涛, 高洪蛟, 陈彦希, 任艳. 卡托普利抑制试验在原发性醛固酮增多症诊断和分型以及临床转归中的应用[J]. 中国全科医学, 2024, 27(21): 2592-2599. |
| [13] | 周紫彤, 贾钰, 阎红, 许佳兰, 文君, 王思宇. 中国儿童青少年血脂异常患病率的Meta分析[J]. 中国全科医学, 2024, 27(17): 2145-2154. |
| [14] | 张芸, 蔡欣奕, 丁靖诺, 陆圣威, 陈萃英, 吴婷婷, 张军利, 赵卫峰. 寡糖链、甲胎蛋白对乙型肝炎病毒相关肝细胞癌风险筛查与诊断价值研究[J]. 中国全科医学, 2024, 27(15): 1855-1860. |
| [15] | 赵帮豪, 袁腾, 赵翎, 阿曼古丽·如则, 尼鲁帕尔·谢甫开提, 马依彤, 杨毅宁, 高晓明. 预后营养指数与急性ST段抬高型心肌梗死合并2型糖尿病患者经皮冠状动脉介入术后院内主要不良心血管事件关系的研究[J]. 中国全科医学, 2024, 27(15): 1817-1824. |
| 阅读次数 | ||||||
|
全文 |
|
|||||
|
摘要 |
|
|||||


