中国全科医学 ›› 2024, Vol. 27 ›› Issue (12): 1480-1486.DOI: 10.12114/j.issn.1007-9572.2023.0436

所属专题: 泌尿系统疾病最新文章合集

• 论著 • 上一篇    下一篇

基于肾小球滤过率的肾上腺醛固酮瘤列线图预测模型的建立与验证研究

常钰朋1, 耿茜茜1, 火睿1,*(), 孙侃1, 常向云1, 李军1, 朱凌云1, 董玉洁1, 罗丽娜2   

  1. 1.832000 新疆维吾尔自治区石河子市,石河子大学第一附属医院内分泌科
    2.832000 新疆维吾尔自治区石河子市,石河子大学医学院
  • 收稿日期:2023-06-13 修回日期:2023-10-26 出版日期:2024-04-20 发布日期:2024-01-23
  • 通讯作者: 火睿

  • 作者贡献:常钰朋、耿茜茜进行论文撰写、数据整理、统计学分析;火睿进行研究指导、论文修改、经费支持;孙侃、常向云、李军、朱凌云做出支持性贡献;董玉洁、罗丽娜采集数据;所有作者确认了论文的最终稿。
  • 基金资助:
    兵团指导性科技计划项目(2022ZD038); 石河子大学高层次人才科研启动项目(RCZX201536); 石河子大学科技计划项目(ZZZC201820A); 八师石河子市社会发展科技攻关与成果转化项目(2018YL03)

Construction and Verification the Nomogram Prediction Model for Primary Aldosteronism Based on Glomerular Filtration Rate

CHANG Yupeng1, GENG Xixi1, HUO Rui1,*(), SUN Kan1, CHANG Xiangyun1, LI Jun1, ZHU Lingyun1, DONG Yujie1, LUO Lina2   

  1. 1. Department of Endocrinology, First Affiliated Hospital, Shihezi University, Shihezi 832000, China
    2. The School of Medicine, Shihezi University, Shihezi 832000, China
  • Received:2023-06-13 Revised:2023-10-26 Published:2024-04-20 Online:2024-01-23
  • Contact: HUO Rui

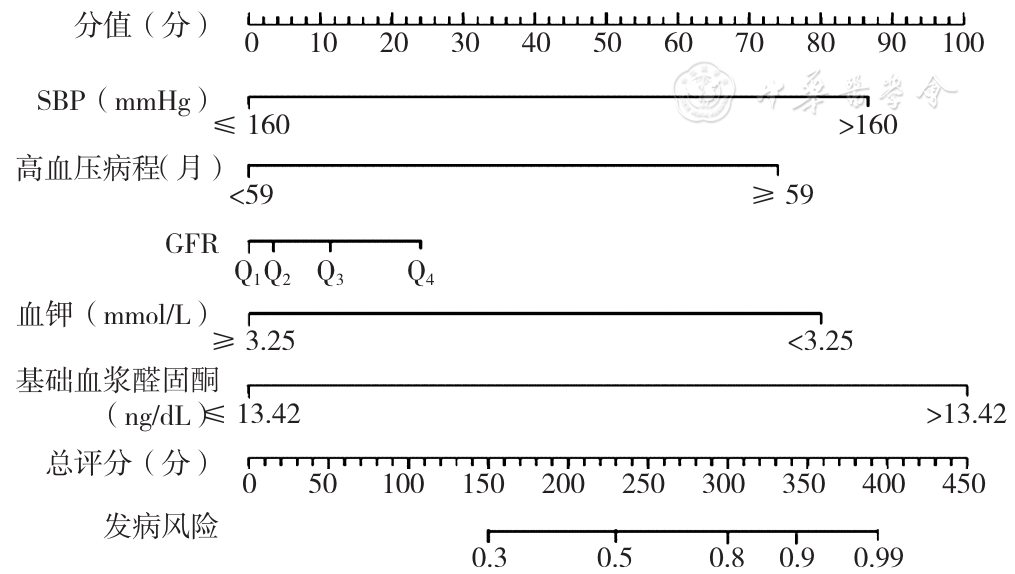
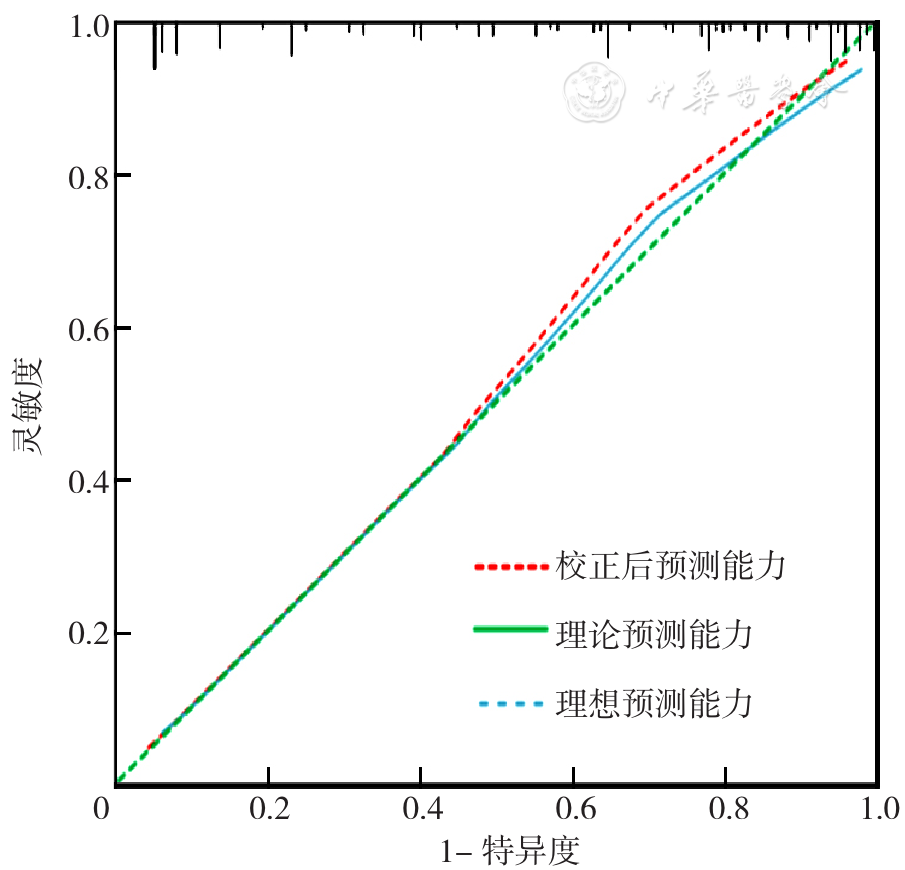
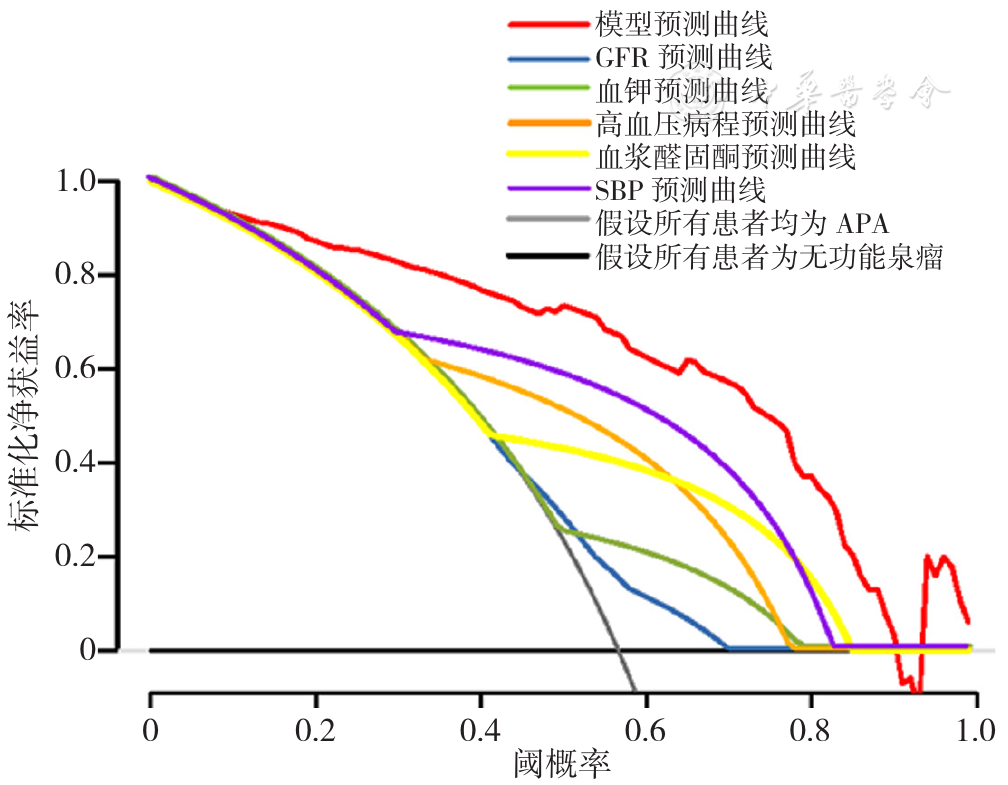
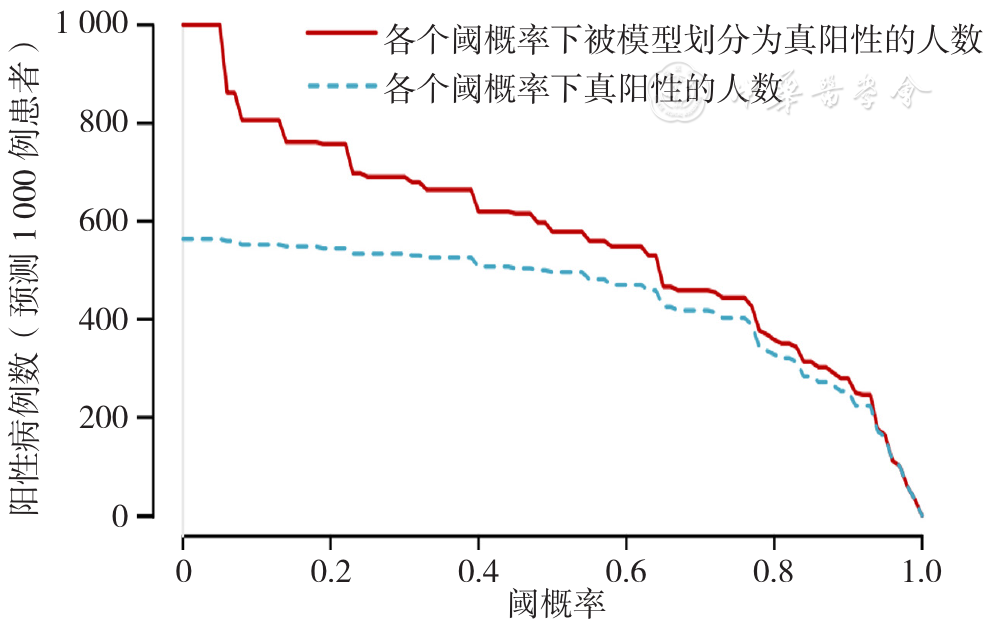
摘要: 背景 醛固酮瘤(APA)是原发性醛固酮增多症的常见类型。对于单侧肾上腺腺瘤者,虽然共识推荐血浆醛固酮与肾素比值(ARR)作为APA的筛查指标,由于缺乏统一的检测方法和诊断流程,ARR切点值范围变化大。因此临床需要一种可靠、快捷的预测模型协助鉴别APA。 目的 探讨肾小球滤过率(GFR)与APA的相关性,基于此构建APA的列线图预测模型并验证。 方法 收集2012—2022年石河子大学第一附属医院经肾上腺内分泌激素评估后行手术治疗病理回报为单侧肾上腺肿物患者493例,根据APA和肾上腺无功能腺瘤的诊断标准,最终纳入APA组155例,无功能腺瘤合并原发性高血压组113例。收集患者的病史资料、生化资料等。按照GFR四分位数水平将患者分组,分析GFR与APA的相关性。通过多因素Logistic回归分析筛选APA的危险因素并构建列线图预测模型。采用受试者工作特征(ROC)曲线分析预测模型的区分度,一致性指数(C-index)评价模型的预测精准度,Hosmer-Lemeshow检测模型的拟合度,运用决策曲线与临床获益曲线评价模型的诊断效能。 结果 按照GFR四分位数进行分组(Q1~Q4组),Q1组:≥107.4 mL·min-1·(1.73 m2)-1(n=67),Q2组:99.7~107.3 mL·min-1·(1.73 m2)-1(n=67),Q3组:88.6~99.6 mL·min-1·(1.73 m2)-1(n=67),Q4组:≤88.5 mL·min-1·(1.73 m2)-1(n=67),各组APA发生率分别为47.8%(32/67)、53.7%(36/67)、58.2%(39/67)、71.6%(48/67)。Logistic回归趋势性检验提示随着GFR水平降低,APA患病风险呈趋势性升高(P<0.05)。多因素Logistic回归分析结果显示:收缩压>160 mmHg(OR=5.209,95%CI=2.531~10.720)、高血压病程≥59个月(OR=4.326,95%CI=1.950~9.595)、血钾<3.25 mmol/L(OR=4.714,95%CI=2.046~10.860)、GFR[Q4组:≤88.5 mL·min-1·(1.73 m2)-1](OR=4.106,95%CI=1.492~11.300)、基础血浆醛固酮>13.42 ng/dL(OR=8.756,95%CI=4.320~17.749)为APA发生的独立危险因素(P<0.050)。根据多因素筛选的变量构建列线图预测模型,该模型ROC曲线下面积为0.898(95%CI=0.859~0.936),以此建立的列线图预测模型C-index为0.898,模型有较好的预测精度。Hosmer-Lemeshow检验显示该模型有较好的拟合度(χ2=14.059,P=0.080)。预测概率阈值在0.10~0.90时该模型具有显著的预测效能。 结论 随着GFR水平降低,APA患病风险呈趋势性升高。基于收缩压、高血压病程、血钾、GFR四分位分组、基础血浆醛固酮5种因素构建的APA预测模型具有较好的预测性、一致性和临床实用性,可帮助识别APA,有助于临床决策。

关键词: 原发性醛固酮增多症, 醛固酮瘤, 肾小球滤过率, 列线图, 预测模型

Abstract:

Background

Aldosterone-producing adenoma (APA) is a common type of primary aldosteronism. For those with unilateral adrenocortical adenoma, although expert consensus recommends plasma aldosterone-to-renin ratio (ARR) as a screening indicator for APA, the range of ARR cut-off values varies widely due to the lack of unified detection method and diagnostic process. Therefore, there is a clinical need for a reliable and rapid predictive model to assist in identifying APA.

Objective

To explore the correlation between glomerular filtration rate (GFR) and APA, construct and validate the nomogram prediction model of APA.

Methods

A total of 493 patients with with pathologic results of unilateral adrenal mass who underwent surgical treatment after evaluation of adrenal endocrine hormones in the first affiliated hospital of Shihezi University from 2012 to 2022 were collected, 155 patients were ultimately included in the APA group and 113 patients in nonfunctioning adrenal adenoma combined with essential hypertension group according to the diagnostic criteria of APA and nonfunctioning adrenal adenoma. The patients' clinical data and biochemical data were collected. The patients were grouped according to GFR quartiles, and the correlation between GFR and APA was analyzed. The risk factors for APA were screened by multivariate Logistic regression analysis and a nomogram prediction model was constructed. Receiver operating characteristic (ROC) curve was used to analyze the discrimination of the prediction model, a consistency index (C-index) was used to evaluate the predictive accuracy of the model, Hosmer Lemeshow test was used to verify the fit of model, and the diagnostic efficacy of the model was evaluated using decision curve and clinical benefit curve.

Results

The patients were grouped according to GFR quartiles (Q1 to Q4 groups), Q1 group: ≥107.4 mL·min-1· (1.73 m2) -1 (n=67), Q2 group: 99.7-107.3 mL·min-1· (1.73 m2) -1 (n=67), Q3 group: 88.6-99.6 mL·min-1· (1.73 m2) -1 (n=67) and Q4 group: ≤88.5 mL·min-1· (1.73 m2) -1 (n=67), and the proportion of APA in each group was 47.8% (32/67), 53.7% (36/67), 58.2% (39/67) and 71.6% (48/67). Logistic regression trend test suggested that the risk of APA tended to increase as GFR levels decreased (P<0.05). Multivariate Logistic regression analysis showed that systolic blood pressure >160 mmHg (OR=5.209, 95%CI=2.531-10.720), hypertension duration≥59 months (OR=4.326, 95%CI=1.950-9.595), blood potassium<3.25mmol/L (OR=4.714, 95%CI=2.046-10.860), GFR[Q4 gourp: ≤88.5 mL·min-1· (1.73 m2) -1] (OR=4.106, 95%CI=1.492-11.300), basal aldosterone>13.42 ng/dL (OR=8.756, 95%CI=4.320-17.749) were independent risk factors for the occurrence of APA (P<0.050). The Nomogram prediction model was constructed based on the above variables of multivariate regression with an AUC of 0.898 (95%CI=0.859-0.936) and a C-index of 0.898, indicating a good prediction accuracy. The Hosmer-Lemeshow test showed that the model had a good fit (χ2=14.059, P=0.080). The model had a significant predictive efficacy at prediction probability thresholds of 0.10 to 0.90.

Conclusion

The risk of APA prevalence tends to increase with decreasing GFR levels. The APA prediction model constructed based on five factors, including systolic blood pressure, hypertension course, blood potassium, GFR quartile grouping and basal aldosterone, has good predictability, consistency and clinical practicality, which can help identify APA and contribute to clinical decision making.

Key words: Primary hyperaldosteronism, Aldosterone-producing adenoma, Glomerular filtration rate, Nomogram, Predictive model