
Chinese General Practice ›› 2024, Vol. 27 ›› Issue (02): 245-252.DOI: 10.12114/j.issn.1007-9572.2023.0505
• Original Research • Previous Articles
Received:2023-07-26
Revised:2023-09-05
Published:2024-01-15
Online:2023-10-23
Contact:
LIN Kaicheng
通讯作者:
林凯程
作者简介:基金资助:
Add to citation manager EndNote|Ris|BibTeX
URL: https://www.chinagp.net/EN/10.12114/j.issn.1007-9572.2023.0505
| 项目 | DALYs | 发病例数 | 患病例数 | ||||||
|---|---|---|---|---|---|---|---|---|---|
| 1990年(人年) | 2019年(人年) | 变化率(%) | 1990年(例) | 2019年(例) | 变化率(%) | 1990年(例) | 2019年(例) | 变化率(%) | |
| 全人群 | 187 436 | 510 485 | 172.35 | 1 181 969 | 3 041 329 | 157.31 | 5 864 143 | 16 161 325 | 175.60 |
| 男性 | 144 697 | 385 131 | 166.16 | 907 950 | 2 283 524 | 151.50 | 4 500 178 | 12 106 943 | 169.03 |
| 女性 | 42 739 | 125 354 | 193.30 | 274 019 | 757 805 | 176.55 | 1 363 965 | 4 054 382 | 197.25 |
| 项目 | 标化DALYs | 标化发病率 | 标化患病率 | ||||||
| 1990年(1/10万) | 2019年(1/10万) | 变化率(%) | 1990年(1/10万) | 2019年(1/10万) | 变化率(%) | 1990年(1/10万) | 2019年(1/10万) | 变化率(%) | |
| 全人群 | 19.72 | 25.33 | 28.45 | 121.37 | 152.83 | 25.92 | 624.53 | 803.31 | 28.63 |
| 男性 | 30.24 | 38.99 | 29.94 | 184.62 | 234.11 | 26.81 | 954.41 | 1 230.55 | 28.93 |
| 女性 | 9.38 | 12.21 | 30.17 | 59.02 | 74.42 | 26.09 | 303.19 | 394.96 | 30.27 |
Table 1 Changes in gout burden in China from 1990 to 2019
| 项目 | DALYs | 发病例数 | 患病例数 | ||||||
|---|---|---|---|---|---|---|---|---|---|
| 1990年(人年) | 2019年(人年) | 变化率(%) | 1990年(例) | 2019年(例) | 变化率(%) | 1990年(例) | 2019年(例) | 变化率(%) | |
| 全人群 | 187 436 | 510 485 | 172.35 | 1 181 969 | 3 041 329 | 157.31 | 5 864 143 | 16 161 325 | 175.60 |
| 男性 | 144 697 | 385 131 | 166.16 | 907 950 | 2 283 524 | 151.50 | 4 500 178 | 12 106 943 | 169.03 |
| 女性 | 42 739 | 125 354 | 193.30 | 274 019 | 757 805 | 176.55 | 1 363 965 | 4 054 382 | 197.25 |
| 项目 | 标化DALYs | 标化发病率 | 标化患病率 | ||||||
| 1990年(1/10万) | 2019年(1/10万) | 变化率(%) | 1990年(1/10万) | 2019年(1/10万) | 变化率(%) | 1990年(1/10万) | 2019年(1/10万) | 变化率(%) | |
| 全人群 | 19.72 | 25.33 | 28.45 | 121.37 | 152.83 | 25.92 | 624.53 | 803.31 | 28.63 |
| 男性 | 30.24 | 38.99 | 29.94 | 184.62 | 234.11 | 26.81 | 954.41 | 1 230.55 | 28.93 |
| 女性 | 9.38 | 12.21 | 30.17 | 59.02 | 74.42 | 26.09 | 303.19 | 394.96 | 30.27 |
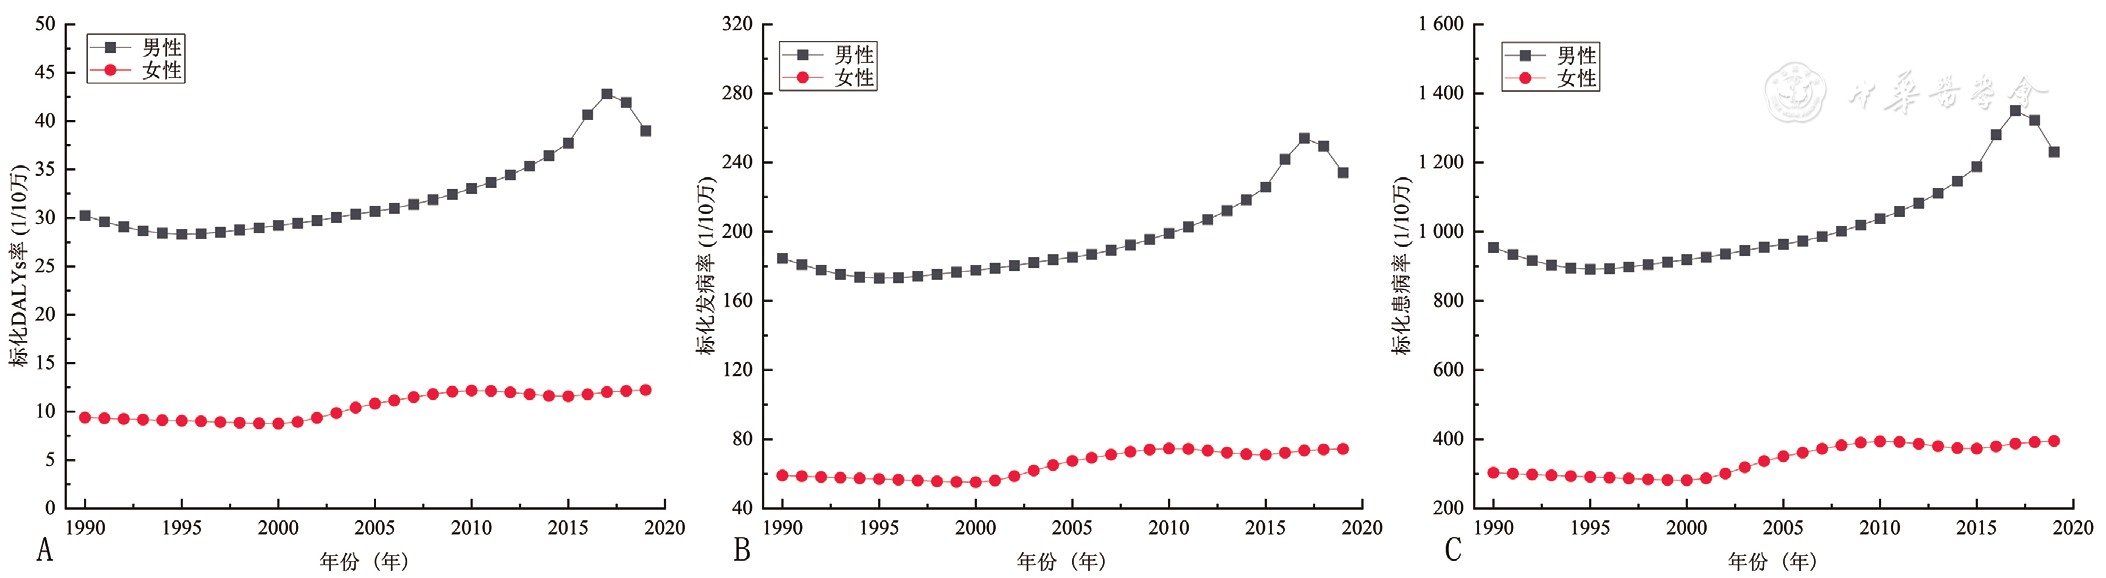
Figure 1 Trends in the burden of gout by gender in China from 1990 to 2019
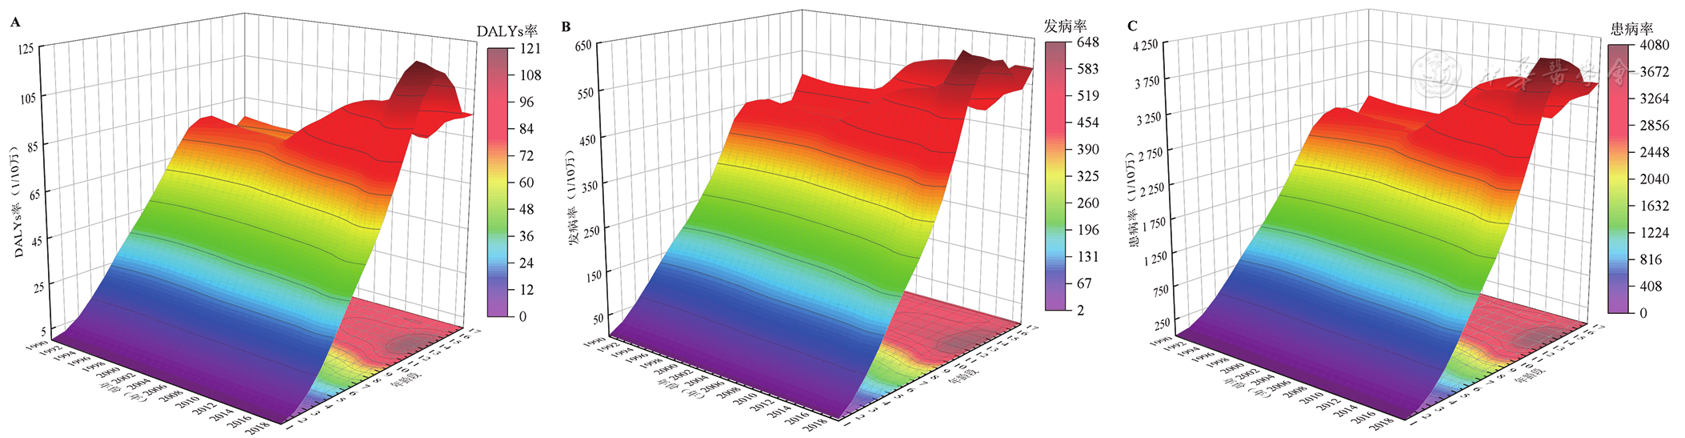
Figure 2 Trends of gout burden among different age groups in China from 1990 to 2019
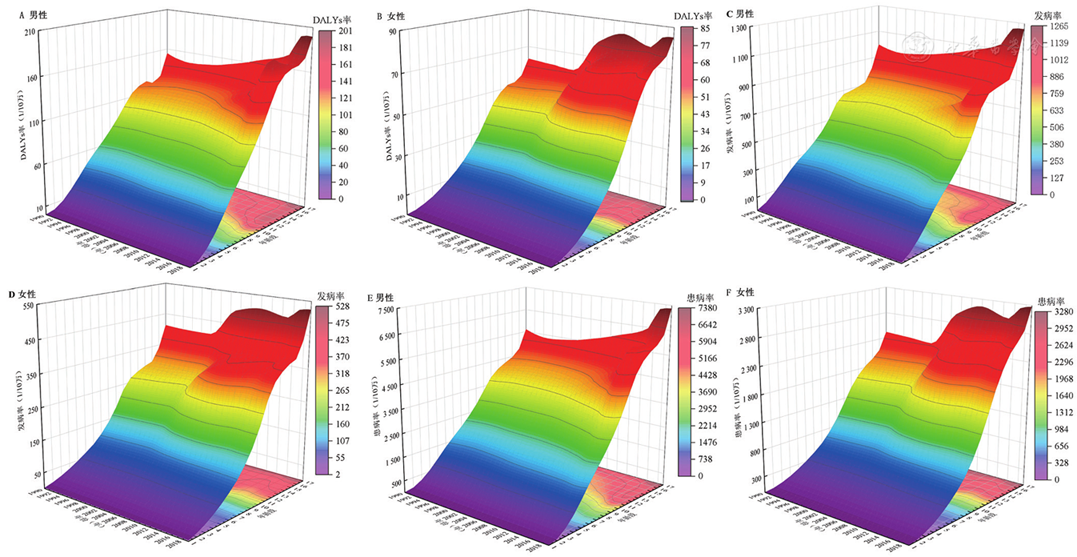
Figure 3 Trends of gout burden among different age groups by gender in China from 1990 to 2019
| 项目 | 全人群 | 男性 | 女性 | |||
|---|---|---|---|---|---|---|
| 时间(年) | 变化值(95%CI)(%) | 时间(年) | 变化值(95%CI)(%) | 时间(年) | 变化值(95%CI)(%) | |
| 标化DALYs率 | ||||||
| APC | 1990—1994 | -1.4(-1.6~1.2)a | 1990—1995 | -1.4(-1.6~1.2)a | 1990—1998 | -0.8(-0.9~-0.7)a |
| 1994—2000 | 0.2(0.1~0.4)a | 1995—2007 | 0.9(0.8~1.0)a | 1998—2001 | 0.2(-0.5~0.9) | |
| 2000—2009 | 1.8(1.8~1.9)a | 2007—2014 | 2.1(1.9~2.2)a | 2001—2005 | 5.3(4.9~5.7)a | |
| 2009—2014 | 1.3(1.1~1.5)a | 2014—2017 | 6.2(5.2~7.2)a | 2005—2010 | 2.4(2.1~2.6)a | |
| 2014—2017 | 4.7(4.0~5.4)a | 2017—2019 | -4.4(-5.3~-3.5)a | 2010—2015 | -1.2(-1.4~-1.0) | |
| 2017—2019 | -3.2(-3.8~-2.5)a | 2015—2019 | 1.6(1.3~1.8)a | |||
| AAPC | 1990—2019 | 0.9(0.8~1.0)a | 1990—2019 | 0.9(0.8~1.1)a | 1990—2019 | 0.9(0.8~1.0)a |
| 标化发病率 | ||||||
| APC | 1990—1994 | -1.3(-1.5~-1.1)a | 1990—1995 | -1.3(-1.5~-1.2)a | 1990—1998 | -0.8(-0.9~-0.7)a |
| 1994—2000 | 0.1(0~0.3) | 1995—2007 | 0.8(0.7~0.8)a | 1998—2001 | 0.2(-0.8~1.1) | |
| 2000—2010 | 1.7(1.6~1.7)a | 2007—2014 | 2.0(1.9~2.1)a | 2001—2005 | 5.1(4.6~5.6)a | |
| 2010—2014 | 1.1(0.8~1.5)a | 2014—2017 | 5.7(4.8~6.6)a | 2005—2010 | 2.1(1.8~2.4)a | |
| 2014—2017 | 4.5(3.8~5.1)a | 2017—2019 | -3.9(-4.7~-3.1) | 2010—2014 | -1.5(-1.9~-1.0)a | |
| 2017—2019 | -2.8(-3.4~-2.2)a | 2014—2019 | 1.0(0.8~1.2)a | |||
| AAPC | 1990—2019 | 0.8(0.7~0.9)a | 1990—2019 | 0.9(0.8~1.0)a | 1990—2019 | 0.8(0.7~0.9)a |
| 标化患病率 | ||||||
| APC | 1990—1994 | -1.4(-1.7~-1.2)a | 1990—1995 | -1.4(-1.6~-1.2)a | 1990—1998 | -0.9(-0.9~-0.8)a |
| 1994—2000 | 0.2(0~0.4)a | 1995—2007 | 0.9(0.8~0.9)a | 1998—2001 | 0.2(-0.5~1.0) | |
| 2000—2009 | 1.9(1.8~2.0)a | 2007—2014 | 2.1(1.9~2.2)a | 2001—2005 | 5.6(5.2~6.0)a | |
| 2009—2014 | 1.2(1.0~1.5)a | 2014—2017 | 6.3(5.3~7.2)a | 2005—2010 | 2.3(2.1~2.6)a | |
| 2014—2017 | 4.8(4.0~5.6)a | 2017—2019 | -4.4(-5.3~-3.5)a | 2010—2015 | -1.3(-1.5~-1.0)a | |
| 2017—2019 | -3.1(-3.8~-2.3)a | 2015—2019 | 1.7(1.4~1.9)a | |||
| AAPC | 1990—2019 | 0.9(0.8~1.0)a | 1990—2019 | 0.9(0.8~1.1)a | 1990—2019 | 0.9(0.8~1.0)a |
Table 2 Trends of gout burden by Joinpoint regression
| 项目 | 全人群 | 男性 | 女性 | |||
|---|---|---|---|---|---|---|
| 时间(年) | 变化值(95%CI)(%) | 时间(年) | 变化值(95%CI)(%) | 时间(年) | 变化值(95%CI)(%) | |
| 标化DALYs率 | ||||||
| APC | 1990—1994 | -1.4(-1.6~1.2)a | 1990—1995 | -1.4(-1.6~1.2)a | 1990—1998 | -0.8(-0.9~-0.7)a |
| 1994—2000 | 0.2(0.1~0.4)a | 1995—2007 | 0.9(0.8~1.0)a | 1998—2001 | 0.2(-0.5~0.9) | |
| 2000—2009 | 1.8(1.8~1.9)a | 2007—2014 | 2.1(1.9~2.2)a | 2001—2005 | 5.3(4.9~5.7)a | |
| 2009—2014 | 1.3(1.1~1.5)a | 2014—2017 | 6.2(5.2~7.2)a | 2005—2010 | 2.4(2.1~2.6)a | |
| 2014—2017 | 4.7(4.0~5.4)a | 2017—2019 | -4.4(-5.3~-3.5)a | 2010—2015 | -1.2(-1.4~-1.0) | |
| 2017—2019 | -3.2(-3.8~-2.5)a | 2015—2019 | 1.6(1.3~1.8)a | |||
| AAPC | 1990—2019 | 0.9(0.8~1.0)a | 1990—2019 | 0.9(0.8~1.1)a | 1990—2019 | 0.9(0.8~1.0)a |
| 标化发病率 | ||||||
| APC | 1990—1994 | -1.3(-1.5~-1.1)a | 1990—1995 | -1.3(-1.5~-1.2)a | 1990—1998 | -0.8(-0.9~-0.7)a |
| 1994—2000 | 0.1(0~0.3) | 1995—2007 | 0.8(0.7~0.8)a | 1998—2001 | 0.2(-0.8~1.1) | |
| 2000—2010 | 1.7(1.6~1.7)a | 2007—2014 | 2.0(1.9~2.1)a | 2001—2005 | 5.1(4.6~5.6)a | |
| 2010—2014 | 1.1(0.8~1.5)a | 2014—2017 | 5.7(4.8~6.6)a | 2005—2010 | 2.1(1.8~2.4)a | |
| 2014—2017 | 4.5(3.8~5.1)a | 2017—2019 | -3.9(-4.7~-3.1) | 2010—2014 | -1.5(-1.9~-1.0)a | |
| 2017—2019 | -2.8(-3.4~-2.2)a | 2014—2019 | 1.0(0.8~1.2)a | |||
| AAPC | 1990—2019 | 0.8(0.7~0.9)a | 1990—2019 | 0.9(0.8~1.0)a | 1990—2019 | 0.8(0.7~0.9)a |
| 标化患病率 | ||||||
| APC | 1990—1994 | -1.4(-1.7~-1.2)a | 1990—1995 | -1.4(-1.6~-1.2)a | 1990—1998 | -0.9(-0.9~-0.8)a |
| 1994—2000 | 0.2(0~0.4)a | 1995—2007 | 0.9(0.8~0.9)a | 1998—2001 | 0.2(-0.5~1.0) | |
| 2000—2009 | 1.9(1.8~2.0)a | 2007—2014 | 2.1(1.9~2.2)a | 2001—2005 | 5.6(5.2~6.0)a | |
| 2009—2014 | 1.2(1.0~1.5)a | 2014—2017 | 6.3(5.3~7.2)a | 2005—2010 | 2.3(2.1~2.6)a | |
| 2014—2017 | 4.8(4.0~5.6)a | 2017—2019 | -4.4(-5.3~-3.5)a | 2010—2015 | -1.3(-1.5~-1.0)a | |
| 2017—2019 | -3.1(-3.8~-2.3)a | 2015—2019 | 1.7(1.4~1.9)a | |||
| AAPC | 1990—2019 | 0.9(0.8~1.0)a | 1990—2019 | 0.9(0.8~1.1)a | 1990—2019 | 0.9(0.8~1.0)a |
| 指标 | 训练集 | 测试集 | ||||
|---|---|---|---|---|---|---|
| MAPE(%) | MAE | RMSE | MAPE(%) | MAE | RMSE | |
| 标化DALYs率 | 0.182 | 0.036 | 0.051 | 0.579 | 0.137 | 0.242 |
| 标化患病率 | 0.171 | 1.068 | 1.357 | 0.643 | 4.757 | 7.834 |
Table 3 Predictive model fitting for the burden of gout in China
| 指标 | 训练集 | 测试集 | ||||
|---|---|---|---|---|---|---|
| MAPE(%) | MAE | RMSE | MAPE(%) | MAE | RMSE | |
| 标化DALYs率 | 0.182 | 0.036 | 0.051 | 0.579 | 0.137 | 0.242 |
| 标化患病率 | 0.171 | 1.068 | 1.357 | 0.643 | 4.757 | 7.834 |
| 年份(年) | 标化DALYs率(95%CI) | 标化发病率(95%CI) | 标化患病率(95%CI) |
|---|---|---|---|
| 2020 | 24.52(24.01~25.03) | 149.00(146.14~151.86) | 762.79(746.30~779.28) |
| 2021 | 24.42(22.96~25.89) | 148.33(140.70~155.95) | 745.73(699.39~792.07) |
| 2022 | 24.44(21.91~26.97) | 148.33(136.08~160.57) | 749.96(673.24~826.68) |
| 2023 | 24.44(21.06~27.82) | 148.33(132.78~163.87) | 762.98(662.57~863.38) |
| 2024 | 24.44(20.39~28.50) | 148.33(130.06~166.59) | 773.58(657.08~890.09) |
| 2025 | 24.44(19.81~29.08) | 148.33(127.70~168.95) | 777.27(649.83~904.71) |
| 2026 | 24.44(19.29~29.59) | 148.33(125.59~171.06) | 775.39(639.49~911.30) |
| 2027 | 24.44(18.83~30.06) | 148.33(123.65~173.00) | 771.64(627.91~915.37) |
| 2028 | 24.44(18.40~30.49) | 148.33(121.86~174.79) | 768.91(617.19~920.63) |
| 2029 | 24.44(18.00~30.89) | 148.33(120.18~176.47) | 768.18(608.23~928.13) |
Table 4 Prediction of gout burden in China from 2020 to 2029
| 年份(年) | 标化DALYs率(95%CI) | 标化发病率(95%CI) | 标化患病率(95%CI) |
|---|---|---|---|
| 2020 | 24.52(24.01~25.03) | 149.00(146.14~151.86) | 762.79(746.30~779.28) |
| 2021 | 24.42(22.96~25.89) | 148.33(140.70~155.95) | 745.73(699.39~792.07) |
| 2022 | 24.44(21.91~26.97) | 148.33(136.08~160.57) | 749.96(673.24~826.68) |
| 2023 | 24.44(21.06~27.82) | 148.33(132.78~163.87) | 762.98(662.57~863.38) |
| 2024 | 24.44(20.39~28.50) | 148.33(130.06~166.59) | 773.58(657.08~890.09) |
| 2025 | 24.44(19.81~29.08) | 148.33(127.70~168.95) | 777.27(649.83~904.71) |
| 2026 | 24.44(19.29~29.59) | 148.33(125.59~171.06) | 775.39(639.49~911.30) |
| 2027 | 24.44(18.83~30.06) | 148.33(123.65~173.00) | 771.64(627.91~915.37) |
| 2028 | 24.44(18.40~30.49) | 148.33(121.86~174.79) | 768.91(617.19~920.63) |
| 2029 | 24.44(18.00~30.89) | 148.33(120.18~176.47) | 768.18(608.23~928.13) |
| [1] |
贺雅萌,王镁. 国内外最新痛风诊疗指南的解读和比较[J]. 风湿病与关节炎,2022,11(8):53-57,62.
|
| [2] |
|
| [3] |
|
| [4] |
|
| [5] |
GBD Diseases and Injuries Collaborators. Global burden of 369 diseases and injuries in 204 countries and territories,1990-2019:a systematic analysis for the Global Burden of Disease Study 2019[J]. Lancet,2020,396(10258):1204-1222. DOI:10.1016/S0140-6736(20)30925-9.
|
| [6] |
|
| [7] |
|
| [8] |
黄海涛,陈姝玉,耿旭,等. 2005—2016年中国女性卵巢癌发病及死亡趋势研究[J]. 中国全科医学,2022,25(8):990-994. DOI:10.12114/j.issn.1007-9572.2021.01.606.
|
| [9] |
|
| [10] |
王红心,樊文龙,杨晓雨,等. 1990—2019年中国蛋白质能量营养不良发病趋势及预测研究[J]. 中国全科医学,2023,26(5):591-597. DOI:10.12114/j.issn.1007-9572.2022.0556.
|
| [11] |
|
| [12] |
|
| [13] |
|
| [14] |
|
| [15] |
|
| [16] |
|
| [17] |
赵敏,陈婷,黄振光,等. 1990—2019年中国痛风疾病负担研究[J]. 现代预防医学,2021,48(21):3974-3978.
|
| [18] |
|
| [19] |
|
| [20] |
|
| [21] |
齐涵. 痛风年轻化趋势分析及不同药物对肾脏排泄减少型痛风疗效比较[D]. 青岛:青岛大学,2022.
|
| [22] |
|
| [23] |
李芳菲. 痛风患者饮食指南[J]. 家庭科技,2018(2):36-37.
|
| [24] |
|
| [25] |
全璟平,陈峰. 非布司他治疗痛风伴高尿酸血症的有效性及安全性评价[J]. 山西医药杂志,2021,50(5):722-724. DOI:10.3969/j.issn.0253-9926.2021.05.006.
|
| [26] |
|
| [1] | SHI Jinjie, WEI Guangcheng, ZHANG Xinwen, LUO Ye, ZHU Ke, YANG Yue, LI Xiaoxu, YANG Hongyu, MA Rui, ZHANG Jieyu, DU Jieyang, YA Yulong, PENG Jiucheng, CAO Wei. An Evidence-based Evaluation of the Efficacy of Simiao Pill in the Treatment of Gouty Arthritis Based on GRADE and an Integrated Evidence Chain [J]. Chinese General Practice, 2026, 29(21): 3046-3055. |
| [2] | WU Yixuan, XIAO Liangman, LIU Xin, YAN Ziqi, WANG Yuting, LIN Shumin, ZHUANG Lixing. Analysis of the Disease Burden of Parkinson's Disease in China and Globally from 1990 to 2021 and Prediction of Future Trends [J]. Chinese General Practice, 2026, 29(20): 2895-2902. |
| [3] | TANG Lijuan, QI Qi, ZHANG Fan, GAO Yifu, CAO Yajing, YUE Fujuan, GAO Jinchai, LIU Xiaoli. Characterisation of the Prevalence of Overweight/Obesity among Residents Aged 18-44 Years in Hebei Province in 2013 and 2020 [J]. Chinese General Practice, 2026, 29(19): 2695-2704. |
| [4] | YU Shan, CHE Yajie, SUBIYINUER· Maimaiti, GUO Kaiyang, FENG Xingxing, YAN Ping. A Comparative Study on the Current Situation and Influencing Factors of Subjective Cognitive Decline among Urban and Rural Elderly People in Xinjiang [J]. Chinese General Practice, 2026, 29(16): 2227-2233. |
| [5] | ZHEN Rui, GU Xufang, GAO Shengwei, ZHANG Bowen, REN Zhenjuan, YANG Ruixuan. Burden of Cardiovascular Diseases Attributable to Metabolic Risk Factors in China 1990—2021 and Projected Trends from 2022 to 2035 [J]. Chinese General Practice, 2026, 29(15): 2077-2083. |
| [6] | LEI Yingying, ZHENG Siying, WANG Wenxin, JIANG Hong. Prevalence Trend and Prediction of Hypertensive Heart Disease in the World and China from 1990 to 2021 [J]. Chinese General Practice, 2026, 29(05): 641-648. |
| [7] | ZHAO Xuejiao, LI Juan, LI Yujie, LU Ting, Xian Lihong, YAN Huan. Prevalence Trends and Influencing Factors for Post-stroke Cognitive Impairment in China: a Meta-analysis [J]. Chinese General Practice, 2026, 29(03): 380-392. |
| [8] | CHEN Xueqin, WANG Shihong, LAI Fengxia, ZHANG Jingjing, CHEN Hao, KONG Danli, DING Yuanlin. Study on Trend Analysis and Forecast of Incidence, Disease and Mortality of Chronic Obstructive Pulmonary Disease in China, 1990-2021 [J]. Chinese General Practice, 2026, 29(02): 264-272. |
| [9] | YANG Qinghui, HU Yingxue, NI Pingwei, LIU Xiao. Analysis of the Incidence and Mortality Trends of Lung Cancer in China from 1990 to 2021 and Prediction for 2035 [J]. Chinese General Practice, 2026, 29(02): 256-263. |
| [10] | YIN Jiajia, YAO Li, ZHOU Zihan, LI Qinqin, WANG Tingrui, LIU Yan. Meta-analysis of Factors Influencing the Prevalence of Multimorbidity among the Elderly in Different Regions of China: a Comparative Study between the North and the South [J]. Chinese General Practice, 2025, 28(34): 4326-4336. |
| [11] | SHANG Luxiang, ZHU Mingqi, ZHOU Xianhui, GAO Mei, TANG Baopeng, HOU Yinglong. Prevalence and Risk Factors of Atrial Fibrillation among Adults in China: a Meta-analysis [J]. Chinese General Practice, 2025, 28(33): 4192-4198. |
| [12] | ZHANG Yongqing, LI Na, GAO Yili, QIN Jiawen, YU Haiping, SHI Hui. Analysis on the Trend of Disease Burden of Hearing Loss in Middle-aged and Elderly People in China from 1990 to 2021 [J]. Chinese General Practice, 2025, 28(33): 4227-4233. |
| [13] | XIANG Fengling, WANG Yuankun, WANG Xiaoyan, HE Shengjie, GAN Jinhua. The Prevalence of Hyperuricemia among Children and Adolescents in China: a Meta-analysis [J]. Chinese General Practice, 2025, 28(33): 4206-4213. |
| [14] | LIU Mingbo, HE Xinye, YANG Xiaohong, WANG Zengwu. Interpretation of Report on Cardiovascular Health and Diseases in China 2024 [J]. Chinese General Practice, 2025, 28(32): 3989-4008. |
| [15] | XU Jialan, YAN Hong, WEN Jun, ZHOU Zitong, WANG Siyu. Prevalence of Potentially Inappropriate Medication in Older Adults with Cancer: a Meta-analysis [J]. Chinese General Practice, 2025, 28(30): 3815-3822. |
| Viewed | ||||||
|
Full text |
|
|||||
|
Abstract |
|
|||||
