
Chinese General Practice ›› 2024, Vol. 27 ›› Issue (11): 1380-1386.DOI: 10.12114/j.issn.1007-9572.2023.0627
Special Issue: 内分泌代谢性疾病最新文章合辑; 心血管最新文章合辑
• Original Research • Previous Articles Next Articles
Received:2023-09-30
Revised:2023-11-10
Published:2024-04-15
Online:2024-01-23
Contact:
ZHAO Yang, OUYANG Jiang, LIN Xiuquan
通讯作者:
赵洋, 欧阳江, 林修全
作者简介:基金资助:
Add to citation manager EndNote|Ris|BibTeX
URL: https://www.chinagp.net/EN/10.12114/j.issn.1007-9572.2023.0627
| 25岁及以上人群分类 | 死亡人数(万) | 粗死亡率 | 标化死亡率 | |||||
|---|---|---|---|---|---|---|---|---|
| 1990年 | 2019年 | 1990年(1/10万) | 2019年(1/10万) | EAPC(95%CI)(%) | 1990年(1/10万) | 2019年(1/10万) | EAPC(95%CI)(%) | |
| 总体 | 29.805(20.830~41.454) | 70.034(48.107~102.695) | 49.55(34.63~68.92) | 67.30(46.23~98.69) | 0.36(0.06~0.75) | 46.92(32.56~68.51) | 41.26(27.54~62.46) | -0.12(-0.32~0.10) |
| 男性 | 14.771(10.286~20.850) | 40.537(27.305~59.841) | 47.82(33.30~67.50) | 77.88(52.46~114.97) | 0.63(0.18~1.21) | 53.33(36.36~77.28) | 55.85(36.10~86.57) | 0.05(-0.23~0.37) |
| 女性 | 15.034(10.145~21.346) | 29.497(18.825~45.089) | 51.38(34.67~72.95) | 56.72(36.20~86.70) | 0.10(-0.22~0.53) | 43.00(28.58~62.16) | 31.24(19.73~48.62) | -0.27(-0.48~-0.01) |
| 25~49岁 | 1.415(0.789~2.288) | 2.149(1.258~3.335) | 3.46(1.93~5.59) | 3.81(2.23~5.92) | 0.10(-0.17~0.49) | |||
| 50~69岁 | 10.683(7.421~15.091) | 16.325(11.153~22.693) | 69.35(48.17~97.96) | 44.25(30.23~61.52) | -0.36(-0.51~-0.16) | |||
| ≥70岁 | 17.707(11.766~26.487) | 51.560(33.285~79.768) | 462.84(307.53~692.32) | 477.57(308.29~738.83) | 0.03(-0.23~0.33) | |||
Table 1 The number of deaths from cardiovascular diseases attributable to diabetes in people aged 25 years and above in China and their changes in mortality in 1990 and 2019
| 25岁及以上人群分类 | 死亡人数(万) | 粗死亡率 | 标化死亡率 | |||||
|---|---|---|---|---|---|---|---|---|
| 1990年 | 2019年 | 1990年(1/10万) | 2019年(1/10万) | EAPC(95%CI)(%) | 1990年(1/10万) | 2019年(1/10万) | EAPC(95%CI)(%) | |
| 总体 | 29.805(20.830~41.454) | 70.034(48.107~102.695) | 49.55(34.63~68.92) | 67.30(46.23~98.69) | 0.36(0.06~0.75) | 46.92(32.56~68.51) | 41.26(27.54~62.46) | -0.12(-0.32~0.10) |
| 男性 | 14.771(10.286~20.850) | 40.537(27.305~59.841) | 47.82(33.30~67.50) | 77.88(52.46~114.97) | 0.63(0.18~1.21) | 53.33(36.36~77.28) | 55.85(36.10~86.57) | 0.05(-0.23~0.37) |
| 女性 | 15.034(10.145~21.346) | 29.497(18.825~45.089) | 51.38(34.67~72.95) | 56.72(36.20~86.70) | 0.10(-0.22~0.53) | 43.00(28.58~62.16) | 31.24(19.73~48.62) | -0.27(-0.48~-0.01) |
| 25~49岁 | 1.415(0.789~2.288) | 2.149(1.258~3.335) | 3.46(1.93~5.59) | 3.81(2.23~5.92) | 0.10(-0.17~0.49) | |||
| 50~69岁 | 10.683(7.421~15.091) | 16.325(11.153~22.693) | 69.35(48.17~97.96) | 44.25(30.23~61.52) | -0.36(-0.51~-0.16) | |||
| ≥70岁 | 17.707(11.766~26.487) | 51.560(33.285~79.768) | 462.84(307.53~692.32) | 477.57(308.29~738.83) | 0.03(-0.23~0.33) | |||
| 25岁及以上人群分类 | DALY(万人年) | 粗DALY率 | 标化DALY率 | |||||
|---|---|---|---|---|---|---|---|---|
| 1990年 | 2019年 | 1990年(1/10万) | 2019年(1/10万) | EAPC(95%CI)(%) | 1990年(1/10万) | 2019年(1/10万) | EAPC(95%CI)(%) | |
| 总体 | 665.747(475.204~912.111) | 1 358.585(967.971~1 886.722) | 1 106.83(790.05~1 516.42) | 1 305.62(930.23~1 813.16) | 0.18(-0.06~0.48) | 855.75(611.48~1 172.90) | 714.60(501.88~1 021.96) | -0.16(-0.33~0.03) |
| 男性 | 346.125(243.267~481.851) | 819.054(563.153~1 184.300) | 1 120.56(787.57~1 559.97) | 1 573.59(1 081.95~2 275.31) | 0.40(0.06~0.87) | 944.12(664.68~1 315.48) | 932.96(644.51~1 340.08) | -0.01(-0.26~0.29) |
| 女性 | 319.622(223.298~453.038) | 539.531(366.478~776.862) | 1 092.33(763.14~1 548.29) | 1 037.42(704.67~1 493.77) | -0.05(-0.30~0.26) | 786.68(544.89~1 110.93) | 534.32(361.79~787.62) | -0.32(-0.49~-0.11) |
| 25~49岁 | 73.375(41.529~118.277) | 112.363(65.805~172.740) | 179.32(101.49~289.06) | 199.32(116.73~306.43) | 0.11(-0.15~0.47) | |||
| 50~69岁 | 318.149(221.939~448.608) | 510.605(355.157~702.862) | 2 065.20(1 440.67~2 912.05) | 1 384.19(962.79~1 905.38) | -0.33(-0.47~-0.14) | |||
| ≥70岁 | 274.223(182.954~404.091) | 735.617(485.415~1 123.563) | 7 167.67(4 782.07~10 562.18) | 6 813.49(4 496.04~10 406.75) | -0.05(-0.28~0.22) | |||
Table 2 The changes in DALY and DALY rate of cardiovascular diseases attributable to diabetes among the Chinese population aged 25 years and above in 1990 and 2019
| 25岁及以上人群分类 | DALY(万人年) | 粗DALY率 | 标化DALY率 | |||||
|---|---|---|---|---|---|---|---|---|
| 1990年 | 2019年 | 1990年(1/10万) | 2019年(1/10万) | EAPC(95%CI)(%) | 1990年(1/10万) | 2019年(1/10万) | EAPC(95%CI)(%) | |
| 总体 | 665.747(475.204~912.111) | 1 358.585(967.971~1 886.722) | 1 106.83(790.05~1 516.42) | 1 305.62(930.23~1 813.16) | 0.18(-0.06~0.48) | 855.75(611.48~1 172.90) | 714.60(501.88~1 021.96) | -0.16(-0.33~0.03) |
| 男性 | 346.125(243.267~481.851) | 819.054(563.153~1 184.300) | 1 120.56(787.57~1 559.97) | 1 573.59(1 081.95~2 275.31) | 0.40(0.06~0.87) | 944.12(664.68~1 315.48) | 932.96(644.51~1 340.08) | -0.01(-0.26~0.29) |
| 女性 | 319.622(223.298~453.038) | 539.531(366.478~776.862) | 1 092.33(763.14~1 548.29) | 1 037.42(704.67~1 493.77) | -0.05(-0.30~0.26) | 786.68(544.89~1 110.93) | 534.32(361.79~787.62) | -0.32(-0.49~-0.11) |
| 25~49岁 | 73.375(41.529~118.277) | 112.363(65.805~172.740) | 179.32(101.49~289.06) | 199.32(116.73~306.43) | 0.11(-0.15~0.47) | |||
| 50~69岁 | 318.149(221.939~448.608) | 510.605(355.157~702.862) | 2 065.20(1 440.67~2 912.05) | 1 384.19(962.79~1 905.38) | -0.33(-0.47~-0.14) | |||
| ≥70岁 | 274.223(182.954~404.091) | 735.617(485.415~1 123.563) | 7 167.67(4 782.07~10 562.18) | 6 813.49(4 496.04~10 406.75) | -0.05(-0.28~0.22) | |||
| 25岁及以上人群分类 | 粗死亡率 | 标化死亡率 | ||||
|---|---|---|---|---|---|---|
| 1990年(1/10万) | 2019年(1/10万) | EAPC(95%CI)(%) | 1990年(1/10万) | 2019年(1/10万) | EAPC(95%CI)(%) | |
| 缺血性心脏病 | ||||||
| 总体 | 15.83(9.71~24.88) | 32.84(18.62~53.62) | 1.07(0.59~1.68) | 16.36(9.05~26.27) | 21.10(11.47~35.35) | 0.29(0.04~0.59) |
| 男性 | 15.52(9.49~24.15) | 36.64(20.53~58.73) | 1.36(0.71~2.29) | 19.11(10.33~31.30) | 28.26(14.65~48.10) | 0.48(0.14~0.91) |
| 女性 | 16.15(9.41~27.13) | 29.03(15.65~47.81) | 0.80(0.26~1.46) | 14.68(8.08~24.44) | 16.43(8.77~27.28) | 0.12(-0.18~0.47) |
| 25~49岁 | 1.44(0.69~2.45) | 2.00(0.99~3.21) | 0.38(0.04~0.91) | |||
| 50~69岁 | 20.43(11.31~33.13) | 18.83(10.69~29.40) | -0.08(-0.29~0.19) | |||
| ≥70岁 | 151.10(80.64~255.72) | 241.68(119.81~413.46) | 0.60(0.23~1.02) | |||
| 外周动脉疾病 | ||||||
| 总体 | 0.02(0.02~0.03) | 0.05(0.04~0.06) | 1.23(0.56~1.86) | 0.02(0.02~0.03) | 0.03(0.02~0.04) | 0.31(-0.08~0.66) |
| 男性 | 0.02(0.01~0.03) | 0.06(0.04~0.07) | 1.86(1.02~2.97) | 0.03(0.02~0.04) | 0.04(0.03~0.05) | 0.63(0.13~1.18) |
| 女性 | 0.02(0.01~0.03) | 0.03(0.02~0.05) | 0.63(-0.09~1.34) | 0.02(0.01~0.03) | 0.02(0.01~0.03) | -0.01(-0.44~0.39) |
| 25~49岁 | 0.00(0.00~0.00) | 0.00(0.00~0.00) | 0.89(0.24~1.75) | |||
| 50~69岁 | 0.03(0.02~0.04) | 0.03(0.02~0.04) | 0.18(-0.21~0.63) | |||
| ≥70岁 | 0.21(0.16~0.29) | 0.33(0.25~0.43) | 0.56(0.11~0.95) | |||
| 脑卒中 | ||||||
| 总体 | 33.71(22.23~49.60) | 34.42(21.89~53.95) | 0.02(-0.21~0.35) | 30.55(19.47~47.17) | 20.13(12.41~32.53) | -0.34(-0.49~-0.14) |
| 男性 | 32.28(21.34~48.23) | 41.18(25.41~65.81) | 0.28(-0.08~0.76) | 34.20(21.61~53.84) | 27.55(16.43~46.13) | -0.19(-0.41~0.08) |
| 女性 | 35.21(22.33~53.45) | 27.66(16.97~44.39) | -0.21(-0.45~0.10) | 28.30(17.52~44.84) | 14.78(8.95~24.28) | -0.48(-0.62~-0.27) |
| 25~49岁 | 2.01(0.90~3.58) | 1.81(0.86~3.10) | -0.10(-0.34~0.22) | |||
| 50~69岁 | 48.89(31.54~71.49) | 25.39(16.77~36.42) | -0.48(-0.60~-0.31) | |||
| ≥70岁 | 311.53(187.44~498.95) | 235.56(132.56~401.53) | -0.24(-0.43~0.02) | |||
| 25岁及以上人群分类 | DALY粗率 | 标化DALY率 | ||||
| 1990年(1/10万) | 2019年(1/10万) | EAPC(95%CI)(%) | 1990年(1/10万) | 2019年(1/10万) | EAPC(95%CI)(%) | |
| 缺血性心脏病 | ||||||
| 总体 | 344.52(212.33~535.71) | 578.04(362.74~894.38) | 0.68(0.32~1.14) | 276.80(171.38~427.71) | 326.68(200.79~507.53) | 0.18(-0.04~0.47) |
| 男性 | 366.93(224.66~550.69) | 701.37(436.70~1 090.43) | 0.91(0.43~1.64) | 320.34(191.66~491.75) | 434.88(259.71~687.70) | 0.36(0.04~0.77) |
| 女性 | 320.86(202.31~508.10) | 454.61(265.33~708.17) | 0.42(0.03~0.91) | 241.56(149.15~387.53) | 239.41(140.30~375.31) | -0.01(-0.27~0.31) |
| 25~49岁 | 72.41(34.08~123.38) | 98.76(47.86~160.45) | 0.36(0.03~0.86) | |||
| 50~69岁 | 604.63(335.08~952.88) | 563.39(316.77~855.80) | -0.07(-0.27~0.19) | |||
| ≥70岁 | 2 207.41(1 201.70~3 841.31) | 3 130.60(1 644.95~5 313.02) | 0.42(0.10~0.81) | |||
| 外周动脉疾病 | ||||||
| 总体 | 2.43(1.32~4.09) | 3.62(2.05~6.03) | 0.49(0.36~0.66) | 2.00(1.09~3.41) | 1.95(1.11~3.20) | -0.03(-0.11~0.07) |
| 男性 | 1.32(0.79~2.08) | 2.37(1.56~3.52) | 0.79(0.54~1.19) | 1.19(0.72~1.91) | 1.37(0.92~2.03) | 0.15(-0.01~0.41) |
| 女性 | 3.59(1.85~6.24) | 4.88(2.49~8.45) | 0.36(0.21~0.50) | 2.65(1.38~4.58) | 2.45(1.26~4.23) | -0.07(-0.17~0.02) |
| 25~49岁 | 0.04(0.03~0.07) | 0.08(0.06~0.11) | 0.86(0.24~1.70) | |||
| 50~69岁 | 4.19(2.19~7.20) | 4.08(2.19~7.00) | -0.02(-0.11~0.08) | |||
| ≥70岁 | 20.80(10.70~36.52) | 20.52(11.46~34.92) | -0.01(-0.10~0.11) | |||
| 脑卒中 | ||||||
| 总体 | 759.88(523.40~1 100.59) | 723.95(487.54~1 065.38) | -0.05(-0.25~0.24) | 576.95(387.33~834.76) | 385.97(256.13~577.25) | -0.33(-0.47~-0.15) |
| 男性 | 752.31(503.86~1 086.69) | 869.86(573.71~1 302.76) | 0.16(-0.15~0.58) | 622.59(413.11~923.29) | 496.71(320.45~763.41) | -0.20(-0.41~0.06) |
| 女性 | 767.87(500.23~1 127.54) | 577.93(374.62~863.55) | -0.25(-0.45~0.02) | 542.48(356.41~810.82) | 292.46(188.99~434.91) | -0.46(-0.60~-0.27) |
| 25~49岁 | 106.87(48.91~189.31) | 100.48(50.14~168.76) | -0.06(-0.29~0.25) | |||
| 50~69岁 | 1 456.39(940.60~2 114.25) | 816.72(543.89~1 167.06) | -0.44(-0.57~-0.27) | |||
| ≥70岁 | 4 939.47(3 013.23~7 801.27) | 3 662.37(2 066.96~6 023.36) | -0.26(-0.44~0.00) | |||
Table 3 The changes in mortality and DALY rates of three types of cardiovascular diseases attributable to diabetes in 1990 and 2019
| 25岁及以上人群分类 | 粗死亡率 | 标化死亡率 | ||||
|---|---|---|---|---|---|---|
| 1990年(1/10万) | 2019年(1/10万) | EAPC(95%CI)(%) | 1990年(1/10万) | 2019年(1/10万) | EAPC(95%CI)(%) | |
| 缺血性心脏病 | ||||||
| 总体 | 15.83(9.71~24.88) | 32.84(18.62~53.62) | 1.07(0.59~1.68) | 16.36(9.05~26.27) | 21.10(11.47~35.35) | 0.29(0.04~0.59) |
| 男性 | 15.52(9.49~24.15) | 36.64(20.53~58.73) | 1.36(0.71~2.29) | 19.11(10.33~31.30) | 28.26(14.65~48.10) | 0.48(0.14~0.91) |
| 女性 | 16.15(9.41~27.13) | 29.03(15.65~47.81) | 0.80(0.26~1.46) | 14.68(8.08~24.44) | 16.43(8.77~27.28) | 0.12(-0.18~0.47) |
| 25~49岁 | 1.44(0.69~2.45) | 2.00(0.99~3.21) | 0.38(0.04~0.91) | |||
| 50~69岁 | 20.43(11.31~33.13) | 18.83(10.69~29.40) | -0.08(-0.29~0.19) | |||
| ≥70岁 | 151.10(80.64~255.72) | 241.68(119.81~413.46) | 0.60(0.23~1.02) | |||
| 外周动脉疾病 | ||||||
| 总体 | 0.02(0.02~0.03) | 0.05(0.04~0.06) | 1.23(0.56~1.86) | 0.02(0.02~0.03) | 0.03(0.02~0.04) | 0.31(-0.08~0.66) |
| 男性 | 0.02(0.01~0.03) | 0.06(0.04~0.07) | 1.86(1.02~2.97) | 0.03(0.02~0.04) | 0.04(0.03~0.05) | 0.63(0.13~1.18) |
| 女性 | 0.02(0.01~0.03) | 0.03(0.02~0.05) | 0.63(-0.09~1.34) | 0.02(0.01~0.03) | 0.02(0.01~0.03) | -0.01(-0.44~0.39) |
| 25~49岁 | 0.00(0.00~0.00) | 0.00(0.00~0.00) | 0.89(0.24~1.75) | |||
| 50~69岁 | 0.03(0.02~0.04) | 0.03(0.02~0.04) | 0.18(-0.21~0.63) | |||
| ≥70岁 | 0.21(0.16~0.29) | 0.33(0.25~0.43) | 0.56(0.11~0.95) | |||
| 脑卒中 | ||||||
| 总体 | 33.71(22.23~49.60) | 34.42(21.89~53.95) | 0.02(-0.21~0.35) | 30.55(19.47~47.17) | 20.13(12.41~32.53) | -0.34(-0.49~-0.14) |
| 男性 | 32.28(21.34~48.23) | 41.18(25.41~65.81) | 0.28(-0.08~0.76) | 34.20(21.61~53.84) | 27.55(16.43~46.13) | -0.19(-0.41~0.08) |
| 女性 | 35.21(22.33~53.45) | 27.66(16.97~44.39) | -0.21(-0.45~0.10) | 28.30(17.52~44.84) | 14.78(8.95~24.28) | -0.48(-0.62~-0.27) |
| 25~49岁 | 2.01(0.90~3.58) | 1.81(0.86~3.10) | -0.10(-0.34~0.22) | |||
| 50~69岁 | 48.89(31.54~71.49) | 25.39(16.77~36.42) | -0.48(-0.60~-0.31) | |||
| ≥70岁 | 311.53(187.44~498.95) | 235.56(132.56~401.53) | -0.24(-0.43~0.02) | |||
| 25岁及以上人群分类 | DALY粗率 | 标化DALY率 | ||||
| 1990年(1/10万) | 2019年(1/10万) | EAPC(95%CI)(%) | 1990年(1/10万) | 2019年(1/10万) | EAPC(95%CI)(%) | |
| 缺血性心脏病 | ||||||
| 总体 | 344.52(212.33~535.71) | 578.04(362.74~894.38) | 0.68(0.32~1.14) | 276.80(171.38~427.71) | 326.68(200.79~507.53) | 0.18(-0.04~0.47) |
| 男性 | 366.93(224.66~550.69) | 701.37(436.70~1 090.43) | 0.91(0.43~1.64) | 320.34(191.66~491.75) | 434.88(259.71~687.70) | 0.36(0.04~0.77) |
| 女性 | 320.86(202.31~508.10) | 454.61(265.33~708.17) | 0.42(0.03~0.91) | 241.56(149.15~387.53) | 239.41(140.30~375.31) | -0.01(-0.27~0.31) |
| 25~49岁 | 72.41(34.08~123.38) | 98.76(47.86~160.45) | 0.36(0.03~0.86) | |||
| 50~69岁 | 604.63(335.08~952.88) | 563.39(316.77~855.80) | -0.07(-0.27~0.19) | |||
| ≥70岁 | 2 207.41(1 201.70~3 841.31) | 3 130.60(1 644.95~5 313.02) | 0.42(0.10~0.81) | |||
| 外周动脉疾病 | ||||||
| 总体 | 2.43(1.32~4.09) | 3.62(2.05~6.03) | 0.49(0.36~0.66) | 2.00(1.09~3.41) | 1.95(1.11~3.20) | -0.03(-0.11~0.07) |
| 男性 | 1.32(0.79~2.08) | 2.37(1.56~3.52) | 0.79(0.54~1.19) | 1.19(0.72~1.91) | 1.37(0.92~2.03) | 0.15(-0.01~0.41) |
| 女性 | 3.59(1.85~6.24) | 4.88(2.49~8.45) | 0.36(0.21~0.50) | 2.65(1.38~4.58) | 2.45(1.26~4.23) | -0.07(-0.17~0.02) |
| 25~49岁 | 0.04(0.03~0.07) | 0.08(0.06~0.11) | 0.86(0.24~1.70) | |||
| 50~69岁 | 4.19(2.19~7.20) | 4.08(2.19~7.00) | -0.02(-0.11~0.08) | |||
| ≥70岁 | 20.80(10.70~36.52) | 20.52(11.46~34.92) | -0.01(-0.10~0.11) | |||
| 脑卒中 | ||||||
| 总体 | 759.88(523.40~1 100.59) | 723.95(487.54~1 065.38) | -0.05(-0.25~0.24) | 576.95(387.33~834.76) | 385.97(256.13~577.25) | -0.33(-0.47~-0.15) |
| 男性 | 752.31(503.86~1 086.69) | 869.86(573.71~1 302.76) | 0.16(-0.15~0.58) | 622.59(413.11~923.29) | 496.71(320.45~763.41) | -0.20(-0.41~0.06) |
| 女性 | 767.87(500.23~1 127.54) | 577.93(374.62~863.55) | -0.25(-0.45~0.02) | 542.48(356.41~810.82) | 292.46(188.99~434.91) | -0.46(-0.60~-0.27) |
| 25~49岁 | 106.87(48.91~189.31) | 100.48(50.14~168.76) | -0.06(-0.29~0.25) | |||
| 50~69岁 | 1 456.39(940.60~2 114.25) | 816.72(543.89~1 167.06) | -0.44(-0.57~-0.27) | |||
| ≥70岁 | 4 939.47(3 013.23~7 801.27) | 3 662.37(2 066.96~6 023.36) | -0.26(-0.44~0.00) | |||
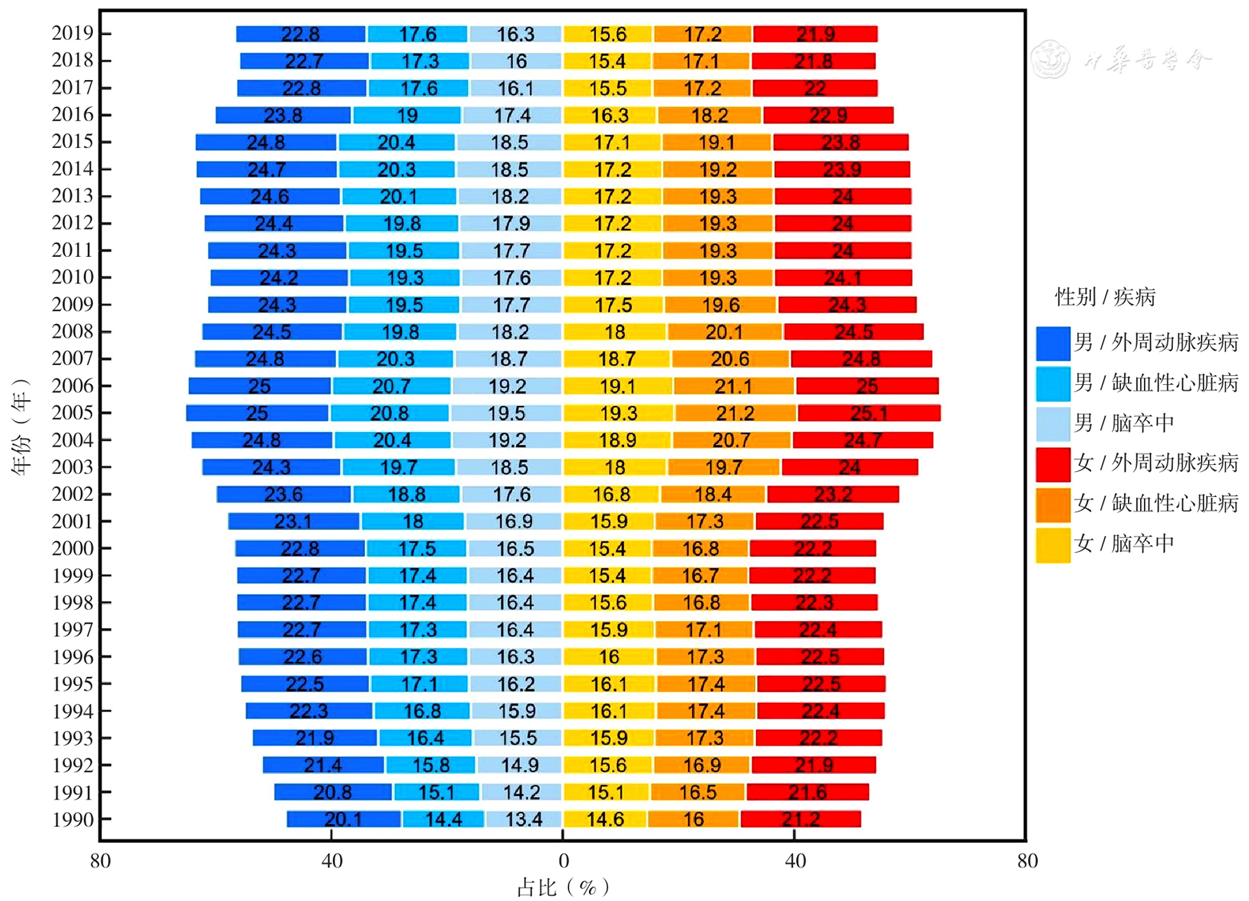
Figure 1 The changes in the proportion of standardized DALY rates attributable to diabetes for cardiovascular diseases among the Chinese population aged 25 years and above from 1990 to 2019
| [1] |
WHO. Global health risks:mortality and burden of disease attributable to selected major risks[EB/OL].(2019-09-10)[2022-05-25].
|
| [2] |
钱佳慧,曹裴娅,吴侃,等. 慢性病对中国老年人日常生活活动能力影响的调查研究[J]. 中国全科医学,2016,19(35):4364-4369. DOI:10.3969/j.issn.1007-9572.2016.35.015.
|
| [3] |
International Diabetes Federation.IDF Diabetes Atlas,10th ed[R]. Brussels,Belgium:International Diabetes Federation,2021.
|
| [4] | |
| [5] |
|
| [6] |
《中国心血管健康与疾病报告》编写组. 《中国心血管健康与疾病报告2020》概述[J]. 中国心血管病研究,2021,19(7):582-590. DOI:10.3969/j.issn.1672-5301.2021.07.002.
|
| [7] |
中国心血管健康与疾病报告编写组. 中国心血管健康与疾病报告2022概要[J]. 中国循环杂志,2023,38(6):583-612. DOI:10.3969/j.issn.1000-3614.2023.06.001.
|
| [8] |
李小梅. 双心护理措施对糖尿病患者行冠心病介入治疗中遵医行为与心血管不良事件的影响研究[J]. 糖尿病新世界,2021,24(21):159-162,167. DOI:10.16658/j.cnki.1672-4062.2021.21.159.
|
| [9] |
|
| [10] |
The Academy of Medical Sciences. Multimorbidity:a priority for global health research[R/OL]. [2023-10-12].
|
| [11] |
GBD Diabetes in The Americas Collaborators. Burden of diabetes and hyperglycaemia in adults in the Americas,1990-2019:a systematic analysis for the Global Burden of Disease Study 2019[J]. Lancet Diabetes Endocrinol,2022,10(9):655-667. DOI:10.1016/S2213-8587(22)00186-3.
|
| [12] |
GBD Demographics Collaborators. Global age-sex-specific fertility,mortality,healthy life expectancy(HALE),and population estimates in 204 countries and territories,1950-2019:a comprehensive demographic analysis for the Global Burden of Disease Study 2019[J]. Lancet,2020,396(10258):1160-1203. DOI:10.1016/S0140-6736(20)30977-6.
|
| [13] |
|
| [14] |
|
| [15] |
|
| [16] |
|
| [17] |
|
| [18] |
|
| [19] |
|
| [20] |
|
| [21] | |
| [22] |
林永兴,刘足云,李娜,等. 1990—2019年浙江省心血管疾病负担变化趋势[J]. 预防医学,2022,34(10):1020-1025. DOI:10.19485/j.cnki.issn2096-5087.2022.10.010.
|
| [23] |
|
| [1] | BAI Jiaxin, CHEN Yu, ZHOU Yiheng, LIU Lidi, YANG Rong, YAO Yi, YUAN Bo, ZHANG Yonggang, LEI Yi, ZENG Rui, JIA Yu, LIAO Xiaoyang. Assessment and Treatment of Early-onset Hypertension: Position Statement of the British and Irish Hypertension Association and Its Implications for Clinical Management of Early-onset Hypertension in China [J]. Chinese General Practice, 2025, 28(30): 3741-3746. |
| [2] | LI Ling, LI Yaping, QIAN Shixing, NIE Jing, LU Chunhua, LI Xia. Research on Influencing Factors and Risk Prediction of Cognitive Function in Community-dwelling Middle-aged and Elderly People [J]. Chinese General Practice, 2025, 28(30): 3773-3778. |
| [3] | ZHOU Sheng, DENG Changsheng, ZOU Guanyang, SONG Jianping. Research Progress on the Pathogenesis of Complications of Malaria in Cardiovascular Diseases [J]. Chinese General Practice, 2025, 28(27): 3466-3472. |
| [4] | ZHANG Yunuo, LI Ruibin, WANG Wei. Correlation Analysis of Serum Nesfatin-1 and Ghrelin Levels with Glycolipid Metabolism and Type 2 Diabetes Mellitus [J]. Chinese General Practice, 2025, 28(26): 3264-3270. |
| [5] | ZHANG Ruimin, DONG Zheyi, LI Shuang, WANG Qian, CHEN Xiangmei. Traditional Chinese Medicine Factors Associated with Diabetic Nephropathy Diagnosed by Renal Biopsy [J]. Chinese General Practice, 2025, 28(26): 3307-3313. |
| [6] | SHANG Zhonghua, JIANG Zhiyue, HUANG Zhaohui, YANG Xing, LIU Haiyan, ZHANG Li. Trends in Cervical Cancer Burden in China from 1990 to 2021 and Prediction for 2022 to 2035 [J]. Chinese General Practice, 2025, 28(26): 3314-3320. |
| [7] | XIANG Xinyue, ZHANG Bingqing, OUYANG Yuqin, TANG Wenjuan, FENG Wenhuan. Impact of Short-term Medical Weight Loss on Atherosclerotic Cardiovascular Disease Risk in Patients with Obesity [J]. Chinese General Practice, 2025, 28(26): 3229-3239. |
| [8] | CUI Yuyang, CHENG Guirong, ZENG Yan, HUANG Zhaolan, TAN Wei. Association between Marital Status, Social Support and Lifestyle with Cognitive Impairment among Community-dwelling Older Adults: Based on the Baseline Survey of Hubei Memory and Aging Cohort Study [J]. Chinese General Practice, 2025, 28(26): 3240-3247. |
| [9] | LUO Xinyu, LIU Jin, CHEN Hailong. Trend Analysis of the Changing Disease Burden of Pancreatitis in China and Worldwide from 1990 to 2021 and Prediction for 2022 to 2031 [J]. Chinese General Practice, 2025, 28(26): 3321-3327. |
| [10] | TANG Shangfeng, HUANG Yangzhen, ZHENG Yanxi, PAN Yangyang, XIONG Zhongbao, QING Hua, SONG Jia, WEI Yilin, DONG Heng, WANG Chunying, CHEN Manwei, ZHANG Kangkang. Specification for the Integration of Healthcare and Prevention Services in Diabetes at the Primary Level [J]. Chinese General Practice, 2025, 28(25): 3096-3103. |
| [11] | YANG Chen, CHEN Tong, ZHANG Lifang, ZHANG Hongxu, LI Pengfei, ZHANG Xuejuan. Prognostic Impact of Dapagliflozin in Elderly Breast Cancer Survivors with Heart Failure with Preserved Ejection Fraction and Type 2 Diabetes [J]. Chinese General Practice, 2025, 28(24): 3053-3058. |
| [12] | LIU Yinyin, SUI Hongping, LI Tingting, JIANG Tongtong, SHI Tieying, XIA Yunlong. Advances in Risk Prediction Models for Cardiotoxicity Associated with Breast Cancer Treatment [J]. Chinese General Practice, 2025, 28(24): 3072-3078. |
| [13] | WANG Rupeng, NAN Jing, HU Yiran, YANG Shenghua, JIN Zening. Predictive Value of the Triglyceride-Glucose Body Mass Index for Slow Flow/No-reflow Phenomenon in Patients with Type 2 Diabetes Mellitus and Acute Myocardial Infarction Undergoing Emergency Percutaneous Coronary Intervention [J]. Chinese General Practice, 2025, 28(24): 2985-2992. |
| [14] | LIU Yueying, WANG Xueli, LIU Yuqiu, WEI Limin. Correlation of Fasting C-peptide to Diabetes Duration Ration and Type 2 Diabetes Mellitus Combined with Metabolism-related Fatty Liver Disease [J]. Chinese General Practice, 2025, 28(23): 2852-2860. |
| [15] | WANG Peng, QIU Lixia, XU Shanshan, ZHANG Yang, ZHANG Jing, DU Xiaofei. Advances in the Co-management of Metabolism Dysfunction-associated Fatty Liver Disease and Type 2 Diabetes Mellitus [J]. Chinese General Practice, 2025, 28(23): 2846-2851. |
| Viewed | ||||||
|
Full text |
|
|||||
|
Abstract |
|
|||||