
中国全科医学 ›› 2024, Vol. 27 ›› Issue (06): 685-691.DOI: 10.12114/j.issn.1007-9572.2022.0765
所属专题: 高血压最新文章合集
孙星河, 汪洋, 康俊萍, 刘小慧*( )
)
收稿日期:2022-09-30
修回日期:2022-12-26
出版日期:2024-02-20
发布日期:2023-11-21
通讯作者:
刘小慧
SUN Xinghe, WANG Yang, KANG Junping, LIU Xiaohui*()
Received:2022-09-30
Revised:2022-12-26
Published:2024-02-20
Online:2023-11-21
Contact:
LIU Xiaohui
摘要: 背景 通过24 h尿钠测定计算原发性高血压患者的钠盐摄入量对指导治疗具有重要意义,但检测过程繁琐。已有的通过点尿钠估测24 h尿钠水平公式在我国原发性高血压患者中的估测价值尚不清楚。目的 评价在我国原发性高血压患者中,应用Kawasaki、INTERSALT、Tanaka公式(以下分别简称K法、I法、T法)以点尿钠估测24 h尿钠水平的准确性。方法 纳入2018年3月—2021年3月于北京大学国际医院心内科住院的原发性高血压患者为研究对象,收集患者的一般资料,测量24 h尿钠排泄量,通过点尿钠估测24 h尿钠排泄量。采用配对t检验评估3种公式24 h尿钠排泄量估测值与实测值差异的显著性,并采用Spearman秩相关分析两者的相关性。绘制Bland–Altman图对24 h尿钠排泄量实测值与估测值进行一致性分析。计算3种方法24 h尿钠排泄量估测值与实测值的相对偏差。评估在不同钠盐摄入水平、患有糖尿病、临床蛋白尿患者中3种估测公式的准确性。结果 最终纳入患者196例,平均实测24 h尿钠排泄量(165.04±78.53)mmol/d,相当于钠盐摄入量(9.65±4.59)g/d。女性患者年龄、微量蛋白尿比例、临床蛋白尿比例高于男性患者,BMI、入院舒张压、24 h平均舒张压、吸烟比例、点尿钠、实测24 h尿钠排泄量低于男性患者(P<0.05)。患者24 h尿钠排泄量实测值低于K法24 h尿钠排泄量估测值(t配对=-8.008,P<0.001),Bland-Altman散点图显示有94.90%的点在95%CI之内。患者24 h尿钠排泄量实测值高于I法24 h尿钠排泄量估测值(t配对=4.167,P<0.001),Bland-Altman散点图显示有94.39%的点在95%CI之内。患者24 h尿钠排泄量实测值与T法24 h尿钠排泄量估测值比较,差异无统计学意义(t配对=-0.547,P>0.05),Bland-Altman散点图显示有96.43%的点在95%CI之内。K法、I法、T法24 h尿钠排泄量估测值的相对偏差分别为-31.82%、12.94 %、-1.90%。根据钠盐摄入量进行分组后,估测值与实测值原本中等强度的相关性消失。三种方法的估测偏差在是否患有糖尿病、临床蛋白尿的患者之间差距不大。结论 通过K法、I法、T法在原发性高血压患者中通过点尿钠预测24 h尿钠水平上均具有偏差,但整体上T法偏差最小。未发现可能影响尿钠排泄的疾病(如糖尿病、蛋白尿)对估测公式的准确性有显著影响。
| 公式名称 | 点尿钠测定样本类型 | 24 h尿钠排泄量估测公式 |
|---|---|---|
| Kawasaki | 清晨空腹第2次尿 | 24 h尿钠排泄量(mmol/d)=16.3×[点尿钠(mmol/L)/点尿肌酐(mg/L)×24 h尿肌酐(mg/d)]0.5 24 h尿肌酐(mg/d)(男)=15.12×体质量(kg)+7.39×身高(cm)-12.63×年龄-79.9 24 h尿肌酐(mg/d)(女)=8.58×体质量(kg)+5.09×身高(cm)-4.72×年龄-74.5 |
| INTERSALT | 随机尿 | 24 h尿钠排泄量(mmol/d)(男)=25.46+0.46×点尿钠(mmol/L)-2.75×点尿肌酐(mmol/L)-0.13×点尿钾(mmol/L)+4.1×BMI+0.26×年龄 24 h尿钠排泄量(mmol/d)(女)=5.07+0.34×点尿钠(mmol/L)-2.16×点尿肌酐(mmol/L)-0.09×点尿钾(mmol/L)+2.39×BMI+2.35×年龄-0.03×年龄2 |
| Tanaka | 随机尿 | 24 h尿钠排泄量(mmol/d)=21.98×[点尿钠(mmol/L)/点尿肌酐(mg/L)×24 h尿肌酐(mg/d)]0.392 24 h尿肌酐(mg/d)=14.89×体质量(kg)+16.14×身高(cm)-2.04×年龄-2 244.45 |
表1 通过点尿钠估测24 h尿钠的公式
Table 1 Three equations using spot urine samples to estimate 24-hour urinary sodium excretion
| 公式名称 | 点尿钠测定样本类型 | 24 h尿钠排泄量估测公式 |
|---|---|---|
| Kawasaki | 清晨空腹第2次尿 | 24 h尿钠排泄量(mmol/d)=16.3×[点尿钠(mmol/L)/点尿肌酐(mg/L)×24 h尿肌酐(mg/d)]0.5 24 h尿肌酐(mg/d)(男)=15.12×体质量(kg)+7.39×身高(cm)-12.63×年龄-79.9 24 h尿肌酐(mg/d)(女)=8.58×体质量(kg)+5.09×身高(cm)-4.72×年龄-74.5 |
| INTERSALT | 随机尿 | 24 h尿钠排泄量(mmol/d)(男)=25.46+0.46×点尿钠(mmol/L)-2.75×点尿肌酐(mmol/L)-0.13×点尿钾(mmol/L)+4.1×BMI+0.26×年龄 24 h尿钠排泄量(mmol/d)(女)=5.07+0.34×点尿钠(mmol/L)-2.16×点尿肌酐(mmol/L)-0.09×点尿钾(mmol/L)+2.39×BMI+2.35×年龄-0.03×年龄2 |
| Tanaka | 随机尿 | 24 h尿钠排泄量(mmol/d)=21.98×[点尿钠(mmol/L)/点尿肌酐(mg/L)×24 h尿肌酐(mg/d)]0.392 24 h尿肌酐(mg/d)=14.89×体质量(kg)+16.14×身高(cm)-2.04×年龄-2 244.45 |
| 指标 | 女性患者(n=91) | 男性患者(n=105) | χ2(t)值 | P值 |
|---|---|---|---|---|
| 年龄(岁) | 63.0±12.1 | 52.3±14.7 | -5.875a | <0.001 |
| 体质指数(kg/m2) | 26.14±4.15 | 27.49±3.67 | 2.224a | 0.027 |
| 入院收缩压(mmHg) | 151±20 | 148±19 | -0.950a | 0.343 |
| 入院舒张压(mmHg) | 79±15 | 85±16 | 2.776a | 0.006 |
| 24 h平均收缩压(mmHg) | 130±18 | 130±17 | 0.044a | 0.965 |
| 24 h平均舒张压(mmHg) | 71±11 | 78±13 | 4.151a | <0.001 |
| 24 h平均心率(bpm) | 69±10 | 71±9 | 1.181a | 0.239 |
| 夜间血压下降异常[例(%)] | 65(72.2) | 65(63.1) | 1.815 | 0.178 |
| 糖尿病[例(%)] | 26(28.6) | 27(25.7) | 0.202 | 0.653 |
| 高脂血症[例(%)] | 65(71.4) | 69(65.7) | 0.736 | 0.391 |
| 左心室肥厚[例(%)] | 12(13.2) | 12(11.5) | 0.122 | 0.727 |
| 颈动脉内中膜增厚或斑块[例(%)] | 67(75.3) | 75(75.0) | 0.002 | 0.964 |
| 吸烟史[例(%)] | 1(1.1) | 59(56.2) | 69.657 | <0.001 |
| 微量蛋白尿[例(%)] | 28(31.1) | 19(18.1) | 4.488 | 0.034 |
| 临床蛋白尿[例(%)] | 8(8.8) | 2(1.9) | 4.775 | 0.047 |
| 点尿钠(mmol/L) | 101.35±49.49 | 134.44±56.54 | 4.350a | <0.001 |
| 实测24 h尿钠排泄量(mmol/d) | 134.86±62.90 | 193.11±82.00 | 5.458a | <0.001 |
表2 入组的原发性高血压患者基线特征
Table 2 Baseline characteristics of enrolled patients with primary hypertension
| 指标 | 女性患者(n=91) | 男性患者(n=105) | χ2(t)值 | P值 |
|---|---|---|---|---|
| 年龄(岁) | 63.0±12.1 | 52.3±14.7 | -5.875a | <0.001 |
| 体质指数(kg/m2) | 26.14±4.15 | 27.49±3.67 | 2.224a | 0.027 |
| 入院收缩压(mmHg) | 151±20 | 148±19 | -0.950a | 0.343 |
| 入院舒张压(mmHg) | 79±15 | 85±16 | 2.776a | 0.006 |
| 24 h平均收缩压(mmHg) | 130±18 | 130±17 | 0.044a | 0.965 |
| 24 h平均舒张压(mmHg) | 71±11 | 78±13 | 4.151a | <0.001 |
| 24 h平均心率(bpm) | 69±10 | 71±9 | 1.181a | 0.239 |
| 夜间血压下降异常[例(%)] | 65(72.2) | 65(63.1) | 1.815 | 0.178 |
| 糖尿病[例(%)] | 26(28.6) | 27(25.7) | 0.202 | 0.653 |
| 高脂血症[例(%)] | 65(71.4) | 69(65.7) | 0.736 | 0.391 |
| 左心室肥厚[例(%)] | 12(13.2) | 12(11.5) | 0.122 | 0.727 |
| 颈动脉内中膜增厚或斑块[例(%)] | 67(75.3) | 75(75.0) | 0.002 | 0.964 |
| 吸烟史[例(%)] | 1(1.1) | 59(56.2) | 69.657 | <0.001 |
| 微量蛋白尿[例(%)] | 28(31.1) | 19(18.1) | 4.488 | 0.034 |
| 临床蛋白尿[例(%)] | 8(8.8) | 2(1.9) | 4.775 | 0.047 |
| 点尿钠(mmol/L) | 101.35±49.49 | 134.44±56.54 | 4.350a | <0.001 |
| 实测24 h尿钠排泄量(mmol/d) | 134.86±62.90 | 193.11±82.00 | 5.458a | <0.001 |
| 患者人群 | 例数 | 24 h尿钠排泄量实测值 | 24 h尿钠排泄量估测值 | t配对值 | P值 |
|---|---|---|---|---|---|
| 女性患者 | 91 | 134.86±62.90 | 194.97±64.55 | -8.786 | <0.001 |
| 男性患者 | 105 | 193.11±82.00 | 237.44±83.30 | -4.274 | <0.001 |
| 糖尿病患者 | 53 | 155.70±75.79 | 219.20±87.73 | -4.850 | <0.001 |
| 非糖尿病患者 | 143 | 168.62±79.77 | 217.03±74.33 | -6.401 | <0.001 |
| 白蛋白尿患者 | 57 | 152.12±73.94 | 235.92±100.39 | -5.926 | <0.001 |
| 无蛋白尿患者 | 139 | 169.15±80.23 | 211.96±69.18 | -5.879 | <0.001 |
| 钠盐摄入量 | |||||
| <6.0 g组 | 40 | 67.18±24.42 | 164.38±67.29 | -9.593 | <0.001 |
| 6.0~8.9 g组 | 51 | 127.33±14.17 | 207.76±75.02 | -7.526 | <0.001 |
| 9.0~11.9 g组 | 58 | 175.86±14.20 | 243.11±76.48 | -6.442 | <0.001 |
| ≥12 g组 | 47 | 276.39±49.53 | 242.73±67.03 | 2.659 | 0.011 |
表3 K法24 h尿钠排泄量估测值与24 h尿钠排泄量实测值的比较(±s,mmol/d)
Table 3 The difference and correlation between the estimated 24-hour urinary sodium excretion by Kawasaki equation and the measured value
| 患者人群 | 例数 | 24 h尿钠排泄量实测值 | 24 h尿钠排泄量估测值 | t配对值 | P值 |
|---|---|---|---|---|---|
| 女性患者 | 91 | 134.86±62.90 | 194.97±64.55 | -8.786 | <0.001 |
| 男性患者 | 105 | 193.11±82.00 | 237.44±83.30 | -4.274 | <0.001 |
| 糖尿病患者 | 53 | 155.70±75.79 | 219.20±87.73 | -4.850 | <0.001 |
| 非糖尿病患者 | 143 | 168.62±79.77 | 217.03±74.33 | -6.401 | <0.001 |
| 白蛋白尿患者 | 57 | 152.12±73.94 | 235.92±100.39 | -5.926 | <0.001 |
| 无蛋白尿患者 | 139 | 169.15±80.23 | 211.96±69.18 | -5.879 | <0.001 |
| 钠盐摄入量 | |||||
| <6.0 g组 | 40 | 67.18±24.42 | 164.38±67.29 | -9.593 | <0.001 |
| 6.0~8.9 g组 | 51 | 127.33±14.17 | 207.76±75.02 | -7.526 | <0.001 |
| 9.0~11.9 g组 | 58 | 175.86±14.20 | 243.11±76.48 | -6.442 | <0.001 |
| ≥12 g组 | 47 | 276.39±49.53 | 242.73±67.03 | 2.659 | 0.011 |
| 患者人群 | rs值 | P值 |
|---|---|---|
| 女性患者 | 0.472 | <0.001 |
| 男性患者 | 0.195 | 0.047 |
| 糖尿病患者 | 0.425 | 0.002 |
| 非糖尿病患者 | 0.386 | <0.001 |
| 白蛋白尿患者 | 0.409 | 0.005 |
| 无蛋白尿患者 | 0.401 | <0.001 |
| 钠盐摄入量 | ||
| <6.0 g组 | 0.319 | 0.045 |
| 6.0~8.9 g组 | -0.016 | 0.913 |
| 9.0~11.9 g组 | 0.014 | 0.915 |
| ≥12 g组 | <0.001 | 0.999 |
表4 K法24 h尿钠排泄量估测值与24 h尿钠排泄量实测值的相关性分析
Table 4 Correlation analysis between estimated 24-hour sodium excretion by Kawasaki equation and measured 24-hour sodium excretion
| 患者人群 | rs值 | P值 |
|---|---|---|
| 女性患者 | 0.472 | <0.001 |
| 男性患者 | 0.195 | 0.047 |
| 糖尿病患者 | 0.425 | 0.002 |
| 非糖尿病患者 | 0.386 | <0.001 |
| 白蛋白尿患者 | 0.409 | 0.005 |
| 无蛋白尿患者 | 0.401 | <0.001 |
| 钠盐摄入量 | ||
| <6.0 g组 | 0.319 | 0.045 |
| 6.0~8.9 g组 | -0.016 | 0.913 |
| 9.0~11.9 g组 | 0.014 | 0.915 |
| ≥12 g组 | <0.001 | 0.999 |
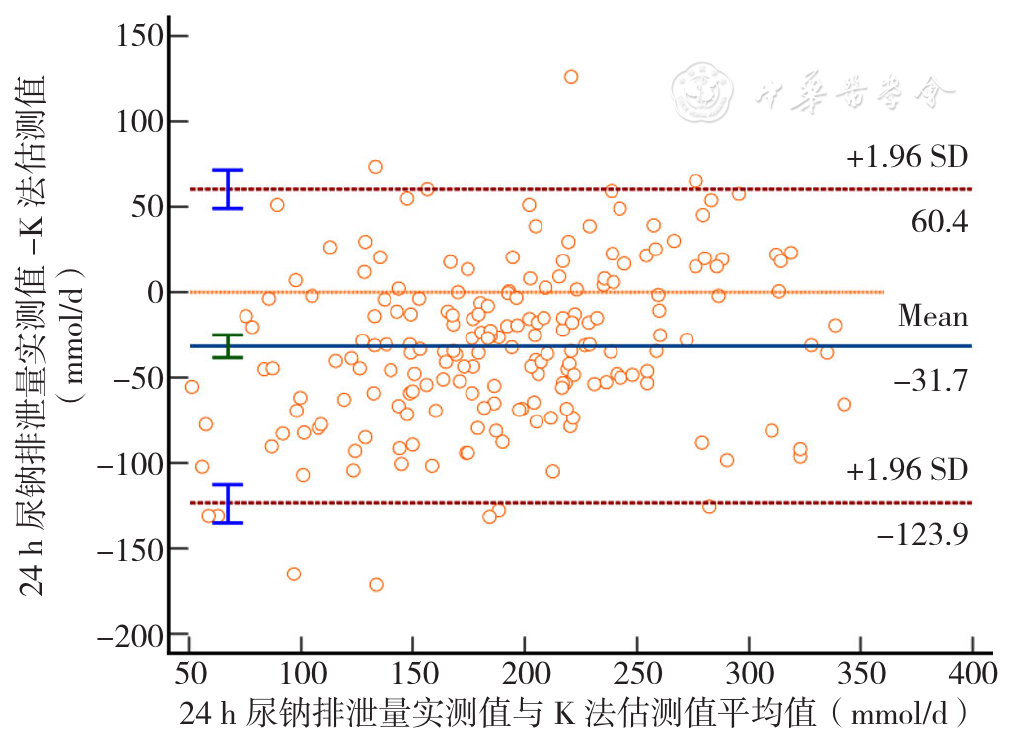
图1 K法24 h尿钠排泄量估测值与24 h尿钠排泄量实测值的一致性评价Bland-Altman图
Figure 1 The consistency of measured 24-hour urine sodium excretion and estimated 24-hour urine sodium excretion by Kawasaki equation evaluated by the Bland-Altman plot
| 患者人群 | 例数 | 24 h尿钠排泄量实测值 | 24 h尿钠排泄量估测值 | t配对值 | P值 |
|---|---|---|---|---|---|
| 女性患者 | 91 | 134.86±62.90 | 107.69±26.42 | 4.678 | <0.001 |
| 男性患者 | 105 | 193.11±82.00 | 174.89±33.58 | 2.008 | 0.047 |
| 糖尿病患者 | 53 | 155.70±75.79 | 139.43±48.83 | 1.651 | 0.105 |
| 非糖尿病患者 | 143 | 168.62±79.77 | 145.26±44.00 | 3.864 | <0.001 |
| 白蛋白尿患者 | 57 | 152.12±73.94 | 140.23±46.24 | 1.179 | 0.244 |
| 无蛋白尿患者 | 139 | 169.15±80.23 | 145.15±45.02 | 4.018 | <0.001 |
| 钠盐摄入量 | |||||
| <6.0 g组 | 40 | 67.18±24.42 | 113.23±40.86 | -6.751 | <0.001 |
| 6.0~8.9 g组 | 51 | 127.33±14.17 | 129.36±43.35 | -0.322 | 0.749 |
| 9.0~11.9 g组 | 58 | 175.86±14.20 | 155.47±43.61 | 3.311 | 0.002 |
| ≥12 g组 | 47 | 276.39±49.53 | 170.61±30.58 | 12.260 | <0.001 |
表5 I法24 h尿钠排泄量估测值与24 h尿钠排泄量实测值的比较(±s,mmol/d)
Table 5 The difference and correlation between the estimated 24-hour urinary sodium excretion by INTERSALT equation and the measured value
| 患者人群 | 例数 | 24 h尿钠排泄量实测值 | 24 h尿钠排泄量估测值 | t配对值 | P值 |
|---|---|---|---|---|---|
| 女性患者 | 91 | 134.86±62.90 | 107.69±26.42 | 4.678 | <0.001 |
| 男性患者 | 105 | 193.11±82.00 | 174.89±33.58 | 2.008 | 0.047 |
| 糖尿病患者 | 53 | 155.70±75.79 | 139.43±48.83 | 1.651 | 0.105 |
| 非糖尿病患者 | 143 | 168.62±79.77 | 145.26±44.00 | 3.864 | <0.001 |
| 白蛋白尿患者 | 57 | 152.12±73.94 | 140.23±46.24 | 1.179 | 0.244 |
| 无蛋白尿患者 | 139 | 169.15±80.23 | 145.15±45.02 | 4.018 | <0.001 |
| 钠盐摄入量 | |||||
| <6.0 g组 | 40 | 67.18±24.42 | 113.23±40.86 | -6.751 | <0.001 |
| 6.0~8.9 g组 | 51 | 127.33±14.17 | 129.36±43.35 | -0.322 | 0.749 |
| 9.0~11.9 g组 | 58 | 175.86±14.20 | 155.47±43.61 | 3.311 | 0.002 |
| ≥12 g组 | 47 | 276.39±49.53 | 170.61±30.58 | 12.260 | <0.001 |
| 患者人群 | rs值 | P值 |
|---|---|---|
| 女性患者 | 0.449 | <0.001 |
| 男性患者 | 0.124 | 0.209 |
| 糖尿病患者 | 0.415 | <0.001 |
| 非糖尿病患者 | 0.472 | <0.001 |
| 白蛋白尿患者 | 0.392 | 0.006 |
| 无蛋白尿患者 | 0.466 | <0.001 |
| 钠盐摄入量 | ||
| <6.0 g组 | 0.085 | 0.600 |
| 6.0~8.9 g组 | 0.006 | 0.965 |
| 9.0~11.9 g组 | -0.012 | 0.931 |
| ≥12 g组 | -0.088 | 0.555 |
表6 I法24 h尿钠排泄量估测值与24 h尿钠排泄量实测值的相关性分析
Table 6 Correlation analysis between estimated 24-hour sodium excretion by INTERSALT equation and measured 24-hour sodium excretion
| 患者人群 | rs值 | P值 |
|---|---|---|
| 女性患者 | 0.449 | <0.001 |
| 男性患者 | 0.124 | 0.209 |
| 糖尿病患者 | 0.415 | <0.001 |
| 非糖尿病患者 | 0.472 | <0.001 |
| 白蛋白尿患者 | 0.392 | 0.006 |
| 无蛋白尿患者 | 0.466 | <0.001 |
| 钠盐摄入量 | ||
| <6.0 g组 | 0.085 | 0.600 |
| 6.0~8.9 g组 | 0.006 | 0.965 |
| 9.0~11.9 g组 | -0.012 | 0.931 |
| ≥12 g组 | -0.088 | 0.555 |
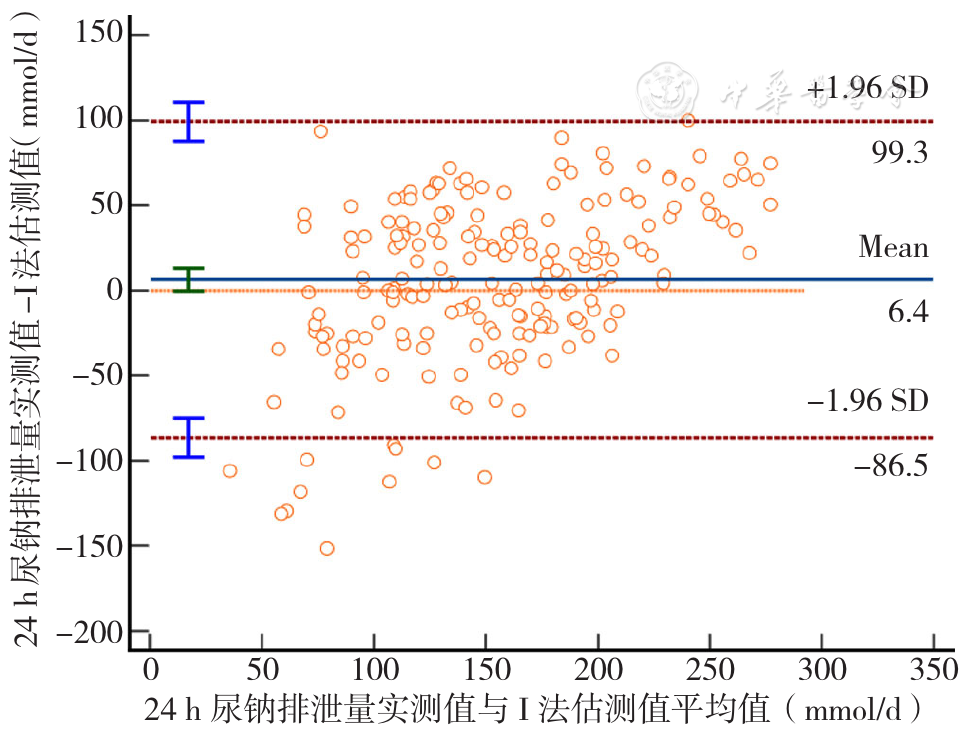
图2 I法24 h尿钠排泄量估测值与24 h尿钠排泄量实测值的一致性评价Bland-Altman图
Figure 2 The consistency of measured 24-hour urine sodium excretion and estimated 24-hour urine sodium excretion by INTERSALT equation evaluated by the Bland-Altman plot
| 患者人群 | 例数 | 24 h尿钠排泄量实测值 | 24 h尿钠排泄量估测值 | t配对值 | P值 |
|---|---|---|---|---|---|
| 女性患者 | 91 | 134.86±62.90 | 161.87±44.05 | -4.524 | <0.001 |
| 男性患者 | 105 | 193.11±82.00 | 173.81±49.54 | 1.992 | 0.049 |
| 糖尿病患者 | 53 | 155.70±75.79 | 170.19±54.05 | -1.336 | 0.187 |
| 非糖尿病患者 | 143 | 168.62±79.77 | 167.51±44.74 | 0.164 | 0.870 |
| 白蛋白尿患者 | 57 | 152.12±73.94 | 181.17±60.37 | -2.696 | 0.010 |
| 无蛋白尿患者 | 139 | 169.15±80.23 | 164.15±42.06 | 0.752 | 0.453 |
| 钠盐摄入量 | |||||
| <6.0 g组 | 40 | 67.18±24.42 | 137.89±44.70 | -10.347 | <0.001 |
| 6.0~8.9 g组 | 51 | 127.33±14.17 | 163.10±46.11 | -5.281 | <0.001 |
| 9.0~11.9 g组 | 58 | 175.86±14.20 | 185.03±44.83 | -1.438 | 0.156 |
| ≥12 g组 | 47 | 276.39±49.53 | 179.30±41.07 | 9.808 | <0.001 |
表7 T法24 h尿钠排泄量估测值与24 h尿钠排泄量实测值的比较(±s,mmol/d)
Table 7 The difference and correlation between the estimated 24-hour urinary sodium excretion by Tanaka equation and the measured value
| 患者人群 | 例数 | 24 h尿钠排泄量实测值 | 24 h尿钠排泄量估测值 | t配对值 | P值 |
|---|---|---|---|---|---|
| 女性患者 | 91 | 134.86±62.90 | 161.87±44.05 | -4.524 | <0.001 |
| 男性患者 | 105 | 193.11±82.00 | 173.81±49.54 | 1.992 | 0.049 |
| 糖尿病患者 | 53 | 155.70±75.79 | 170.19±54.05 | -1.336 | 0.187 |
| 非糖尿病患者 | 143 | 168.62±79.77 | 167.51±44.74 | 0.164 | 0.870 |
| 白蛋白尿患者 | 57 | 152.12±73.94 | 181.17±60.37 | -2.696 | 0.010 |
| 无蛋白尿患者 | 139 | 169.15±80.23 | 164.15±42.06 | 0.752 | 0.453 |
| 钠盐摄入量 | |||||
| <6.0 g组 | 40 | 67.18±24.42 | 137.89±44.70 | -10.347 | <0.001 |
| 6.0~8.9 g组 | 51 | 127.33±14.17 | 163.10±46.11 | -5.281 | <0.001 |
| 9.0~11.9 g组 | 58 | 175.86±14.20 | 185.03±44.83 | -1.438 | 0.156 |
| ≥12 g组 | 47 | 276.39±49.53 | 179.30±41.07 | 9.808 | <0.001 |
| 患者人群 | rs值 | P值 |
|---|---|---|
| 女性患者 | 0.459 | <0.001 |
| 男性患者 | 0.165 | 0.093 |
| 糖尿病患者 | 0.377 | 0.005 |
| 非糖尿病患者 | 0.318 | <0.001 |
| 白蛋白尿患者 | 0.410 | 0.005 |
| 无蛋白尿患者 | 0.331 | <0.001 |
| 钠盐摄入量 | ||
| <6.0 g组 | 0.297 | 0.063 |
| 6.0~8.9 g组 | -0.038 | 0.791 |
| 9.0~11.9 g组 | -0.022 | 0.874 |
| ≥12.0 g组 | -0.060 | 0.691 |
表8 T法24 h尿钠排泄量估测值与24 h尿钠排泄量实测值的相关性分析
Table 8 Correlation analysis between estimated 24-hour sodium excretion by Tanaka equation and measured 24-hour sodium excretion
| 患者人群 | rs值 | P值 |
|---|---|---|
| 女性患者 | 0.459 | <0.001 |
| 男性患者 | 0.165 | 0.093 |
| 糖尿病患者 | 0.377 | 0.005 |
| 非糖尿病患者 | 0.318 | <0.001 |
| 白蛋白尿患者 | 0.410 | 0.005 |
| 无蛋白尿患者 | 0.331 | <0.001 |
| 钠盐摄入量 | ||
| <6.0 g组 | 0.297 | 0.063 |
| 6.0~8.9 g组 | -0.038 | 0.791 |
| 9.0~11.9 g组 | -0.022 | 0.874 |
| ≥12.0 g组 | -0.060 | 0.691 |
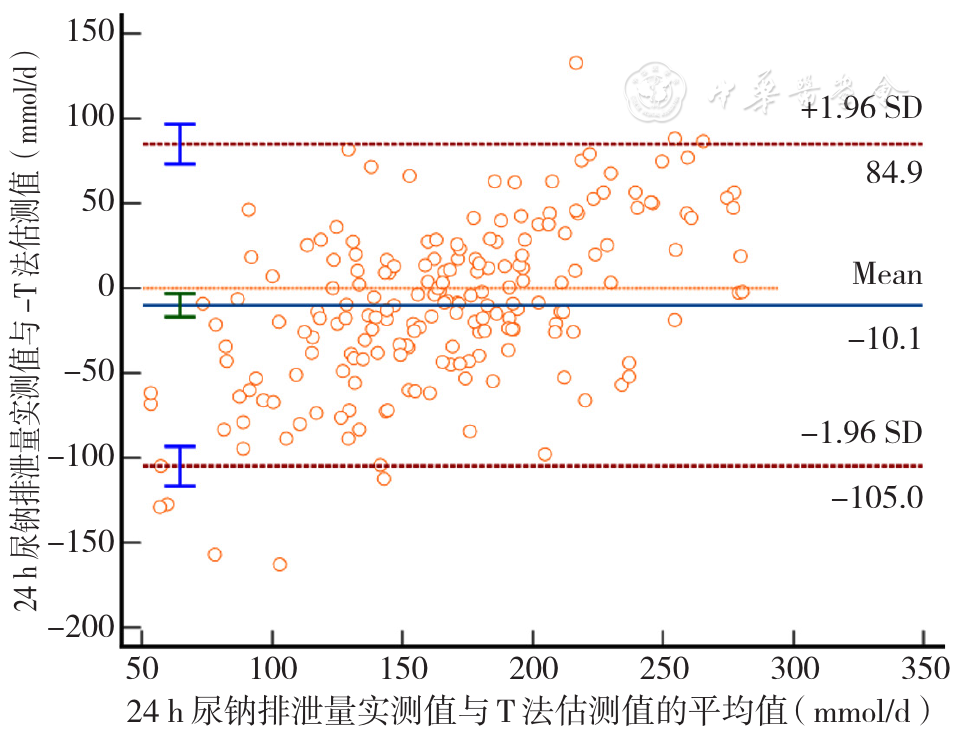
图3 T法24 h尿钠排泄量估测值与24 h尿钠排泄量实测值的一致性评价Bland-Altman图
Figure 3 The consistency of measured and estimated 24-hour urine sodium excretion by Tanaka equation evaluated by the Bland-Altman plot
| 钠盐摄入量 | 例数 | K法24 h尿钠排泄量估测值的相对偏差 | I法24 h尿钠排泄量估测值的相对偏差 | T法24 h尿钠排泄量估测值的相对偏差 |
|---|---|---|---|---|
| <6.0 g组 | 40 | -144.69 | -68.54 | -105.25 |
| 6.0~8.9 g组 | 51 | -63.17 | -1.59 | -28.09 |
| 9.0~11.9 g组 | 58 | -38.23 | 11.37 | -5.21 |
| ≥12 g组 | 47 | 12.18 | 38.27 | 35.13 |
表9 3种估测方法24 h尿钠排泄量估测值与24 h尿钠排泄量实测值的相对偏差(%)
Table 9 The relative difference between the estimated 24-hour sodium excretion by three estimation methods and the measured 24-hour sodium excretion
| 钠盐摄入量 | 例数 | K法24 h尿钠排泄量估测值的相对偏差 | I法24 h尿钠排泄量估测值的相对偏差 | T法24 h尿钠排泄量估测值的相对偏差 |
|---|---|---|---|---|
| <6.0 g组 | 40 | -144.69 | -68.54 | -105.25 |
| 6.0~8.9 g组 | 51 | -63.17 | -1.59 | -28.09 |
| 9.0~11.9 g组 | 58 | -38.23 | 11.37 | -5.21 |
| ≥12 g组 | 47 | 12.18 | 38.27 | 35.13 |
| [1] |
|
| [2] |
|
| [3] |
|
| [4] |
|
| [5] |
|
| [6] |
|
| [7] |
|
| [8] |
|
| [9] |
|
| [10] |
|
| [11] |
|
| [12] |
|
| [13] |
杜晓甫,陈向宇,张洁,等. 三种点尿法估算中国人群24 h尿钠排泄量的可行性评价[J]. 中华预防医学杂志,2020,54(4):420-424. DOI:10.3760/cma.j.cn112150-20190610-00458.
|
| [14] |
|
| [15] |
|
| [16] |
国家卫生健康委员会. 中国居民营养与慢性病状况报告-2020年[M]. 北京:人民卫生出版社,2021.
|
| [17] |
|
| [18] |
|
| [19] |
|
| [20] |
|
| [21] |
|
| [22] |
姜薇,张俊仕,帕提古丽,等. 点尿法及24h尿收集法估算高血压病患者24 h尿钠钾排泄量的应用比较[J]. 中华诊断学电子杂志,2019,7(1):21-25. DOI:10.3877/cma.j.issn.2095-655X.2019.01.005.
|
| [23] |
|
| [24] |
|
| [1] | 梁可可, 郭庆歌, 李晓欢, 马建军, 杨红旗, 石小雪, 范咏言, 杨大伟, 郭大帅, 董琳瑞, 古祺, 李东升. 基于视网膜结构改变的机器学习对早期帕金森病诊断的预测价值研究[J]. 中国全科医学, 2024, 27(09): 1102-1108. |
| [2] | 陈玟瑾, 陈飘盈, 杨晓华, 陈轶凡, 蔡业峰, 倪小佳. 膳食模式与脑血管疾病相关的流行病学研究新进展[J]. 中国全科医学, 2024, 27(08): 900-907. |
| [3] | 董娜, 崔婷, 王露露, 师荣慧, 冯洁, 黄晓俊. 人工智能在胃癌诊治中的研究趋势:20年的文献计量学分析[J]. 中国全科医学, 2024, 27(04): 493-501. |
| [4] | 中华医学会心身医学分会整体健康协作学组. 精神性头晕诊疗中国专家共识[J]. 中国全科医学, 2024, 27(02): 125-131. |
| [5] | 南子晴, 蔺莉. 妊娠期尿潴留的诊治进展[J]. 中国全科医学, 2023, 26(36): 4608-4612. |
| [6] | 慢性阻塞性肺疾病中西医结合管理专家共识写作组. 慢性阻塞性肺疾病中西医结合管理专家共识(2023版)[J]. 中国全科医学, 2023, 26(35): 4359-4371. |
| [7] | 李纪新, 邱林杰, 任燕, 王文茹, 李美洁, 张晋. 膳食炎症指数与超重和肥胖及腹型肥胖关系的Meta分析[J]. 中国全科医学, 2023, 26(32): 4089-4097. |
| [8] | 洪玉纯, 吴华, 杜宜珊, 李树然, 孙文民, 叶明喻, 张永建, 李阳. 全科医学诊断术语和编码研制及其应用的实证研究[J]. 中国全科医学, 2023, 26(31): 3896-3901. |
| [9] | 陈静, 邹涛, 赵丹青, 肖子文, 吴献青, 中华医学会心身医学分会围产期精神障碍协作组. 围产期精神障碍筛查与诊治专家共识[J]. 中国全科医学, 2023, 26(28): 3463-3470. |
| [10] | 顾蕴杰, 宋静, 殷峻. 低碳饮食治疗内源性胰岛素缺乏糖尿病患者的临床研究[J]. 中国全科医学, 2023, 26(26): 3308-3313. |
| [11] | 张允旭, 王婷婷, 魏俊伶, 邢燕云, 苏莉. 影响女性身心健康的新病症:持续性生殖器官兴奋紊乱/生殖器官-骨盆感觉障碍综合征的研究现状及专家共识解读[J]. 中国全科医学, 2023, 26(23): 2830-2835. |
| [12] | 胡晓飞, 赵平, 曹廷华, 彭兰兰. 腹部脂肪含量及分布对急性胰腺炎及其重症的预测价值研究[J]. 中国全科医学, 2023, 26(21): 2614-2619. |
| [13] | 沈俊希, 朱星, 陈云志, 李文. 肺部、肠道菌群及其相互作用与慢性阻塞性肺疾病发生发展的研究进展[J]. 中国全科医学, 2023, 26(20): 2548-2554. |
| [14] | 任玉梅, 许敏, 叶梅蕾, 章秋, 胡红琳. 胰岛素受体底物2基因突变可能与青少年起病的成人型糖尿病有关:一例报道及其遗传学分析[J]. 中国全科医学, 2023, 26(18): 2301-2305. |
| [15] | 赵丽珍, 李卫民, 姜瑞霞. 系统免疫炎症指数对社区老年2型糖尿病患者并发糖尿病肾病的临床诊断价值研究[J]. 中国全科医学, 2023, 26(18): 2227-2231. |
| 阅读次数 | ||||||
|
全文 |
|
|||||
|
摘要 |
|
|||||


