
Chinese General Practice ›› 2024, Vol. 27 ›› Issue (09): 1118-1125.DOI: 10.12114/j.issn.1007-9572.2023.0564
Special Issue: 呼吸疾病文章合辑
• Original Research • Previous Articles Next Articles
Received:2023-08-29
Revised:2023-10-07
Published:2024-03-20
Online:2023-12-19
Contact:
JIANG Yi
通讯作者:
蒋祎
作者简介:基金资助:
Add to citation manager EndNote|Ris|BibTeX
URL: https://www.chinagp.net/EN/10.12114/j.issn.1007-9572.2023.0564
| 国家 | 年龄组(岁) | 患病率(1/10万) | 死亡率(1/10万) | DALY率(1/10万) | ||||||
|---|---|---|---|---|---|---|---|---|---|---|
| 男性 | 女性 | 合计 | 男性 | 女性 | 合计 | 男性 | 女性 | 合计 | ||
| 巴西 | 40~44 | 1 571.11 | 1 526.31 | 1 548.09 | 3.55 | 2.37 | 2.95 | 230.85 | 188.50 | 209.09 |
| 45~49 | 2 680.33 | 2 570.18 | 2 623.49 | 7.43 | 5.22 | 6.29 | 419.65 | 344.95 | 381.10 | |
| 50~54 | 4 321.04 | 4 105.57 | 4 208.71 | 16.23 | 11.45 | 13.74 | 774.48 | 619.97 | 693.93 | |
| 55~59 | 6 050.39 | 5 682.67 | 5 855.96 | 32.58 | 22.33 | 27.16 | 1 292.60 | 985.33 | 1 130.13 | |
| 60~64 | 7 965.96 | 7 220.80 | 7 565.93 | 67.43 | 42.51 | 54.05 | 2 180.66 | 1 503.36 | 1 817.06 | |
| 65~69 | 10 741.84 | 8 894.69 | 9 738.80 | 124.48 | 74.78 | 97.49 | 3 307.71 | 2 128.52 | 2 667.39 | |
| 70~74 | 14 600.61 | 10 870.01 | 12 542.76 | 229.83 | 135.03 | 177.54 | 4 920.90 | 3 027.53 | 3 876.49 | |
| 75~79 | 19 668.81 | 13 506.41 | 16 164.03 | 401.08 | 227.61 | 302.42 | 6 757.75 | 3 974.39 | 5 174.75 | |
| ≥80 | 30 451.96 | 22 500.20 | 25 560.23 | 901.13 | 574.57 | 700.24 | 9 454.07 | 5 957.39 | 7 303.00 | |
| 合计 | 2 907.50 | 2 843.23 | 2 874.61 | 35.16 | 28.41 | 31.71 | 735.02 | 592.04 | 661.86 | |
| 俄罗斯 | 40~44 | 1 513.35 | 1 296.28 | 1 401.14 | 3.58 | 1.01 | 2.25 | 241.86 | 146.16 | 192.39 |
| 45~49 | 2 641.22 | 1 654.92 | 2 127.44 | 6.83 | 1.84 | 4.23 | 414.74 | 200.62 | 303.20 | |
| 50~54 | 4 233.51 | 2 110.07 | 3 100.57 | 15.38 | 3.38 | 8.98 | 774.83 | 279.58 | 510.59 | |
| 55~59 | 5 923.35 | 2 583.44 | 4 078.37 | 31.27 | 6.43 | 17.54 | 1 294.30 | 391.78 | 795.74 | |
| 60~64 | 7 932.33 | 3 079.26 | 5 124.01 | 69.06 | 12.19 | 36.15 | 2 292.20 | 552.76 | 1 285.64 | |
| 65~69 | 10 897.48 | 3 640.93 | 6 478.42 | 117.26 | 21.49 | 58.94 | 3 240.71 | 749.30 | 1 723.50 | |
| 70~74 | 14 119.31 | 4 426.32 | 7 947.03 | 204.56 | 40.27 | 99.94 | 4 542.26 | 1 062.50 | 2 326.43 | |
| 75~79 | 17 195.63 | 5 844.32 | 9 244.49 | 328.79 | 73.49 | 149.96 | 5 739.51 | 1 488.32 | 2 761.72 | |
| ≥80 | 21 669.61 | 10 539.63 | 13 367.53 | 513.42 | 188.55 | 271.09 | 6 031.97 | 2 425.04 | 3 341.49 | |
| 合计 | 3 312.11 | 2 115.32 | 2 672.54 | 34.35 | 16.61 | 24.87 | 836.59 | 394.05 | 600.09 | |
| 印度 | 40~44 | 1 621.36 | 1 637.83 | 1 629.38 | 6.31 | 3.70 | 5.04 | 521.48 | 393.69 | 459.26 |
| 45~49 | 3 001.61 | 3 044.66 | 3 022.60 | 16.18 | 8.67 | 12.52 | 1 092.70 | 766.11 | 933.48 | |
| 50~54 | 4 765.64 | 4 840.25 | 4 802.50 | 42.65 | 27.95 | 35.39 | 2 230.73 | 1 667.80 | 1 952.68 | |
| 55~59 | 6 440.56 | 6 584.27 | 6 512.70 | 97.18 | 53.40 | 75.21 | 4 014.27 | 2 575.81 | 3 292.22 | |
| 60~64 | 8 687.43 | 8 966.55 | 8 829.29 | 205.78 | 131.08 | 167.82 | 6 870.49 | 4 774.05 | 5 804.98 | |
| 65~69 | 13 047.93 | 13 704.15 | 13 383.22 | 390.77 | 247.26 | 317.45 | 10 807.34 | 7 461.86 | 9 097.99 | |
| 70~74 | 18 482.04 | 19 511.02 | 19 009.11 | 713.85 | 504.33 | 606.53 | 15 961.25 | 11 994.89 | 13 929.58 | |
| 75~79 | 24 280.39 | 25 803.50 | 25 090.58 | 1 181.26 | 818.66 | 988.38 | 20 816.40 | 15 397.99 | 17 934.19 | |
| ≥80 | 32 764.45 | 35 206.32 | 34 147.55 | 2 346.66 | 1 953.88 | 2 124.19 | 27 757.36 | 23 841.74 | 25 539.52 | |
| 合计 | 2 537.44 | 2 919.17 | 2 723.41 | 69.33 | 59.63 | 64.60 | 1 648.43 | 1 398.36 | 1 526.60 | |
| 中国 | 40~44 | 846.81 | 997.35 | 920.52 | 3.14 | 1.63 | 2.40 | 220.78 | 198.81 | 210.02 |
| 45~49 | 1 399.68 | 1 564.53 | 1 480.54 | 5.79 | 3.03 | 4.43 | 364.53 | 316.20 | 340.83 | |
| 50~54 | 2 441.83 | 2 627.83 | 2 534.40 | 13.54 | 6.64 | 10.10 | 713.78 | 559.22 | 636.86 | |
| 55~59 | 3 836.25 | 4 063.38 | 3 949.28 | 28.95 | 13.87 | 21.45 | 1 267.11 | 925.75 | 1 097.23 | |
| 60~64 | 5 743.86 | 6 128.27 | 5 935.16 | 67.35 | 33.77 | 50.64 | 2 361.60 | 1 644.62 | 2 004.81 | |
| 65~69 | 8 984.10 | 9 852.28 | 9 426.15 | 148.88 | 78.18 | 112.88 | 4 229.80 | 2 936.88 | 3 571.50 | |
| 70~74 | 13 518.18 | 15 026.18 | 14 291.09 | 391.65 | 208.58 | 297.82 | 8 598.37 | 5 645.13 | 7 084.72 | |
| 75~79 | 18 915.99 | 21 320.15 | 20 181.42 | 817.83 | 448.43 | 623.39 | 13 898.57 | 9 066.29 | 11 355.09 | |
| ≥80 | 25 239.30 | 30 901.68 | 28 698.43 | 2 395.19 | 1 429.67 | 1 805.36 | 26 234.08 | 16 591.04 | 20 343.18 | |
| 合计 | 2 768.81 | 3 597.85 | 3 175.37 | 82.25 | 63.27 | 72.94 | 1 523.84 | 1 272.75 | 1 400.71 | |
| 南非 | 40~44 | 1 479.83 | 1 411.38 | 1 445.68 | 4.79 | 1.56 | 3.18 | 396.32 | 290.43 | 343.50 |
| 45~49 | 2 576.99 | 2 131.53 | 2 345.11 | 8.34 | 3.58 | 5.86 | 648.40 | 475.45 | 558.37 | |
| 50~54 | 4 254.41 | 3 279.84 | 3 728.40 | 19.46 | 8.11 | 13.33 | 1 213.23 | 796.41 | 988.26 | |
| 55~59 | 6 009.64 | 4 559.31 | 5 205.52 | 44.04 | 19.10 | 30.21 | 2 114.84 | 1 301.81 | 1 664.07 | |
| 60~64 | 7 892.76 | 5 755.53 | 6 684.05 | 83.10 | 34.39 | 55.55 | 3 202.40 | 1 802.45 | 2 410.66 | |
| 65~69 | 10 662.56 | 6 903.73 | 8 506.13 | 163.65 | 69.28 | 109.51 | 5 012.95 | 2 612.10 | 3 635.59 | |
| 70~74 | 13 939.23 | 7 963.60 | 10 421.28 | 330.51 | 132.47 | 213.92 | 7 849.28 | 3 661.41 | 5 383.82 | |
| 75~79 | 17 799.30 | 9 229.55 | 12 453.51 | 463.74 | 189.30 | 292.54 | 8 907.96 | 4 134.17 | 5 930.08 | |
| ≥80 | 27 221.53 | 14 243.37 | 18 221.47 | 991.47 | 489.42 | 643.31 | 12 563.74 | 6 556.64 | 8 397.95 | |
| 合计 | 1 976.48 | 1 792.78 | 1 882.75 | 25.20 | 17.57 | 21.30 | 733.85 | 570.19 | 650.35 | |
Table 1 Epidemiological status of COPD by gender and age in the BRICS countries in 2019
| 国家 | 年龄组(岁) | 患病率(1/10万) | 死亡率(1/10万) | DALY率(1/10万) | ||||||
|---|---|---|---|---|---|---|---|---|---|---|
| 男性 | 女性 | 合计 | 男性 | 女性 | 合计 | 男性 | 女性 | 合计 | ||
| 巴西 | 40~44 | 1 571.11 | 1 526.31 | 1 548.09 | 3.55 | 2.37 | 2.95 | 230.85 | 188.50 | 209.09 |
| 45~49 | 2 680.33 | 2 570.18 | 2 623.49 | 7.43 | 5.22 | 6.29 | 419.65 | 344.95 | 381.10 | |
| 50~54 | 4 321.04 | 4 105.57 | 4 208.71 | 16.23 | 11.45 | 13.74 | 774.48 | 619.97 | 693.93 | |
| 55~59 | 6 050.39 | 5 682.67 | 5 855.96 | 32.58 | 22.33 | 27.16 | 1 292.60 | 985.33 | 1 130.13 | |
| 60~64 | 7 965.96 | 7 220.80 | 7 565.93 | 67.43 | 42.51 | 54.05 | 2 180.66 | 1 503.36 | 1 817.06 | |
| 65~69 | 10 741.84 | 8 894.69 | 9 738.80 | 124.48 | 74.78 | 97.49 | 3 307.71 | 2 128.52 | 2 667.39 | |
| 70~74 | 14 600.61 | 10 870.01 | 12 542.76 | 229.83 | 135.03 | 177.54 | 4 920.90 | 3 027.53 | 3 876.49 | |
| 75~79 | 19 668.81 | 13 506.41 | 16 164.03 | 401.08 | 227.61 | 302.42 | 6 757.75 | 3 974.39 | 5 174.75 | |
| ≥80 | 30 451.96 | 22 500.20 | 25 560.23 | 901.13 | 574.57 | 700.24 | 9 454.07 | 5 957.39 | 7 303.00 | |
| 合计 | 2 907.50 | 2 843.23 | 2 874.61 | 35.16 | 28.41 | 31.71 | 735.02 | 592.04 | 661.86 | |
| 俄罗斯 | 40~44 | 1 513.35 | 1 296.28 | 1 401.14 | 3.58 | 1.01 | 2.25 | 241.86 | 146.16 | 192.39 |
| 45~49 | 2 641.22 | 1 654.92 | 2 127.44 | 6.83 | 1.84 | 4.23 | 414.74 | 200.62 | 303.20 | |
| 50~54 | 4 233.51 | 2 110.07 | 3 100.57 | 15.38 | 3.38 | 8.98 | 774.83 | 279.58 | 510.59 | |
| 55~59 | 5 923.35 | 2 583.44 | 4 078.37 | 31.27 | 6.43 | 17.54 | 1 294.30 | 391.78 | 795.74 | |
| 60~64 | 7 932.33 | 3 079.26 | 5 124.01 | 69.06 | 12.19 | 36.15 | 2 292.20 | 552.76 | 1 285.64 | |
| 65~69 | 10 897.48 | 3 640.93 | 6 478.42 | 117.26 | 21.49 | 58.94 | 3 240.71 | 749.30 | 1 723.50 | |
| 70~74 | 14 119.31 | 4 426.32 | 7 947.03 | 204.56 | 40.27 | 99.94 | 4 542.26 | 1 062.50 | 2 326.43 | |
| 75~79 | 17 195.63 | 5 844.32 | 9 244.49 | 328.79 | 73.49 | 149.96 | 5 739.51 | 1 488.32 | 2 761.72 | |
| ≥80 | 21 669.61 | 10 539.63 | 13 367.53 | 513.42 | 188.55 | 271.09 | 6 031.97 | 2 425.04 | 3 341.49 | |
| 合计 | 3 312.11 | 2 115.32 | 2 672.54 | 34.35 | 16.61 | 24.87 | 836.59 | 394.05 | 600.09 | |
| 印度 | 40~44 | 1 621.36 | 1 637.83 | 1 629.38 | 6.31 | 3.70 | 5.04 | 521.48 | 393.69 | 459.26 |
| 45~49 | 3 001.61 | 3 044.66 | 3 022.60 | 16.18 | 8.67 | 12.52 | 1 092.70 | 766.11 | 933.48 | |
| 50~54 | 4 765.64 | 4 840.25 | 4 802.50 | 42.65 | 27.95 | 35.39 | 2 230.73 | 1 667.80 | 1 952.68 | |
| 55~59 | 6 440.56 | 6 584.27 | 6 512.70 | 97.18 | 53.40 | 75.21 | 4 014.27 | 2 575.81 | 3 292.22 | |
| 60~64 | 8 687.43 | 8 966.55 | 8 829.29 | 205.78 | 131.08 | 167.82 | 6 870.49 | 4 774.05 | 5 804.98 | |
| 65~69 | 13 047.93 | 13 704.15 | 13 383.22 | 390.77 | 247.26 | 317.45 | 10 807.34 | 7 461.86 | 9 097.99 | |
| 70~74 | 18 482.04 | 19 511.02 | 19 009.11 | 713.85 | 504.33 | 606.53 | 15 961.25 | 11 994.89 | 13 929.58 | |
| 75~79 | 24 280.39 | 25 803.50 | 25 090.58 | 1 181.26 | 818.66 | 988.38 | 20 816.40 | 15 397.99 | 17 934.19 | |
| ≥80 | 32 764.45 | 35 206.32 | 34 147.55 | 2 346.66 | 1 953.88 | 2 124.19 | 27 757.36 | 23 841.74 | 25 539.52 | |
| 合计 | 2 537.44 | 2 919.17 | 2 723.41 | 69.33 | 59.63 | 64.60 | 1 648.43 | 1 398.36 | 1 526.60 | |
| 中国 | 40~44 | 846.81 | 997.35 | 920.52 | 3.14 | 1.63 | 2.40 | 220.78 | 198.81 | 210.02 |
| 45~49 | 1 399.68 | 1 564.53 | 1 480.54 | 5.79 | 3.03 | 4.43 | 364.53 | 316.20 | 340.83 | |
| 50~54 | 2 441.83 | 2 627.83 | 2 534.40 | 13.54 | 6.64 | 10.10 | 713.78 | 559.22 | 636.86 | |
| 55~59 | 3 836.25 | 4 063.38 | 3 949.28 | 28.95 | 13.87 | 21.45 | 1 267.11 | 925.75 | 1 097.23 | |
| 60~64 | 5 743.86 | 6 128.27 | 5 935.16 | 67.35 | 33.77 | 50.64 | 2 361.60 | 1 644.62 | 2 004.81 | |
| 65~69 | 8 984.10 | 9 852.28 | 9 426.15 | 148.88 | 78.18 | 112.88 | 4 229.80 | 2 936.88 | 3 571.50 | |
| 70~74 | 13 518.18 | 15 026.18 | 14 291.09 | 391.65 | 208.58 | 297.82 | 8 598.37 | 5 645.13 | 7 084.72 | |
| 75~79 | 18 915.99 | 21 320.15 | 20 181.42 | 817.83 | 448.43 | 623.39 | 13 898.57 | 9 066.29 | 11 355.09 | |
| ≥80 | 25 239.30 | 30 901.68 | 28 698.43 | 2 395.19 | 1 429.67 | 1 805.36 | 26 234.08 | 16 591.04 | 20 343.18 | |
| 合计 | 2 768.81 | 3 597.85 | 3 175.37 | 82.25 | 63.27 | 72.94 | 1 523.84 | 1 272.75 | 1 400.71 | |
| 南非 | 40~44 | 1 479.83 | 1 411.38 | 1 445.68 | 4.79 | 1.56 | 3.18 | 396.32 | 290.43 | 343.50 |
| 45~49 | 2 576.99 | 2 131.53 | 2 345.11 | 8.34 | 3.58 | 5.86 | 648.40 | 475.45 | 558.37 | |
| 50~54 | 4 254.41 | 3 279.84 | 3 728.40 | 19.46 | 8.11 | 13.33 | 1 213.23 | 796.41 | 988.26 | |
| 55~59 | 6 009.64 | 4 559.31 | 5 205.52 | 44.04 | 19.10 | 30.21 | 2 114.84 | 1 301.81 | 1 664.07 | |
| 60~64 | 7 892.76 | 5 755.53 | 6 684.05 | 83.10 | 34.39 | 55.55 | 3 202.40 | 1 802.45 | 2 410.66 | |
| 65~69 | 10 662.56 | 6 903.73 | 8 506.13 | 163.65 | 69.28 | 109.51 | 5 012.95 | 2 612.10 | 3 635.59 | |
| 70~74 | 13 939.23 | 7 963.60 | 10 421.28 | 330.51 | 132.47 | 213.92 | 7 849.28 | 3 661.41 | 5 383.82 | |
| 75~79 | 17 799.30 | 9 229.55 | 12 453.51 | 463.74 | 189.30 | 292.54 | 8 907.96 | 4 134.17 | 5 930.08 | |
| ≥80 | 27 221.53 | 14 243.37 | 18 221.47 | 991.47 | 489.42 | 643.31 | 12 563.74 | 6 556.64 | 8 397.95 | |
| 合计 | 1 976.48 | 1 792.78 | 1 882.75 | 25.20 | 17.57 | 21.30 | 733.85 | 570.19 | 650.35 | |
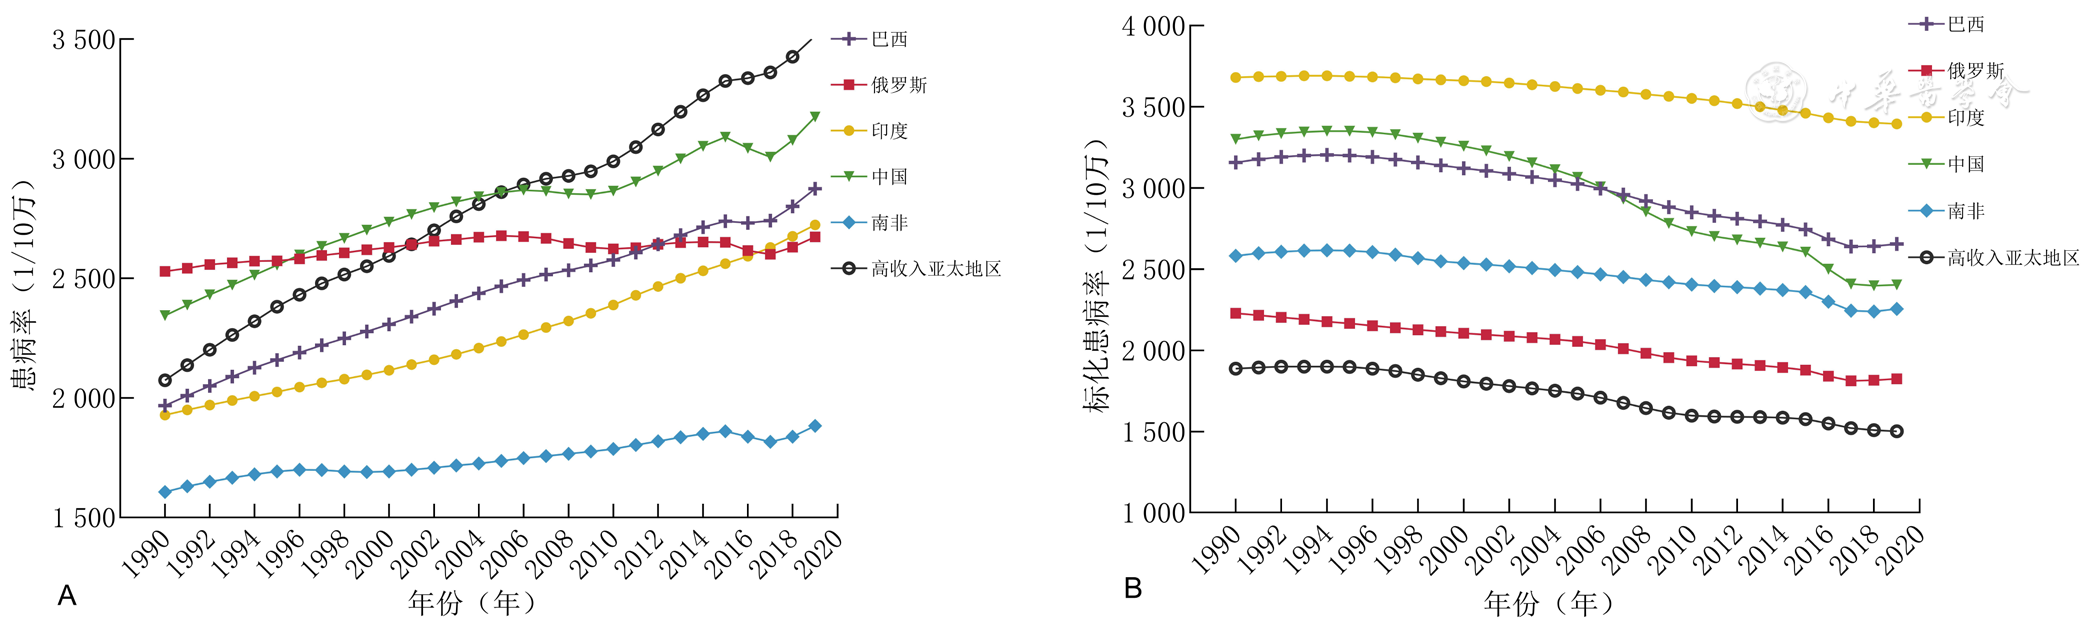
Figure 1 Trends in COPD prevalence and standardized prevalence in the BRICS countries from 1990 to 2019
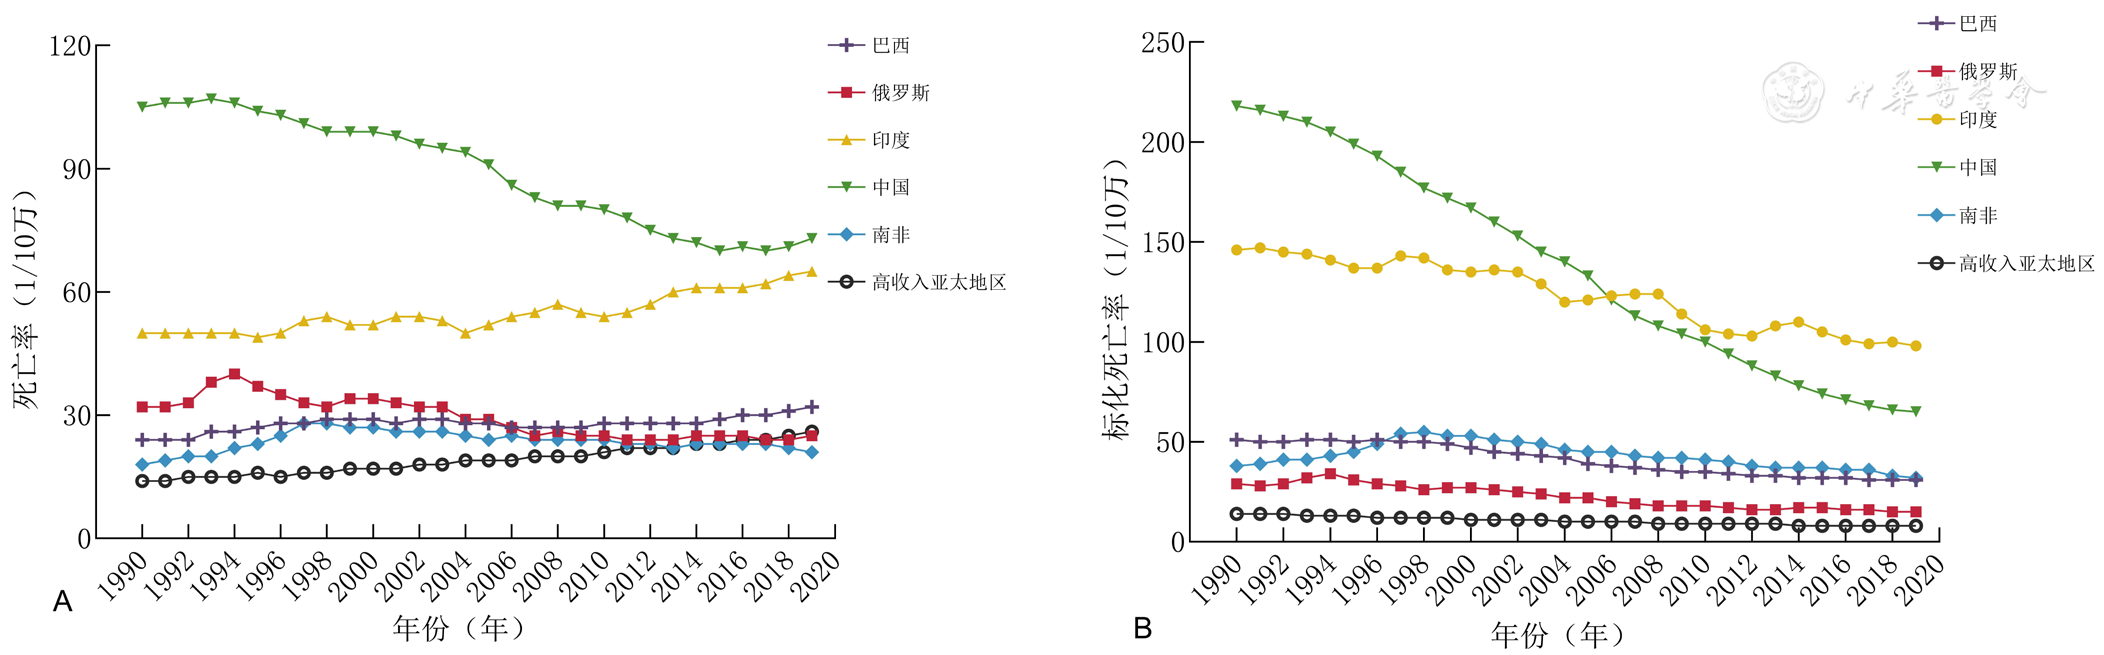
Figure 2 Trends in COPD mortality and standardized mortality in the BRICS countries from 1990 to 2019
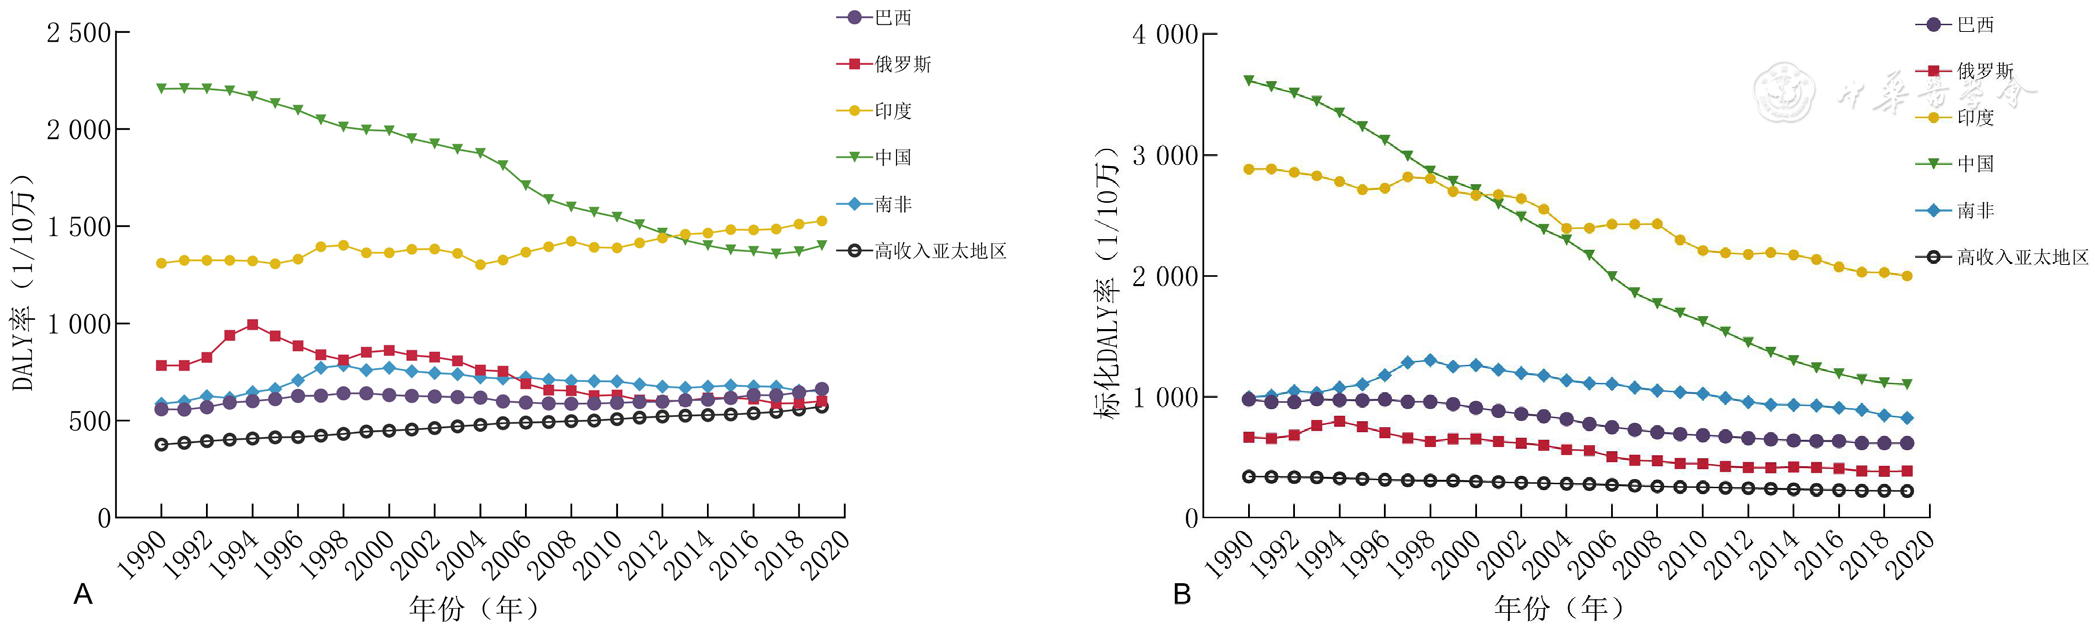
Figure 3 Trends of DALY rates and standardized DALY rates in the BRICS countries from 1990 to 2019
| 国家 | 指标量化指标 | 标化患病率 | 标化死亡率 | 标化DALY率 | ||||||
|---|---|---|---|---|---|---|---|---|---|---|
| 时期(年) | 变化值(95%CI)(%) | P值 | 时期(年) | 变化值(95%CI)(%) | P值 | 时期(年) | 变化值(95%CI)(%) | P值 | ||
| 巴西 | APC | 1990—1995 | 0.26(-0.05~0.58) | 0.097 | 1990—1998 | -0.02(-0.36~0.31) | 0.881 | 1990—1998 | 0.03(-0.24~0.31) | 0.806 |
| 1995—2003 | -0.54(-0.72~-0.36) | <0.001 | 1998—2009 | -3.31(-3.56~-3.06) | <0.001 | 1998—2009 | -3.08(-3.28~-2.88) | <0.001 | ||
| 2003—2019 | 0.99(-1.04~-0.93) | <0.001 | 2009—2019 | -1.33(-1.66~-0.99) | <0.001 | 2009—2019 | -1.20(-1.45~-0.95) | <0.001 | ||
| AAPC | 1990—2019 | -0.65(-0.72~-0.57) | <0.001 | 1990—2019 | -1.73(-1.89~-1.56) | <0.001 | 1990—2019 | -1.58(-1.71~-1.45) | <0.001 | |
| 俄罗斯 | APC | 1990—2006 | -0.54(-0.59~-0.49) | <0.001 | 1990—1994 | 4.71(-0.94~10.69) | 0.099 | 1990—1994 | 4.96(-0.05~10.21) | 0.052 |
| 2006—2009 | -1.37(-2.60~-0.12) | 0.033 | 1994—2011 | -3.84(-4.32~-3.36) | <0.001 | 1994—2012 | -3.36(-3.76~-2.95) | <0.001 | ||
| 2009—2019 | -0.79(-0.89~-0.68) | <0.001 | 2011—2019 | -1.15(-3.08~0.82) | 0.236 | 2012—2019 | -1.23(-3.38~0.97) | 0.258 | ||
| AAPC | 1990—2019 | -0.71(-0.84~-0.58) | <0.001 | 1990—2019 | -1.96(-2.87~-1.05) | <0.001 | 1990—2019 | -1.74(-2.57~-0.90) | <0.001 | |
| 印度 | APC | 1990—1997 | 0.01(-0.04~0.06) | 0.700 | 1990—2007 | -1.08(-1.38~-0.78) | <0.001 | 1990—2001 | -0.63(-1.01~-0.25) | 0.002 |
| 1997—2009 | -0.26(-0.29~-0.24) | <0.001 | 2007—2010 | -4.50(-12.06~3.71) | 0.260 | 2001—2004 | -2.81(-7.63~2.26) | 0.258 | ||
| 2009—2019 | -0.54(-0.58~-0.50) | <0.001 | 2010—2019 | -0.89(-1.74~-0.02) | 0.045 | 2004—2019 | -1.39(-1.62~-1.16) | <0.001 | ||
| AAPC | 1990—2019 | -0.29(-0.31~-0.27) | <0.001 | 1990—2019 | -1.38(-2.23~-0.53) | 0.002 | 1990—2019 | -1.25(-1.77~-0.73) | <0.001 | |
| 中国 | APC | 1990—1996 | 0.22(-0.17~0.61) | 0.261 | 1990—2001 | -2.96(-3.36~-2.56) | <0.001 | 1990—2002 | -3.28(-3.61~-2.94) | <0.001 |
| 1996—2002 | -0.78(-1.33~-0.23) | 0.008 | 2001—2016 | -5.44(-5.65~-5.23) | <0.001 | 2002—2015 | -5.41(-5.62~-5.19) | <0.001 | ||
| 2002—2019 | -1.75(-1.86~-1.64) | <0.001 | 2016—2019 | -2.63(-5.88~0.72) | 0.117 | 2015—2019 | -2.77(-4.51~-0.99) | 0.004 | ||
| AAPC | 1990—2019 | -1.14(-1.29~-1.00) | <0.001 | 1990—2019 | -4.22(-4.58~-3.85) | <0.001 | 1990—2019 | -4.17(-4.44~-3.89) | <0.001 | |
| 南非 | APC | 1990—1994 | 0.37(-0.12~0.87) | 0.134 | 1990—1994 | 2.38(-0.51~5.35) | 0.103 | 1990—1994 | 1.75(-0.03~3.55) | 0.053 |
| 1994—2014 | -0.52(-0.57~-0.48) | <0.001 | 1994—1997 | 9.89(2.75~17.52) | 0.008 | 1994—1998 | 5.04(2.85~7.28) | <0.001 | ||
| 2014—2019 | -1.19(-1.54~-0.85) | <0.001 | 1997—2019 | -2.37(-2.48~-2.25) | <0.001 | 1998—2019 | -2.07(-2.15~-1.98) | <0.001 | ||
| AAPC | 1990—2019 | -0.52(-0.61~-0.43) | <0.001 | 1990—2019 | -0.52(-1.27~0.24) | 0.183 | 1990—2019 | -0.59(-0.95~-0.23) | 0.001 | |
Table 2 Joinpoint analysis of trends in COPD disease burden in the BRICS countries from 1990 to 2019
| 国家 | 指标量化指标 | 标化患病率 | 标化死亡率 | 标化DALY率 | ||||||
|---|---|---|---|---|---|---|---|---|---|---|
| 时期(年) | 变化值(95%CI)(%) | P值 | 时期(年) | 变化值(95%CI)(%) | P值 | 时期(年) | 变化值(95%CI)(%) | P值 | ||
| 巴西 | APC | 1990—1995 | 0.26(-0.05~0.58) | 0.097 | 1990—1998 | -0.02(-0.36~0.31) | 0.881 | 1990—1998 | 0.03(-0.24~0.31) | 0.806 |
| 1995—2003 | -0.54(-0.72~-0.36) | <0.001 | 1998—2009 | -3.31(-3.56~-3.06) | <0.001 | 1998—2009 | -3.08(-3.28~-2.88) | <0.001 | ||
| 2003—2019 | 0.99(-1.04~-0.93) | <0.001 | 2009—2019 | -1.33(-1.66~-0.99) | <0.001 | 2009—2019 | -1.20(-1.45~-0.95) | <0.001 | ||
| AAPC | 1990—2019 | -0.65(-0.72~-0.57) | <0.001 | 1990—2019 | -1.73(-1.89~-1.56) | <0.001 | 1990—2019 | -1.58(-1.71~-1.45) | <0.001 | |
| 俄罗斯 | APC | 1990—2006 | -0.54(-0.59~-0.49) | <0.001 | 1990—1994 | 4.71(-0.94~10.69) | 0.099 | 1990—1994 | 4.96(-0.05~10.21) | 0.052 |
| 2006—2009 | -1.37(-2.60~-0.12) | 0.033 | 1994—2011 | -3.84(-4.32~-3.36) | <0.001 | 1994—2012 | -3.36(-3.76~-2.95) | <0.001 | ||
| 2009—2019 | -0.79(-0.89~-0.68) | <0.001 | 2011—2019 | -1.15(-3.08~0.82) | 0.236 | 2012—2019 | -1.23(-3.38~0.97) | 0.258 | ||
| AAPC | 1990—2019 | -0.71(-0.84~-0.58) | <0.001 | 1990—2019 | -1.96(-2.87~-1.05) | <0.001 | 1990—2019 | -1.74(-2.57~-0.90) | <0.001 | |
| 印度 | APC | 1990—1997 | 0.01(-0.04~0.06) | 0.700 | 1990—2007 | -1.08(-1.38~-0.78) | <0.001 | 1990—2001 | -0.63(-1.01~-0.25) | 0.002 |
| 1997—2009 | -0.26(-0.29~-0.24) | <0.001 | 2007—2010 | -4.50(-12.06~3.71) | 0.260 | 2001—2004 | -2.81(-7.63~2.26) | 0.258 | ||
| 2009—2019 | -0.54(-0.58~-0.50) | <0.001 | 2010—2019 | -0.89(-1.74~-0.02) | 0.045 | 2004—2019 | -1.39(-1.62~-1.16) | <0.001 | ||
| AAPC | 1990—2019 | -0.29(-0.31~-0.27) | <0.001 | 1990—2019 | -1.38(-2.23~-0.53) | 0.002 | 1990—2019 | -1.25(-1.77~-0.73) | <0.001 | |
| 中国 | APC | 1990—1996 | 0.22(-0.17~0.61) | 0.261 | 1990—2001 | -2.96(-3.36~-2.56) | <0.001 | 1990—2002 | -3.28(-3.61~-2.94) | <0.001 |
| 1996—2002 | -0.78(-1.33~-0.23) | 0.008 | 2001—2016 | -5.44(-5.65~-5.23) | <0.001 | 2002—2015 | -5.41(-5.62~-5.19) | <0.001 | ||
| 2002—2019 | -1.75(-1.86~-1.64) | <0.001 | 2016—2019 | -2.63(-5.88~0.72) | 0.117 | 2015—2019 | -2.77(-4.51~-0.99) | 0.004 | ||
| AAPC | 1990—2019 | -1.14(-1.29~-1.00) | <0.001 | 1990—2019 | -4.22(-4.58~-3.85) | <0.001 | 1990—2019 | -4.17(-4.44~-3.89) | <0.001 | |
| 南非 | APC | 1990—1994 | 0.37(-0.12~0.87) | 0.134 | 1990—1994 | 2.38(-0.51~5.35) | 0.103 | 1990—1994 | 1.75(-0.03~3.55) | 0.053 |
| 1994—2014 | -0.52(-0.57~-0.48) | <0.001 | 1994—1997 | 9.89(2.75~17.52) | 0.008 | 1994—1998 | 5.04(2.85~7.28) | <0.001 | ||
| 2014—2019 | -1.19(-1.54~-0.85) | <0.001 | 1997—2019 | -2.37(-2.48~-2.25) | <0.001 | 1998—2019 | -2.07(-2.15~-1.98) | <0.001 | ||
| AAPC | 1990—2019 | -0.52(-0.61~-0.43) | <0.001 | 1990—2019 | -0.52(-1.27~0.24) | 0.183 | 1990—2019 | -0.59(-0.95~-0.23) | 0.001 | |
| 因素 | 巴西PAF(%) | 俄罗斯PAF(%) | 印度PAF(%) | 中国PAF(%) | 南非PAF(%) | ||||||||||
|---|---|---|---|---|---|---|---|---|---|---|---|---|---|---|---|
| 1990年 | 2019年 | 年均增长率 | 1990年 | 2019年 | 年均增长率 | 1990年 | 2019年 | 年均增长率 | 1990年 | 2019年 | 年均增长率 | 1990年 | 2019年 | 年均增长率 | |
| 空气污染 | 26.56 | 13.73 | -2.18 | 19.10 | 9.86 | -2.18 | 70.60 | 57.07 | -0.71 | 58.74 | 37.50 | -1.48 | 31.10 | 22.83 | -1.02 |
| 烟草使用 | 66.13 | 52.46 | -0.77 | 56.63 | 59.60 | 0.17 | 48.78 | 44.24 | -0.33 | 54.48 | 57.45 | 0.18 | 56.41 | 45.54 | -0.71 |
| 职业危险因素 | 13.48 | 12.32 | -0.30 | 12.12 | 11.19 | -0.27 | 16.91 | 16.07 | -0.17 | 20.12 | 19.96 | -0.03 | 11.08 | 10.50 | -0.18 |
| 非最佳温度 | 3.62 | 2.89 | -0.75 | 16.82 | 14.53 | -0.49 | 2.95 | 4.31 | 1.27 | 15.71 | 13.38 | -0.53 | 9.39 | 8.11 | -0.49 |
Table 3 Trends in PAF for chronic obstructive pulmonary disease risk factors from 1990 to 2019
| 因素 | 巴西PAF(%) | 俄罗斯PAF(%) | 印度PAF(%) | 中国PAF(%) | 南非PAF(%) | ||||||||||
|---|---|---|---|---|---|---|---|---|---|---|---|---|---|---|---|
| 1990年 | 2019年 | 年均增长率 | 1990年 | 2019年 | 年均增长率 | 1990年 | 2019年 | 年均增长率 | 1990年 | 2019年 | 年均增长率 | 1990年 | 2019年 | 年均增长率 | |
| 空气污染 | 26.56 | 13.73 | -2.18 | 19.10 | 9.86 | -2.18 | 70.60 | 57.07 | -0.71 | 58.74 | 37.50 | -1.48 | 31.10 | 22.83 | -1.02 |
| 烟草使用 | 66.13 | 52.46 | -0.77 | 56.63 | 59.60 | 0.17 | 48.78 | 44.24 | -0.33 | 54.48 | 57.45 | 0.18 | 56.41 | 45.54 | -0.71 |
| 职业危险因素 | 13.48 | 12.32 | -0.30 | 12.12 | 11.19 | -0.27 | 16.91 | 16.07 | -0.17 | 20.12 | 19.96 | -0.03 | 11.08 | 10.50 | -0.18 |
| 非最佳温度 | 3.62 | 2.89 | -0.75 | 16.82 | 14.53 | -0.49 | 2.95 | 4.31 | 1.27 | 15.71 | 13.38 | -0.53 | 9.39 | 8.11 | -0.49 |
| [1] |
|
| [2] |
GBD Chronic Respiratory Disease Collaborators. Prevalence and attributable health burden of chronic respiratory diseases,1990-2017:a systematic analysis for the Global Burden of Disease Study 2017[J]. Lancet Respir Med,2020,8(6):585-596. DOI:10.1016/S2213-2600(20)30105-3.
|
| [3] |
GBD Causes of Death Collaborators. Global,regional,and national age-sex-specific mortality for 282 causes of death in 195 countries and territories,1980-2017:a systematic analysis for the Global Burden of Disease Study 2017[J]. Lancet,2018,392(10159):1736-1788. DOI:10.1016/S0140-6736(18)32203-7.
|
| [4] |
屈彦,王天一,杨津,等. GBD数据库的数据提取方法与流程[J]. 中国循证心血管医学杂志,2019,11(9):1043-1046. DOI:10.3969/j.issn.1674-4055.2019.09.04.
|
| [5] |
|
| [6] |
秦国双,温昊于,宇传华. 中国COPD的患病发病及YLD现状及趋势[J]. 公共卫生与预防医学,2019,30(2):4-8. DOI:10.3969/j.issn.1006-2483.2019.02.002.
|
| [7] |
殷鹏,蔡玥,刘江美,等. 1990与2013年中国归因于室内空气污染的疾病负担分析[J]. 中华预防医学杂志,2017,51(1):53-57.
|
| [8] |
龙政,刘威,王黎君,等. "一带一路"沿线主要国家2009年与2019年居民期望寿命及死亡状况比较[J]. 中国公共卫生,2022,38(8):1048-1053. DOI:10.11847/zgggws1136718.
|
| [9] |
陶凤然,樊娜,蒋云雯,等. 1997—2017年中国人群慢性阻塞性肺病疾病负担趋势分析[J]. 中国慢性病预防与控制,2020,28(1):3-9. DOI:10.16386/j.cjpccd.issn.1004-6194.2020.01.002.
|
| [10] |
|
| [11] |
|
| [12] |
India State-level Disease Burden Initiative Crd Collaborators. The burden of chronic respiratory diseases and their heterogeneity across the states of India:the Global Burden of Disease Study 1990-2016[J]. Lancet Glob Health,2018,6(12):e1363-1374. DOI:10.1016/S2214-109X(18)30409-1.
|
| [13] |
中华医学会呼吸病学分会慢性阻塞性肺疾病学组,中国医师协会呼吸医师分会慢性阻塞性肺疾病工作委员会. 慢性阻塞性肺疾病诊治指南(2021年修订版)[J]. 中华结核和呼吸杂志,2021,44(3):36. DOI:10.3760/cma.j.cn112147-20210109-00031.
|
| [14] |
刘贤兵,李芳,徐宁,等. 戒烟干预对早期稳定期慢性阻塞性肺疾病患者气道局部免疫及生活质量的影响研究[J]. 中国全科医学,2021,24(23):2927-2939. DOI:10.12114/j.issn.1007-9572.2021.00.576.
|
| [15] |
|
| [16] |
董彭滔. 积极应对人口老龄化——"金砖四国"举措及借鉴[J]. 现代管理科学,2019(3):45-47.
|
| [17] |
邓子如,王伟,郭敏璐,等. 金砖国家卫生外交政策及其参与全球卫生治理的经验[J]. 中国卫生政策研究,2020,13(8):50-57. DOI:10.3969/j.issn.1674-2982.2020.08.008.
|
| [1] | AN Yanhong, WANG Shidong, LI Xiaoran, GUO Jiayang, WANG Zhe, SHA Peilin, MENG Yijun, LI Xiaoxuan, SHI Xue, YU Zexing, XIAO Yonghua. Study on Risk Factors and Nomogram Prediction Model for Diabetic Kidney Disease: Based on Contrast-enhanced Ultrasound Technology [J]. Chinese General Practice, 2026, 29(21): 2995-3003. |
| [2] | SONG Zhenzhen, CHEN Yang, WANG Jiwen, LIU Huishan, SHEN Simeng, SUN Ying, CHEN Xing. Study of Maternal Risk Factors Associated with Neonatal Asphyxia in Late Preterm and Term Infants [J]. Chinese General Practice, 2026, 29(20): 2874-2878. |
| [3] | YANG Xiaofeng, LI Xianwen, WU Yanfeng, ZHANG Qian, CHEN Juan, ZHAO Fengjiao. Association of Serum Vascular Endothelial Cadherin Levels with the Risk of Post-stroke Cognitive Impairment in Patients with Acute Ischemic Stroke [J]. Chinese General Practice, 2026, 29(20): 2867-2873. |
| [4] | ZHAO Huili, LU Lina, ZHUO Ya, WANG Xin. Clinical Characteristics and Risk Factors for Recurrence of Cryptogenic Organizing Pneumonia [J]. Chinese General Practice, 2026, 29(19): 2648-2655. |
| [5] | TANG Lijuan, QI Qi, ZHANG Fan, GAO Yifu, CAO Yajing, YUE Fujuan, GAO Jinchai, LIU Xiaoli. Characterisation of the Prevalence of Overweight/Obesity among Residents Aged 18-44 Years in Hebei Province in 2013 and 2020 [J]. Chinese General Practice, 2026, 29(19): 2695-2704. |
| [6] | YUAN Yujuan, TAO Jing, WANG Ying, PENG Hui, YANG Yining. Elevated Neutrophil Percentage to Albumin Ratio is Associated with In-hospital Outcomes in Patients with Acute Myocardial Infarction [J]. Chinese General Practice, 2026, 29(18): 2489-2497. |
| [7] | YU Shan, CHE Yajie, SUBIYINUER· Maimaiti, GUO Kaiyang, FENG Xingxing, YAN Ping. A Comparative Study on the Current Situation and Influencing Factors of Subjective Cognitive Decline among Urban and Rural Elderly People in Xinjiang [J]. Chinese General Practice, 2026, 29(16): 2227-2233. |
| [8] | ZHEN Rui, GU Xufang, GAO Shengwei, ZHANG Bowen, REN Zhenjuan, YANG Ruixuan. Burden of Cardiovascular Diseases Attributable to Metabolic Risk Factors in China 1990—2021 and Projected Trends from 2022 to 2035 [J]. Chinese General Practice, 2026, 29(15): 2077-2083. |
| [9] | LI Jiali, LIU Fan, KE Lixin, LI Huijuan, WANG Haibo, ZHAO Xiaoxiao, ZHAO Xinke, LU Cuncun. Disease Burden of Obesity among Individuals Aged 60 and above Globally and in China from 1990 to 2021: Trend Analysis and Model-based Projection [J]. Chinese General Practice, 2026, 29(15): 2067-2076. |
| [10] | QIU Yanli, GAO Yongyin, BIAN Xueyan, WANG Xue, LI Yue. The Predictive Value of Estimated Pulse Wave Velocity for All-cause and Cardiovascular-related Mortality in Cancer Patients [J]. Chinese General Practice, 2026, 29(14): 1890-1897. |
| [11] | HU Jiaqi, LI Duan, FANG Hao, FAN Xingying, DU Wei, ZHOU Hanni. Study on Predictive Model of Non-genetic Risk Factors for Hyperuricemia in a Physical Examination Cohort [J]. Chinese General Practice, 2026, 29(10): 1324-1333. |
| [12] | LEI Yingying, ZHENG Siying, WANG Wenxin, JIANG Hong. Prevalence Trend and Prediction of Hypertensive Heart Disease in the World and China from 1990 to 2021 [J]. Chinese General Practice, 2026, 29(05): 641-648. |
| [13] | ZHAO Xuejiao, LI Juan, LI Yujie, LU Ting, Xian Lihong, YAN Huan. Prevalence Trends and Influencing Factors for Post-stroke Cognitive Impairment in China: a Meta-analysis [J]. Chinese General Practice, 2026, 29(03): 380-392. |
| [14] | YANG Qinghui, HU Yingxue, NI Pingwei, LIU Xiao. Analysis of the Incidence and Mortality Trends of Lung Cancer in China from 1990 to 2021 and Prediction for 2035 [J]. Chinese General Practice, 2026, 29(02): 256-263. |
| [15] | CHEN Xueqin, WANG Shihong, LAI Fengxia, ZHANG Jingjing, CHEN Hao, KONG Danli, DING Yuanlin. Study on Trend Analysis and Forecast of Incidence, Disease and Mortality of Chronic Obstructive Pulmonary Disease in China, 1990-2021 [J]. Chinese General Practice, 2026, 29(02): 264-272. |
| Viewed | ||||||
|
Full text |
|
|||||
|
Abstract |
|
|||||