
Chinese General Practice ›› 2023, Vol. 26 ›› Issue (35): 4425-4432.DOI: 10.12114/j.issn.1007-9572.2023.0260
• Article • Previous Articles Next Articles
Received:2023-03-28
Revised:2023-07-06
Published:2023-12-15
Online:2023-07-27
Contact:
SHI Sen
通讯作者:
施森
作者简介:基金资助:
Add to citation manager EndNote|Ris|BibTeX
URL: https://www.chinagp.net/EN/10.12114/j.issn.1007-9572.2023.0260
| 地区 | 性别 | 患病人数 | 粗患病率 | 年龄标化患病率 | ||||||
|---|---|---|---|---|---|---|---|---|---|---|
| 1990年(95%UI)(×10万) | 2019年(95%UI)(×10万) | 变化率(%) | 1990年(95%UI)(1/10万) | 2019年(95%UI)(1/10万) | 变化率(%) | 1990年(95%UI)(1/10万) | 2019年(95%UI)(1/10万) | 变化率(%) | ||
| 中国 | 男性 | 28.22(24.03,32.53) | 71.74(61.29,82.49) | 154.22 | 462.40(393.73,533.09) | 989.79(845.60,1 138.07) | 114.05 | 731.02(631.44,836.51) | 744.96(644.62,850.82) | 1.91 |
| 女性 | 75.78(65.04,86.78) | 213.15(183.34,244.52) | 181.27 | 1 321.44(1 134.16,1 513.18) | 3 055.85(2 628.40,3 505.48) | 131.25 | 1 839.43(1 593.06,2 095.46) | 2 022.13(1 750.00,2 309.13) | 9.93 | |
| 日本 | 女性 | 30.72(26.73,34.70) | 37.26(32.11,42.65) | 21.29 | 4 801.14(4 177.38,5 422.56) | 5 686.97(4 901.04,6 509.51) | 18.45 | 3 182.64(2 782.59,3 587.70) | 1 846.52(1 606.47,2 091.10) | -41.98 |
| 韩国 | 女性 | 3.88(3.34,4.42) | 7.53(6.51,8.61) | 94.07 | 1 756.55(1 512.74,2 001.33) | 2 850.98(2 466.53,3 260.43) | 62.31 | 2 409.29(2 083.25,2 739.95) | 1 519.64(1 314.65,1 737.66) | -36.93 |
| 印度 | 女性 | 21.43(18.33,24.63) | 61.15(52.96,70.11) | 185.35 | 522.29(446.86,600.39) | 902.56(781.69,1 034.75) | 72.81 | 1 135.33(985.40,1 300.95) | 1 105.89(959.02,1 261.32) | -2.59 |
| 全球 | 女性 | 447.95(390.62,507.73) | 760.93(665.87,861.71) | 69.87 | 1 686.50(1 470.66,1 911.55) | 1 973.12(1 726.63,2 234.45) | 16.99 | 2 181.02(1 905.72,2 471.79) | 1 735.06(1 519.05,1 964.04) | -20.45 |
Table 1 Prevalence of PAD among Chinese men and women in China,Japan,Korea,India and globally in 1990 and 2019
| 地区 | 性别 | 患病人数 | 粗患病率 | 年龄标化患病率 | ||||||
|---|---|---|---|---|---|---|---|---|---|---|
| 1990年(95%UI)(×10万) | 2019年(95%UI)(×10万) | 变化率(%) | 1990年(95%UI)(1/10万) | 2019年(95%UI)(1/10万) | 变化率(%) | 1990年(95%UI)(1/10万) | 2019年(95%UI)(1/10万) | 变化率(%) | ||
| 中国 | 男性 | 28.22(24.03,32.53) | 71.74(61.29,82.49) | 154.22 | 462.40(393.73,533.09) | 989.79(845.60,1 138.07) | 114.05 | 731.02(631.44,836.51) | 744.96(644.62,850.82) | 1.91 |
| 女性 | 75.78(65.04,86.78) | 213.15(183.34,244.52) | 181.27 | 1 321.44(1 134.16,1 513.18) | 3 055.85(2 628.40,3 505.48) | 131.25 | 1 839.43(1 593.06,2 095.46) | 2 022.13(1 750.00,2 309.13) | 9.93 | |
| 日本 | 女性 | 30.72(26.73,34.70) | 37.26(32.11,42.65) | 21.29 | 4 801.14(4 177.38,5 422.56) | 5 686.97(4 901.04,6 509.51) | 18.45 | 3 182.64(2 782.59,3 587.70) | 1 846.52(1 606.47,2 091.10) | -41.98 |
| 韩国 | 女性 | 3.88(3.34,4.42) | 7.53(6.51,8.61) | 94.07 | 1 756.55(1 512.74,2 001.33) | 2 850.98(2 466.53,3 260.43) | 62.31 | 2 409.29(2 083.25,2 739.95) | 1 519.64(1 314.65,1 737.66) | -36.93 |
| 印度 | 女性 | 21.43(18.33,24.63) | 61.15(52.96,70.11) | 185.35 | 522.29(446.86,600.39) | 902.56(781.69,1 034.75) | 72.81 | 1 135.33(985.40,1 300.95) | 1 105.89(959.02,1 261.32) | -2.59 |
| 全球 | 女性 | 447.95(390.62,507.73) | 760.93(665.87,861.71) | 69.87 | 1 686.50(1 470.66,1 911.55) | 1 973.12(1 726.63,2 234.45) | 16.99 | 2 181.02(1 905.72,2 471.79) | 1 735.06(1 519.05,1 964.04) | -20.45 |
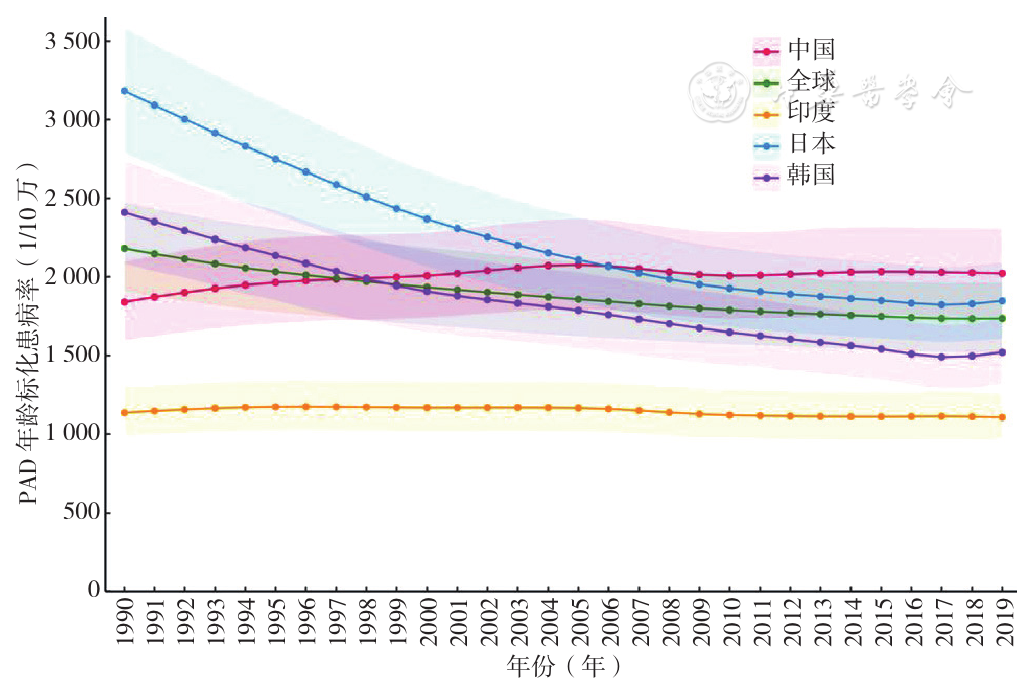
Figure 1 Trends in the age-standardized prevalence of PAD in women from 1990 to 2019 in globally,China,India,Japan,and Korea
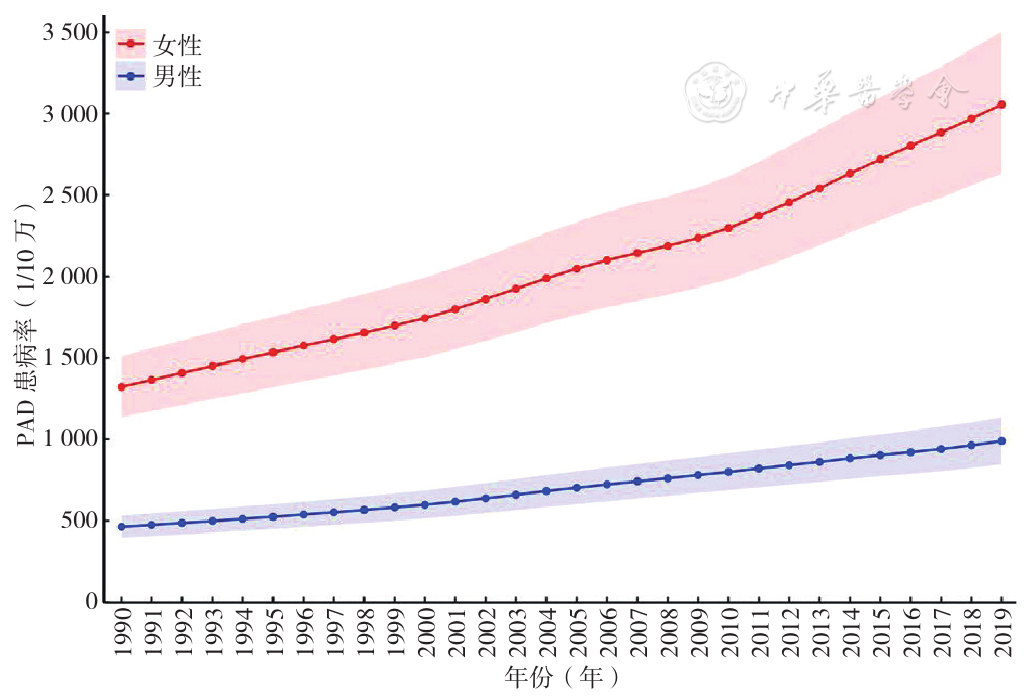
Figure 2 Gender prevalence of PAD in China from 1990 to 2019
| 项目 | 性别 | 趋势1 | 趋势2 | 趋势3 | AAPC(95%CI) | |||
|---|---|---|---|---|---|---|---|---|
| 年份 | APC(95%CI) | 年份 | APC(95%CI) | 年份 | APC(95%CI) | |||
| 粗患病率 | 男性 | 1990—1999年 | 2.58(2.52,2.65)a | 1999—2007年 | 3.17(3.07,3.26)a | 2007—2019年 | 2.39(2.34,2.43)a | 2.66(2.63,2.70)a |
| 女性 | 1990—2006年 | 2.90(2.84,2.96)a | 2006—2009年 | 2.21(0.67,3.77)a | 2009—2019年 | 3.24(3.11,3.36)a | 2.94(2.78,3.10)a | |
| 年龄标化患病率 | 男性 | 1990—1993年 | 0.91(0.68,1.14)a | 1993—2005年 | 0.49(0.46,0.52)a | 2005—2019年 | -0.50(-0.52,-0.48)a | 0.05(0.03,0.08)a |
| 女性 | 1990—2005年 | 0.73(0.65,0.81)a | 2005—2009年 | -0.93(-1.87,0.03) | 2009—2019年 | 0.10(-0.05,0.25) | 0.28(0.14,0.42)a | |
Table 2 Temporal changes of PAD prevalence and age-standardized prevalence in China from 1990 to 2019
| 项目 | 性别 | 趋势1 | 趋势2 | 趋势3 | AAPC(95%CI) | |||
|---|---|---|---|---|---|---|---|---|
| 年份 | APC(95%CI) | 年份 | APC(95%CI) | 年份 | APC(95%CI) | |||
| 粗患病率 | 男性 | 1990—1999年 | 2.58(2.52,2.65)a | 1999—2007年 | 3.17(3.07,3.26)a | 2007—2019年 | 2.39(2.34,2.43)a | 2.66(2.63,2.70)a |
| 女性 | 1990—2006年 | 2.90(2.84,2.96)a | 2006—2009年 | 2.21(0.67,3.77)a | 2009—2019年 | 3.24(3.11,3.36)a | 2.94(2.78,3.10)a | |
| 年龄标化患病率 | 男性 | 1990—1993年 | 0.91(0.68,1.14)a | 1993—2005年 | 0.49(0.46,0.52)a | 2005—2019年 | -0.50(-0.52,-0.48)a | 0.05(0.03,0.08)a |
| 女性 | 1990—2005年 | 0.73(0.65,0.81)a | 2005—2009年 | -0.93(-1.87,0.03) | 2009—2019年 | 0.10(-0.05,0.25) | 0.28(0.14,0.42)a | |
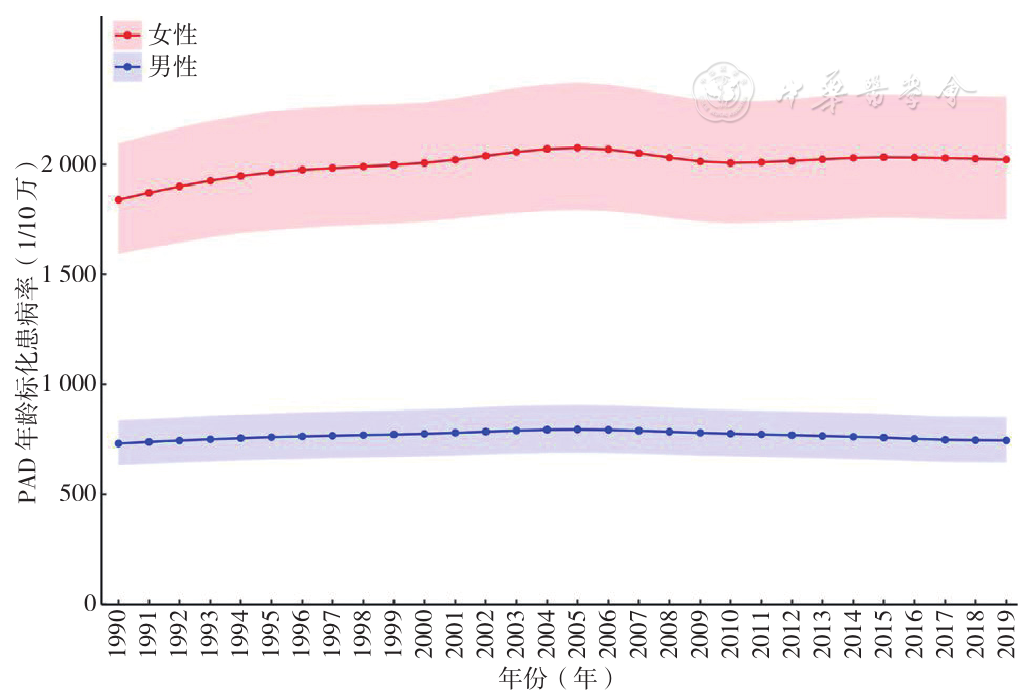
Figure 3 Gender and age standardized prevalence of PAD in China from 1990 to 2019
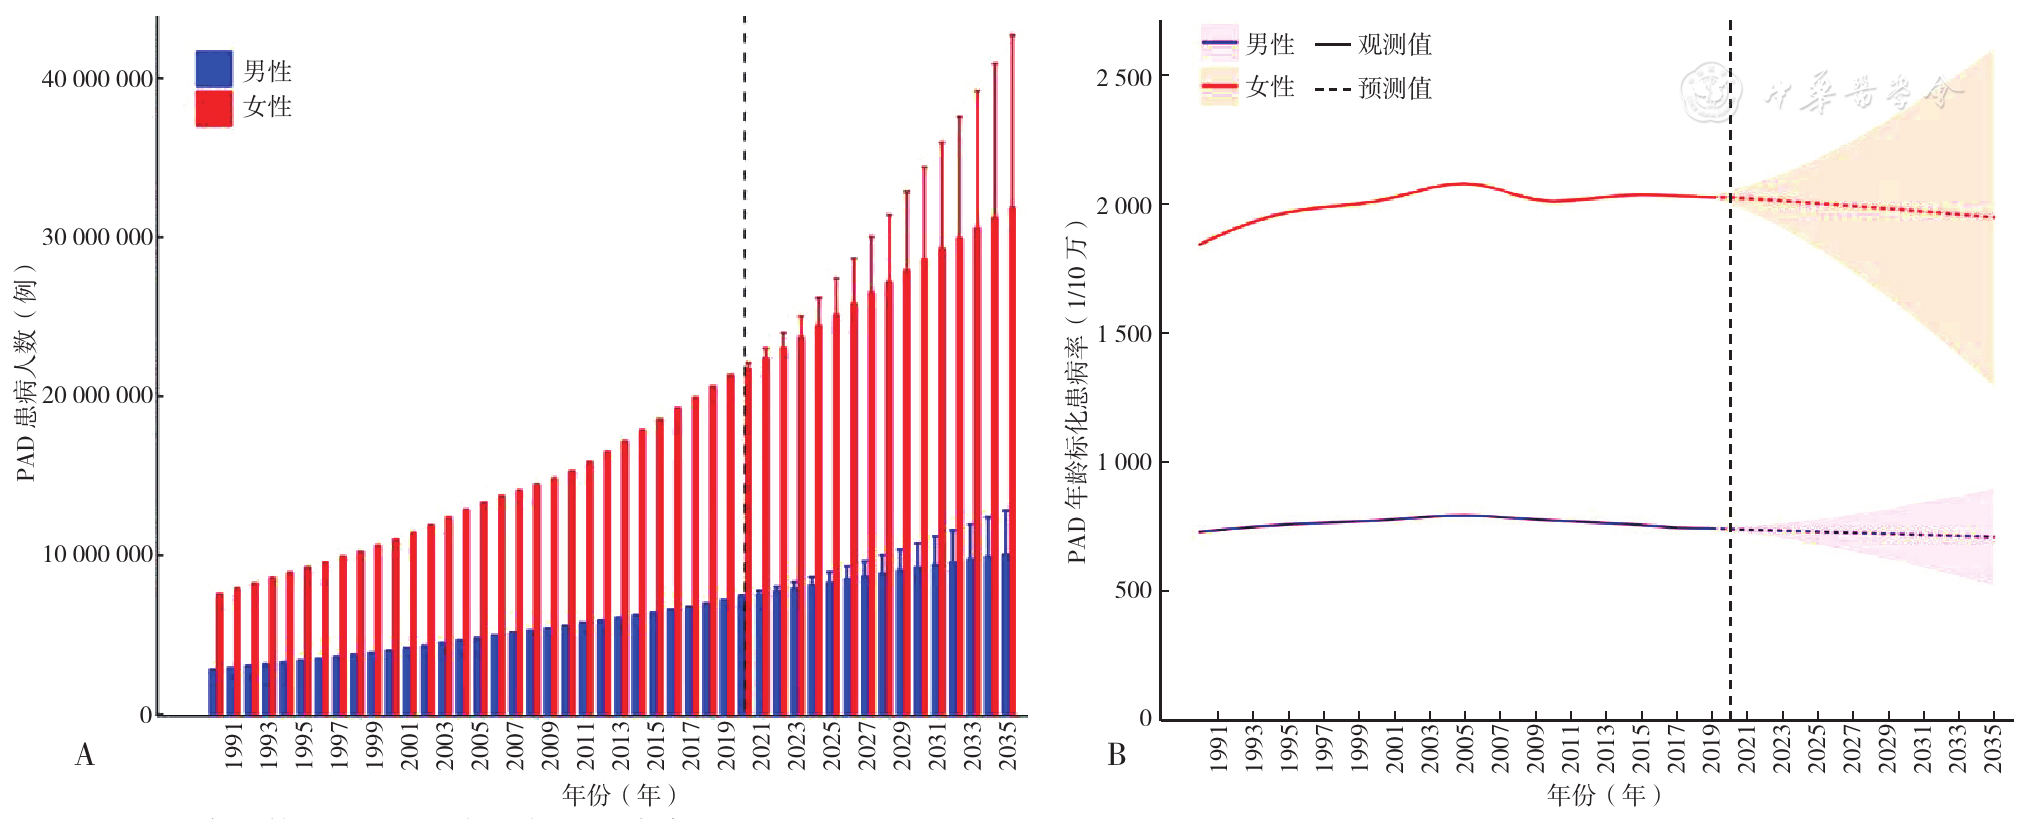
Figure 4 Prediction of the changing trend of the number cases and age-standardized prevalence of PAD by gender in China from 2020 to 2035
| 分层 | 患病人数 | 年龄标化患病率/年龄分层患病率 | ||||
|---|---|---|---|---|---|---|
| 2019年(×10万) | 2035年(×10万) | 变化率(%) | 2019年(1/10万) | 2035年(1/10万) | 变化率(%) | |
| 男性 | 71.74(61.29,82.49) | 101.30(74.17,128.43) | 41.20 | 744.96(644.62,850.82) | 712.09(521.26,902.92) | -4.41 |
| 女性 | 213.15(183.34,244.52) | 319.24(211.74,426.74) | 49.77 | 2 022.13(1 750.00,2 309.13) | 1 945.97(1 290.41,2 601.54) | -3.77 |
| 年龄 | ||||||
| 40~44岁 | 3.53(2.63,4.53) | 3.44(2.03,4.86) | -2.55 | 709.33(528.11,909.28) | 685.46(451.91,997.17) | -3.37 |
| 45~49岁 | 10.28(8.00,13.02) | 10.23(6.48,13.98) | -0.49 | 1 727.05(1 343.83,2 186.38) | 1 669.34(1 141.36,2 356.88) | -3.34 |
| 50~54岁 | 20.45(15.47,26.47) | 16.84(10.99,22.68) | -17.65 | 3 283.85(2 484.01,4 250.95) | 3 176.14(2 211.35,4 416.94) | -3.28 |
| 55~59岁 | 24.22(18.92,29.50) | 23.60(15.55,31.65) | -2.56 | 5 130.90(4 009.67,6 250.79) | 4 954.32(3 467.83,6 858.72) | -3.44 |
| 60~64岁 | 28.05(21.86,34.20) | 37.79(24.90,50.67) | 34.72 | 7 174.76(5 591.51,8 748.45) | 6 911.64(4 838.26,9 567.32) | -3.67 |
| 65~69岁 | 35.15(28.53,42.76) | 54.23(35.74,72.71) | 54.28 | 9 808.05(7 962.41,11 931.32) | 9 534.03(6 674.27,13 197.34) | -2.79 |
| 70~74岁 | 31.48(24.75,38.93) | 55.89(36.84,74.94) | 77.54 | 12 834.99(10 090.64,15 872.26) | 12 644.82(8 851.97,17 502.76) | -1.48 |
| 75~79岁 | 24.68(19.95,29.94) | 47.23(31.13,63.32) | 91.37 | 15 710.38(12 701.39,19 056.28) | 15 578.80(10 906.09,21 564.03) | -0.84 |
| 80~84岁 | 19.50(15.94,23.57) | 42.34(27.91,56.77) | 117.10 | 18 233.42(14 904.87,22 040.04) | 18 047.91(12 634.59,24 981.53) | -1.02 |
| 85~89岁 | 11.03(9.15,13.23) | 22.05(14.54,29.57) | 99.91 | 19 956.90(16 549.96,23 939.22) | 19 644.12(13 752.07,27 191.05) | -1.57 |
| 90~94岁 | 3.90(3.26,4.62) | 8.00(5.28,10.73) | 105.10 | 21 005.15(17 575.78,24 849.58) | 20 503.84(14 353.82,28 381.23) | -2.39 |
| ≥95岁 | 0.89(0.74,1.06) | 2.42(1.59,3.24) | 171.90 | 19 900.02(16 381.60,23 738.57) | 21 118.14(14 783.68,29 231.74) | 6.12 |
Table 3 Comparison of number of cases and age-standardized prevalence of PAD in China in 2019 and 2035
| 分层 | 患病人数 | 年龄标化患病率/年龄分层患病率 | ||||
|---|---|---|---|---|---|---|
| 2019年(×10万) | 2035年(×10万) | 变化率(%) | 2019年(1/10万) | 2035年(1/10万) | 变化率(%) | |
| 男性 | 71.74(61.29,82.49) | 101.30(74.17,128.43) | 41.20 | 744.96(644.62,850.82) | 712.09(521.26,902.92) | -4.41 |
| 女性 | 213.15(183.34,244.52) | 319.24(211.74,426.74) | 49.77 | 2 022.13(1 750.00,2 309.13) | 1 945.97(1 290.41,2 601.54) | -3.77 |
| 年龄 | ||||||
| 40~44岁 | 3.53(2.63,4.53) | 3.44(2.03,4.86) | -2.55 | 709.33(528.11,909.28) | 685.46(451.91,997.17) | -3.37 |
| 45~49岁 | 10.28(8.00,13.02) | 10.23(6.48,13.98) | -0.49 | 1 727.05(1 343.83,2 186.38) | 1 669.34(1 141.36,2 356.88) | -3.34 |
| 50~54岁 | 20.45(15.47,26.47) | 16.84(10.99,22.68) | -17.65 | 3 283.85(2 484.01,4 250.95) | 3 176.14(2 211.35,4 416.94) | -3.28 |
| 55~59岁 | 24.22(18.92,29.50) | 23.60(15.55,31.65) | -2.56 | 5 130.90(4 009.67,6 250.79) | 4 954.32(3 467.83,6 858.72) | -3.44 |
| 60~64岁 | 28.05(21.86,34.20) | 37.79(24.90,50.67) | 34.72 | 7 174.76(5 591.51,8 748.45) | 6 911.64(4 838.26,9 567.32) | -3.67 |
| 65~69岁 | 35.15(28.53,42.76) | 54.23(35.74,72.71) | 54.28 | 9 808.05(7 962.41,11 931.32) | 9 534.03(6 674.27,13 197.34) | -2.79 |
| 70~74岁 | 31.48(24.75,38.93) | 55.89(36.84,74.94) | 77.54 | 12 834.99(10 090.64,15 872.26) | 12 644.82(8 851.97,17 502.76) | -1.48 |
| 75~79岁 | 24.68(19.95,29.94) | 47.23(31.13,63.32) | 91.37 | 15 710.38(12 701.39,19 056.28) | 15 578.80(10 906.09,21 564.03) | -0.84 |
| 80~84岁 | 19.50(15.94,23.57) | 42.34(27.91,56.77) | 117.10 | 18 233.42(14 904.87,22 040.04) | 18 047.91(12 634.59,24 981.53) | -1.02 |
| 85~89岁 | 11.03(9.15,13.23) | 22.05(14.54,29.57) | 99.91 | 19 956.90(16 549.96,23 939.22) | 19 644.12(13 752.07,27 191.05) | -1.57 |
| 90~94岁 | 3.90(3.26,4.62) | 8.00(5.28,10.73) | 105.10 | 21 005.15(17 575.78,24 849.58) | 20 503.84(14 353.82,28 381.23) | -2.39 |
| ≥95岁 | 0.89(0.74,1.06) | 2.42(1.59,3.24) | 171.90 | 19 900.02(16 381.60,23 738.57) | 21 118.14(14 783.68,29 231.74) | 6.12 |
| 危险因素 | 女性 | 男性 |
|---|---|---|
| 高血压 | 32.31 | 18.97 |
| 糖尿病 | 24.81 | 16.11 |
| 肾功能不全 | 17.27 | 10.66 |
| 吸烟 | 14.91 | 44.32 |
| 高盐饮食 | 8.40 | 7.81 |
| 铅暴露 | 2.30 | 2.13 |
Table 4 Proportion of risk factors of PAD disease burden in China in 2019
| 危险因素 | 女性 | 男性 |
|---|---|---|
| 高血压 | 32.31 | 18.97 |
| 糖尿病 | 24.81 | 16.11 |
| 肾功能不全 | 17.27 | 10.66 |
| 吸烟 | 14.91 | 44.32 |
| 高盐饮食 | 8.40 | 7.81 |
| 铅暴露 | 2.30 | 2.13 |
| [1] |
|
| [2] |
|
| [3] |
|
| [4] |
|
| [5] |
|
| [6] |
|
| [7] |
|
| [8] |
|
| [9] |
|
| [10] |
|
| [11] |
|
| [12] |
|
| [13] |
|
| [14] |
|
| [15] |
|
| [16] |
李辉章,杜灵彬. Joinpoint回归模型在肿瘤流行病学时间趋势分析中的应用[J]. 中华预防医学杂志,2020,54(8):908-912. DOI:10.3760/cma.j.cn112150-20200616-00889.
|
| [17] |
王红心,樊文龙,杨晓雨,等. 1990—2019年中国蛋白质能量营养不良发病趋势及预测研究[J]. 中国全科医学,2023,26(5):591-597. DOI:10.12114/j.issn.1007-9572.2022.0556.
|
| [18] |
许晴晴,严永富,陈浩,等. 中国四大慢性病死亡率可持续发展目标实现的预测研究[J]. 中华流行病学杂志,2022,43(6):878-884. DOI:10.3760/cma.j.cn112338-20211028-00830.
|
| [19] |
梁珊珊,周智华,李成程,等. 1990—2019年中国糖尿病疾病负担及发病预测分析[J]. 中国全科医学,2023,26(16):2013-2019. DOI:10.12114/j.issn.1007-9572.2023.0009.
|
| [20] |
|
| [21] |
|
| [22] |
|
| [23] |
|
| [24] |
|
| [25] |
|
| [26] |
|
| [27] |
|
| [28] |
项鑫,王乙. 中国人口老龄化现状、特点、原因及对策[J]. 中国老年学杂志,2021,41(18):4149-4152. DOI:10.3969/j.issn.1005-9202.2021.18.072.
|
| [29] |
|
| [30] |
|
| [31] |
|
| [32] |
|
| [33] |
|
| [34] |
|
| [35] |
|
| [36] |
|
| [37] |
|
| [38] |
|
| [39] |
|
| [40] |
|
| [41] |
赵倩南,王淳秀,关绍晨,等. 北京地区35岁及以上人群外周动脉疾病患病率特点及影响因素分析[J]. 中华心血管病杂志,2019,47(12):1000-1004. DOI:10.3760/cma.j.issn.0253?3758.2019.12.010.
|
| [42] |
蔡毅,崔华,范利. 北京市军队老年男性高血压患者心脑血管疾病患病率调查[J]. 中国康复理论与实践,2015,21(11):1298-1303. DOI:10.3969/j.issn.1006-9771.2015.11.014.
|
| [43] |
李宪凯,韩扬,徐大春,等. 踝臂指数与外周动脉疾病死亡率之间的关系[J]. 同济大学学报(医学版),2015,36(2):74-80. DOI:10.16118/j.1008-0392.2015.02.017.
|
| [44] |
|
| [45] |
|
| [46] |
|
| [47] |
|
| [48] |
|
| [49] |
|
| [50] |
|
| [1] | XU Jialan, YAN Hong, WEN Jun, ZHOU Zitong, WANG Siyu. Prevalence of Potentially Inappropriate Medication in Older Adults with Cancer: a Meta-analysis [J]. Chinese General Practice, 2025, 28(30): 3815-3822. |
| [2] | LUO Xinyu, LIU Jin, CHEN Hailong. Trend Analysis of the Changing Disease Burden of Pancreatitis in China and Worldwide from 1990 to 2021 and Prediction for 2022 to 2031 [J]. Chinese General Practice, 2025, 28(26): 3321-3327. |
| [3] | YU Zizi, LIU Duli, LI Ximin, RUAN Chunyi, YIN Xiangyang, CAI Le. Analysis of the Prevalence and Self-management of Hypertension and Its Influencing Factors in Rural [J]. Chinese General Practice, 2025, 28(25): 3137-3143. |
| [4] | JIANG Shihua, ZHU Zheng, REN Yingying, ZHU Yaolei, WANG Yue, GAO Xibin. Meta Analysis of the Prevalence and Risk Factors of Myopia in Chinese Children and Adolescents [J]. Chinese General Practice, 2025, 28(24): 3043-3052. |
| [5] | ZHANG Zhidong, JIN Hua, HU Jihong, JIANG Lu, WANG Li, LONG Kaichong, ZHANG Ronghua. Analysis and Prediction of the Incidence and Mortality Trends of Hypertensive Nephropathy in China from 1990 to 2021 [J]. Chinese General Practice, 2025, 28(18): 2262-2269. |
| [6] | ZHANG Bingqing, WANG Zhongkai, WU Changyong, SUN Huang, LI Ruijie, LIU Wenjie, LUO Yihua, ZHENG Lihui, PENG Yunzhu. Changes and Trend Prediction in the Global Burden of Congenital Heart Defects, 1990-2021 [J]. Chinese General Practice, 2025, 28(18): 2253-2261. |
| [7] | WANG Biqing, ZHANG Ping, YANG Hongxia, WANG Qian, JU Chunxiao, ZHAO Junnan, MEI Jun, ZHANG Ying, XU Fengqin. Meta-analysis of Prevalence and Development Trend of Mild Cognitive Impairment in Elderly Hypertensive Patients in China [J]. Chinese General Practice, 2025, 28(17): 2186-2192. |
| [8] | CHEN Xingchao, GAO Zhenhua, XU Shenggang, ZOU Yonggang, QIAN Jun, WEI Jiantong. Disease Burden of Osteoarthritis in the World, China, and Regions with Different Socio-demographic Index from 1990 to 2021 [J]. Chinese General Practice, 2025, 28(17): 2172-2178. |
| [9] | LING Yao, ZHANG Wenbin, WANG Shihong, CHEN Yongze, DONG Wenjiao, DENG Xingyu, DING Yuanlin. Trend Analysis and Forecasting Study on the Changing Disease Burden of Rheumatoid Arthritis in China, 1990-2021 [J]. Chinese General Practice, 2025, 28(15): 1914-1922. |
| [10] | ZHANG Ying, JIANG Xintong, WANG Pingyu. The Influencing Factors of Depression Symptoms in the Chinese Female Elderly Population Based on Health Ecology Models [J]. Chinese General Practice, 2025, 28(13): 1595-1600. |
| [11] | SUN Qing, WU Yuxiao, CUI Limin. The Prevalence of Osteosarcopenia in Chinese Patients with Type 2 Diabetes Mellitus: a Meta-analysis [J]. Chinese General Practice, 2025, 28(12): 1520-1526. |
| [12] | ZHU Xianshang, ZENG Hongyu, LYU Fengli, WANG Jiancheng. The Current Status and Influencing Factors of Multiple Chronic Conditions among the Elderly Aged 60 and above in Gansu Province [J]. Chinese General Practice, 2025, 28(10): 1193-1199. |
| [13] | ZHAO Xinrui, HUANG Li, CAO Lichun, QU Huichao, ZHANG Meilin, LIU Huan. Status and Influencing Factors of Reversible and Potentially Reversible Cognitive Frailty among the Community-dwelling Elderly [J]. Chinese General Practice, 2025, 28(07): 824-830. |
| [14] | LIU Qin, CHENG Min, JIANG Fengqiong, LI Xiaoyu. Meta-analysis of the Prevalence and Factors Affecting Enuresis in Chinese Children and Adolescents [J]. Chinese General Practice, 2025, 28(06): 763-770. |
| [15] | WU Xia, ZHANG Yiyun, YAO Chengzhi, ZHAO Xiangling, XIONG Wenjing, RANG Weiqing. Trend and Prediction of Changes in the Disease Burden of Diet-related Ischemic Heart Disease in China, 1990-2021 [J]. Chinese General Practice, 2025, 28(03): 305-312. |
| Viewed | ||||||
|
Full text |
|
|||||
|
Abstract |
|
|||||