
Chinese General Practice ›› 2026, Vol. 29 ›› Issue (03): 299-310.DOI: 10.12114/j.issn.1007-9572.2025.0109
Special Issue: 心血管最新文章合辑
• Article • Previous Articles
Received:2025-04-21
Revised:2025-10-14
Published:2026-01-20
Online:2025-12-11
Contact:
YANG Peng, WU Shouling, LI Yun
About author:LU Yanqiu and WU Yuntao are co-first authors
通讯作者:
杨鹏, 吴寿岭, 李云
作者简介:鹿妍秋和吴云涛为共同第一作者
作者贡献:
鹿妍秋、吴云涛、杨鹏、吴寿岭、李云提出研究思路,设计研究方案;鹿妍秋、吴云涛、刘少鹏、林海颖、邓惠友、武英、黄喆负责研究的构思与设计,研究的实施,进行数据的收集与整理,统计学处理,图、表的绘制与展示,负责论文起草撰写;杨鹏、吴寿岭、李云负责最终版本修订,文章的质量控制与审查,对文章整体负责,监督管理。
Add to citation manager EndNote|Ris|BibTeX
URL: https://www.chinagp.net/EN/10.12114/j.issn.1007-9572.2025.0109
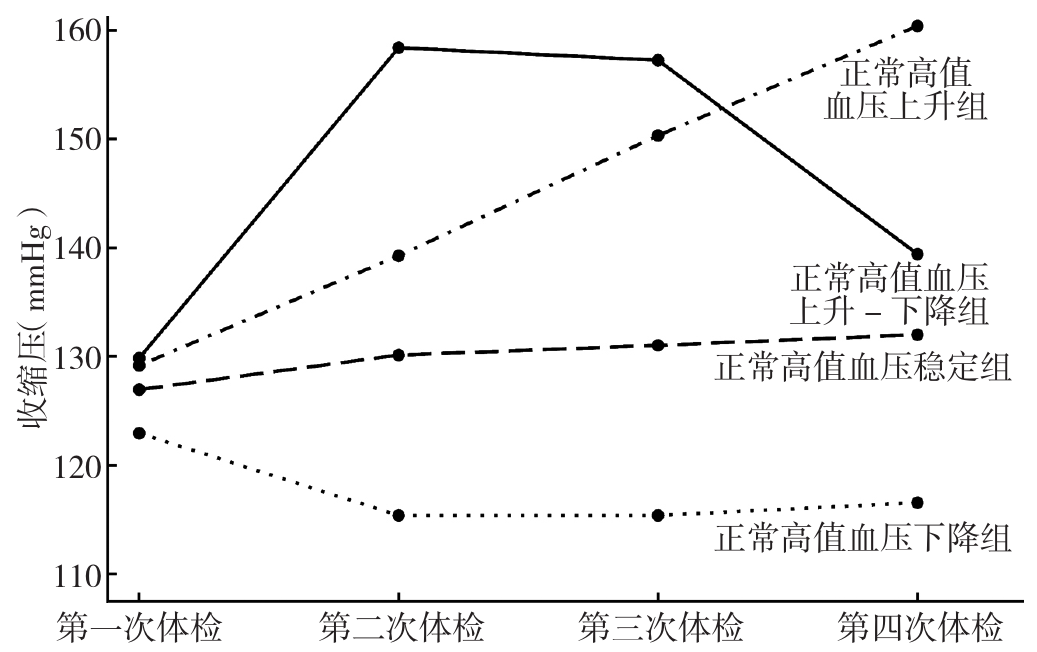
Figure 1 The "2nd-2nd-1st-2nd" trajectory model fitted according to SBP
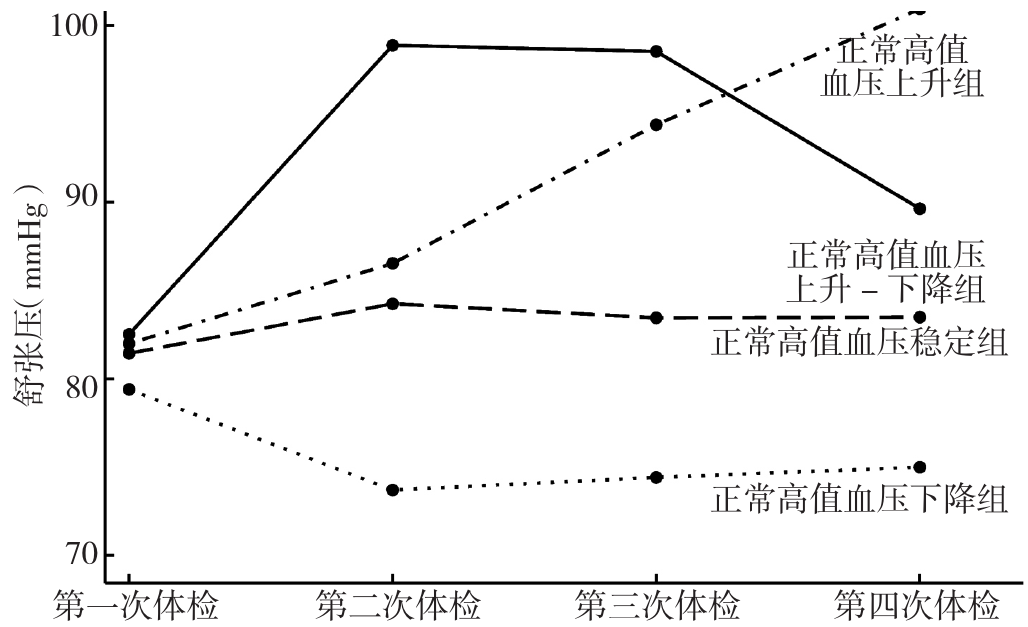
Figure 2 The "3nd-3nd-2st-2nd" trajectory model fitted according to DBP
| 组别 | 例数 | 年龄( | 性别(男/女) | BMI( | 受教育程度[例(%)] | 吸烟[例(%)] | 饮酒[例(%)] | 喜盐[例(%)] | |
|---|---|---|---|---|---|---|---|---|---|
| 受教育程度高 | 受教育程度低 | ||||||||
| 正常高值血压下降组 | 7 088 | 50.0±10.7 | 5 405/1 683 | 24.5±3.1 | 2 144(30.25) | 4 944(69.75) | 2 366(33.38) | 2 348(33.13) | 621(8.76) |
| 正常高值血压稳定组 | 11 662 | 54.7±11.0 | 9 672/1 990 | 25.2±3.1 | 2 566(22.00) | 9 096(78.00) | 3 880(33.27) | 3 967(34.02) | 1 048(8.99) |
| 正常高值血压上升组 | 1 710 | 61.0±10.4 | 1 398/312 | 25.6±3.2 | 224(13.10) | 1 486(86.90) | 483(28.25) | 491(28.71) | 148(8.65) |
| 正常高值血压上升-下降组 | 1 285 | 61.3±10.9 | 1 090/195 | 25.6±3.3 | 161(12.53) | 1 124(87.47) | 349(27.16) | 393(30.58) | 122(9.49) |
| 检验统计量值 | 762.10a | 141.85 | 119.33a | 383.03 | 36.42 | 22.96 | 0.95 | ||
| P值 | <0.01 | <0.01 | <0.01 | <0.01 | <0.01 | <0.01 | 0.92 | ||
| 组别 | 体育锻炼[例(%)] | SBP( | DBP( | LDL-C( | HDL-C( | TG[M(P25,P75),mmol/L] | TC( | FBG( | 超敏C反应蛋白[M(P25,P75),mg/L] |
| 正常高值血压下降组 | 4 859(68.55) | 116±9 | 78±7 | 2.40±0.81 | 1.40±0.41 | 1.17(0.83,1.78) | 4.95±0.94 | 5.46±1.41 | 1.40(0.66,3.10) |
| 正常高值血压稳定组 | 8 444(72.41) | 131±10 | 85±8 | 2.55±0.88 | 1.40±0.44 | 1.30(0.91,2.00) | 5.11±1.00 | 5.72±1.62 | 1.44(0.70,3.12) |
| 正常高值血压上升组 | 1 273(74.44) | 158±11 | 94±10 | 2.67±0.98 | 1.41±0.41 | 1.32(0.91,1.96) | 5.22±1.02 | 6.06±1.94 | 1.61(0.83,3.10) |
| 正常高值血压上升-下降组 | 969(75.41) | 148±16 | 89±10 | 2.75±1.12 | 1.43±0.52 | 1.34(0.92,1.97) | 5.20±1.01 | 6.12±1.81 | 1.64(0.80,3.36) |
| 检验统计量值 | 51.81 | 10 582.50a | 2 439.58a | 97.34a | 2.54a | 175.69b | 59.99a | 111.40a | 28.89b |
| P值 | <0.01 | <0.01 | <0.01 | <0.01 | 0.07 | <0.01 | <0.01 | <0.01 | <0.01 |
| 组别 | eGFR[ | ISH [例(%)] | IDH [例(%)] | 高血压[例(%)] | 糖尿病[例(%)] | 服用降压药[例(%)] | 服用降糖药[例(%)] | 服用调脂药[例(%)] | |
| 正常高值血压下降组 | 94.94±22.00 | 21(0.30) | 420(5.93) | 599(8.45) | 476(6.72) | 82(1.16) | 133(1.88) | 29(0.41) | |
| 正常高值血压稳定组 | 90.87±21.52 | 1 116(9.57) | 1 636(14.03) | 5 201(44.60) | 1 315(11.28) | 652(5.59) | 323(2.77) | 74(0.63) | |
| 正常高值血压上升组 | 86.21±22.64 | 449(26.26) | 2(0.12) | 1 703(99.59) | 292(17.08) | 282(16.49) | 79(4.62) | 15(0.88) | |
| 正常高值血压上升-下降组 | 85.58±19.72 | 304(23.66) | 79(6.15) | 1 067(83.04) | 243(18.91) | 228(17.74) | 76(5.91) | 8(0.62) | |
| 检验统计量值 | 128.96a | 1 688.31 | 555.62 | 6 594.19 | 285.30 | 986.23 | 88.55 | 6.86 | |
| P值 | <0.01 | <0.01 | <0.01 | <0.01 | <0.01 | <0.01 | <0.01 | 0.14 | |
Table 1 Comparison of baseline data of study subjects in different SBP trajectory groups
| 组别 | 例数 | 年龄( | 性别(男/女) | BMI( | 受教育程度[例(%)] | 吸烟[例(%)] | 饮酒[例(%)] | 喜盐[例(%)] | |
|---|---|---|---|---|---|---|---|---|---|
| 受教育程度高 | 受教育程度低 | ||||||||
| 正常高值血压下降组 | 7 088 | 50.0±10.7 | 5 405/1 683 | 24.5±3.1 | 2 144(30.25) | 4 944(69.75) | 2 366(33.38) | 2 348(33.13) | 621(8.76) |
| 正常高值血压稳定组 | 11 662 | 54.7±11.0 | 9 672/1 990 | 25.2±3.1 | 2 566(22.00) | 9 096(78.00) | 3 880(33.27) | 3 967(34.02) | 1 048(8.99) |
| 正常高值血压上升组 | 1 710 | 61.0±10.4 | 1 398/312 | 25.6±3.2 | 224(13.10) | 1 486(86.90) | 483(28.25) | 491(28.71) | 148(8.65) |
| 正常高值血压上升-下降组 | 1 285 | 61.3±10.9 | 1 090/195 | 25.6±3.3 | 161(12.53) | 1 124(87.47) | 349(27.16) | 393(30.58) | 122(9.49) |
| 检验统计量值 | 762.10a | 141.85 | 119.33a | 383.03 | 36.42 | 22.96 | 0.95 | ||
| P值 | <0.01 | <0.01 | <0.01 | <0.01 | <0.01 | <0.01 | 0.92 | ||
| 组别 | 体育锻炼[例(%)] | SBP( | DBP( | LDL-C( | HDL-C( | TG[M(P25,P75),mmol/L] | TC( | FBG( | 超敏C反应蛋白[M(P25,P75),mg/L] |
| 正常高值血压下降组 | 4 859(68.55) | 116±9 | 78±7 | 2.40±0.81 | 1.40±0.41 | 1.17(0.83,1.78) | 4.95±0.94 | 5.46±1.41 | 1.40(0.66,3.10) |
| 正常高值血压稳定组 | 8 444(72.41) | 131±10 | 85±8 | 2.55±0.88 | 1.40±0.44 | 1.30(0.91,2.00) | 5.11±1.00 | 5.72±1.62 | 1.44(0.70,3.12) |
| 正常高值血压上升组 | 1 273(74.44) | 158±11 | 94±10 | 2.67±0.98 | 1.41±0.41 | 1.32(0.91,1.96) | 5.22±1.02 | 6.06±1.94 | 1.61(0.83,3.10) |
| 正常高值血压上升-下降组 | 969(75.41) | 148±16 | 89±10 | 2.75±1.12 | 1.43±0.52 | 1.34(0.92,1.97) | 5.20±1.01 | 6.12±1.81 | 1.64(0.80,3.36) |
| 检验统计量值 | 51.81 | 10 582.50a | 2 439.58a | 97.34a | 2.54a | 175.69b | 59.99a | 111.40a | 28.89b |
| P值 | <0.01 | <0.01 | <0.01 | <0.01 | 0.07 | <0.01 | <0.01 | <0.01 | <0.01 |
| 组别 | eGFR[ | ISH [例(%)] | IDH [例(%)] | 高血压[例(%)] | 糖尿病[例(%)] | 服用降压药[例(%)] | 服用降糖药[例(%)] | 服用调脂药[例(%)] | |
| 正常高值血压下降组 | 94.94±22.00 | 21(0.30) | 420(5.93) | 599(8.45) | 476(6.72) | 82(1.16) | 133(1.88) | 29(0.41) | |
| 正常高值血压稳定组 | 90.87±21.52 | 1 116(9.57) | 1 636(14.03) | 5 201(44.60) | 1 315(11.28) | 652(5.59) | 323(2.77) | 74(0.63) | |
| 正常高值血压上升组 | 86.21±22.64 | 449(26.26) | 2(0.12) | 1 703(99.59) | 292(17.08) | 282(16.49) | 79(4.62) | 15(0.88) | |
| 正常高值血压上升-下降组 | 85.58±19.72 | 304(23.66) | 79(6.15) | 1 067(83.04) | 243(18.91) | 228(17.74) | 76(5.91) | 8(0.62) | |
| 检验统计量值 | 128.96a | 1 688.31 | 555.62 | 6 594.19 | 285.30 | 986.23 | 88.55 | 6.86 | |
| P值 | <0.01 | <0.01 | <0.01 | <0.01 | <0.01 | <0.01 | <0.01 | 0.14 | |
| 组别 | 例数 | 年龄( | 性别(男/女) | BMI( | 受教育程度[例(%)] | 吸烟[例(%)] | 饮酒[例(%)] | 喜盐[例(%)] | |
|---|---|---|---|---|---|---|---|---|---|
| 受教育程度高 | 受教育程度低 | ||||||||
| 正常高值血压下降组 | 4 856 | 54.4±11.4 | 3 366/1 490 | 24.0±3.1 | 1 245(25.64) | 3 611(74.36) | 1 337(27.53) | 1 255(25.84) | 392(8.07) |
| 正常高值血压稳定组 | 13 668 | 54.4±12.7 | 11 365/2 303 | 25.2±3.1 | 3 219(23.55) | 10 449(76.45) | 4 552(33.30) | 4 606(33.70) | 1 182(8.65) |
| 正常高值血压上升组 | 1 640 | 54.5±10.0 | 2 31/39 | 25.9±3.3 | 333(20.30) | 1 307(79.70) | 623(37.99) | 682(41.59) | 206(12.56) |
| 正常高值血压上升-下降组 | 1 581 | 54.2±9.9 | 3 23/48 | 26.0±3.3 | 297(18.79) | 1 284(81.21) | 566(35.80) | 656(41.49) | 159(10.06) |
| 检验统计量值 | 4.29a | 564.98 | 263.25a | 41.25 | 88.91 | 221.26 | 34.82 | ||
| P值 | <0.01 | <0.01 | <0.01 | <0.01 | <0.01 | <0.01 | <0.01 | ||
| 组别 | 体育锻炼[例(%)] | SBP( | DBP( | LDL-C( | HDL-C( | TG[M(P25,P75),mmol/L] | TC( | FBG( | 超敏C反应蛋白[M(P25,P75),mg/L] |
| 正常高值血压下降组 | 3 418(70.39) | 119±14 | 74±7 | 2.48±0.85 | 1.44±0.42 | 1.10(0.79,1.59) | 4.98±0.97 | 5.56±1.61 | 1.39(0.62,3.00) |
| 正常高值血压稳定组 | 9 846(72.04) | 129±13 | 83±6 | 2.53±0.87 | 1.39±0.43 | 1.28(0.90,1.96) | 5.07±0.99 | 5.70±1.60 | 1.43(0.70,3.10) |
| 正常高值血压上升组 | 1 161(70.79) | 149±14 | 101±5 | 2.50±0.88 | 1.38±0.44 | 1.44(0.97,2.29) | 5.24±1.01 | 5.77±1.58 | 1.69(0.86,3.53) |
| 正常高值血压上升-下降组 | 1 120(70.84) | 143±16 | 93±9 | 2.61±1.13 | 1.40±0.52 | 1.50(1.01,2.31) | 5.20±1.01 | 5.87±1.63 | 1.62(0.80,3.30) |
| 检验统计量值 | 5.62 | 2 615.01a | 8 786.29a | 8.84a | 13.57a | 485.43b | 37.35a | 18.29a | 58.11b |
| P值 | 0.23 | <0.01 | <0.01 | <0.01 | <0.01 | <0.01 | <0.01 | <0.01 | <0.01 |
| 组别 | eGFR[ | ISH [例(%)] | IDH [例(%)] | 高血压[例(%)] | 糖尿病[例(%)] | 服用降压药[例(%)] | 服用降糖药[例(%)] | 服用调脂药[例(%)] | |
| 正常高值血压下降组 | 91.87±21.86 | 401(8.26) | 33(0.68) | 550(11.33) | 425(8.75) | 92(1.89) | 146(3.01) | 23(0.47) | |
| 正常高值血压稳定组 | 91.19±21.97 | 1 390(10.17) | 1 425(10.43) | 5 058(37.01) | 1 488(10.89) | 624(4.57) | 374(2.74) | 84(0.61) | |
| 正常高值血压上升组 | 92.63±22.98 | 1(0.06) | 352(21.46) | 1 637(99.82) | 186(11.34) | 305(19.29) | 39(2.38) | 6(0.37) | |
| 正常高值血压上升-下降组 | 92.13±19.50 | 98(6.20) | 327(20.68) | 1 325(83.81) | 227(14.36) | 223(13.60) | 52(3.29) | 13(0.82) | |
| 检验统计量值 | 3.27a | 205.09 | 924.9 | 5 448.22 | 42.64 | 894.13 | 3.41 | 4.15 | |
| P值 | 0.04 | <0.01 | <0.01 | <0.01 | <0.01 | <0.01 | 0.49 | 0.39 | |
Table 2 Comparison of baseline data of study subjects in different DBP trajectory groups
| 组别 | 例数 | 年龄( | 性别(男/女) | BMI( | 受教育程度[例(%)] | 吸烟[例(%)] | 饮酒[例(%)] | 喜盐[例(%)] | |
|---|---|---|---|---|---|---|---|---|---|
| 受教育程度高 | 受教育程度低 | ||||||||
| 正常高值血压下降组 | 4 856 | 54.4±11.4 | 3 366/1 490 | 24.0±3.1 | 1 245(25.64) | 3 611(74.36) | 1 337(27.53) | 1 255(25.84) | 392(8.07) |
| 正常高值血压稳定组 | 13 668 | 54.4±12.7 | 11 365/2 303 | 25.2±3.1 | 3 219(23.55) | 10 449(76.45) | 4 552(33.30) | 4 606(33.70) | 1 182(8.65) |
| 正常高值血压上升组 | 1 640 | 54.5±10.0 | 2 31/39 | 25.9±3.3 | 333(20.30) | 1 307(79.70) | 623(37.99) | 682(41.59) | 206(12.56) |
| 正常高值血压上升-下降组 | 1 581 | 54.2±9.9 | 3 23/48 | 26.0±3.3 | 297(18.79) | 1 284(81.21) | 566(35.80) | 656(41.49) | 159(10.06) |
| 检验统计量值 | 4.29a | 564.98 | 263.25a | 41.25 | 88.91 | 221.26 | 34.82 | ||
| P值 | <0.01 | <0.01 | <0.01 | <0.01 | <0.01 | <0.01 | <0.01 | ||
| 组别 | 体育锻炼[例(%)] | SBP( | DBP( | LDL-C( | HDL-C( | TG[M(P25,P75),mmol/L] | TC( | FBG( | 超敏C反应蛋白[M(P25,P75),mg/L] |
| 正常高值血压下降组 | 3 418(70.39) | 119±14 | 74±7 | 2.48±0.85 | 1.44±0.42 | 1.10(0.79,1.59) | 4.98±0.97 | 5.56±1.61 | 1.39(0.62,3.00) |
| 正常高值血压稳定组 | 9 846(72.04) | 129±13 | 83±6 | 2.53±0.87 | 1.39±0.43 | 1.28(0.90,1.96) | 5.07±0.99 | 5.70±1.60 | 1.43(0.70,3.10) |
| 正常高值血压上升组 | 1 161(70.79) | 149±14 | 101±5 | 2.50±0.88 | 1.38±0.44 | 1.44(0.97,2.29) | 5.24±1.01 | 5.77±1.58 | 1.69(0.86,3.53) |
| 正常高值血压上升-下降组 | 1 120(70.84) | 143±16 | 93±9 | 2.61±1.13 | 1.40±0.52 | 1.50(1.01,2.31) | 5.20±1.01 | 5.87±1.63 | 1.62(0.80,3.30) |
| 检验统计量值 | 5.62 | 2 615.01a | 8 786.29a | 8.84a | 13.57a | 485.43b | 37.35a | 18.29a | 58.11b |
| P值 | 0.23 | <0.01 | <0.01 | <0.01 | <0.01 | <0.01 | <0.01 | <0.01 | <0.01 |
| 组别 | eGFR[ | ISH [例(%)] | IDH [例(%)] | 高血压[例(%)] | 糖尿病[例(%)] | 服用降压药[例(%)] | 服用降糖药[例(%)] | 服用调脂药[例(%)] | |
| 正常高值血压下降组 | 91.87±21.86 | 401(8.26) | 33(0.68) | 550(11.33) | 425(8.75) | 92(1.89) | 146(3.01) | 23(0.47) | |
| 正常高值血压稳定组 | 91.19±21.97 | 1 390(10.17) | 1 425(10.43) | 5 058(37.01) | 1 488(10.89) | 624(4.57) | 374(2.74) | 84(0.61) | |
| 正常高值血压上升组 | 92.63±22.98 | 1(0.06) | 352(21.46) | 1 637(99.82) | 186(11.34) | 305(19.29) | 39(2.38) | 6(0.37) | |
| 正常高值血压上升-下降组 | 92.13±19.50 | 98(6.20) | 327(20.68) | 1 325(83.81) | 227(14.36) | 223(13.60) | 52(3.29) | 13(0.82) | |
| 检验统计量值 | 3.27a | 205.09 | 924.9 | 5 448.22 | 42.64 | 894.13 | 3.41 | 4.15 | |
| P值 | 0.04 | <0.01 | <0.01 | <0.01 | <0.01 | <0.01 | 0.49 | 0.39 | |
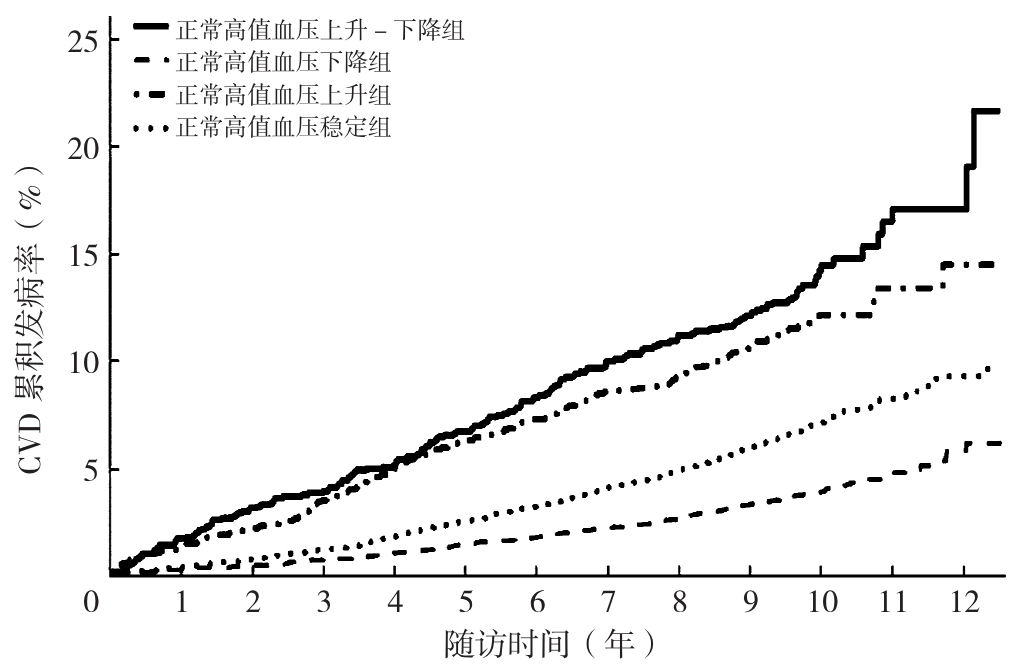
Figure 3 Cumulative incidence curve of CVD in different SBP trajectory groups of participants with high-normal blood pressure
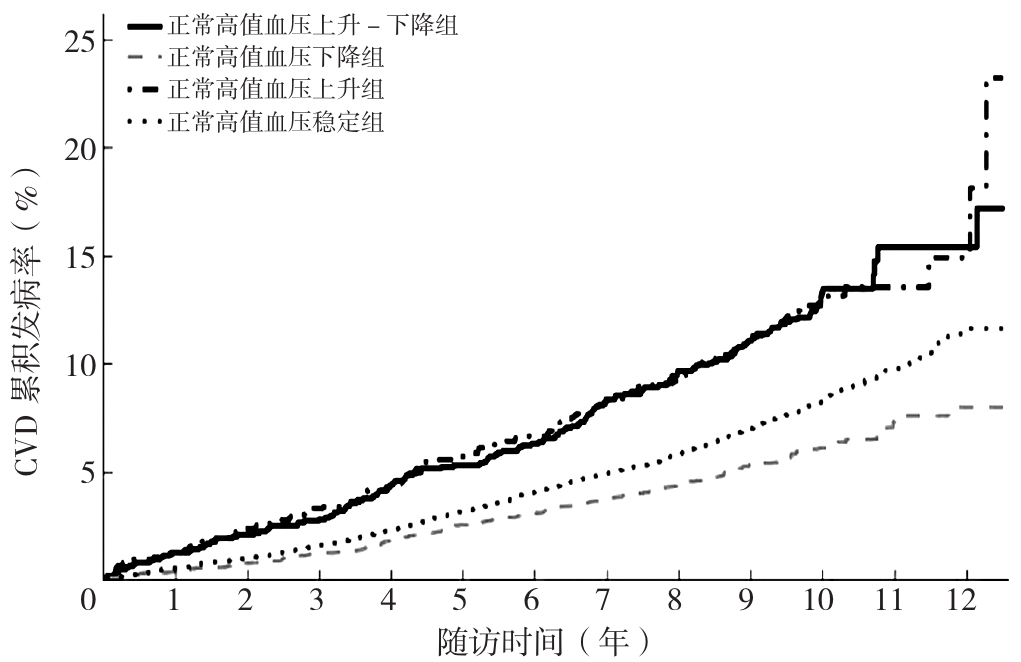
Figure 4 Cumulative incidence curve of CVD in different DBP trajectory groups of participants with high-normal blood pressure
| CVD | 脑卒中 | MI | ||||||||||
|---|---|---|---|---|---|---|---|---|---|---|---|---|
| 模型1 | 模型2 | 模型1 | 模型2 | 模型1 | 模型2 | |||||||
| HR(95%CI) | P值 | HR(95%CI) | P值 | HR(95%CI) | P值 | HR(95%CI) | P值 | HR(95%CI) | P值 | HR(95%CI) | P值 | |
| 正常高值血压下降组 | 1.00 | 1.00 | 1.00 | 1.00 | 1.00 | 1.00 | ||||||
| 正常高值血压稳定组 | 1.48(1.29~1.71) | <0.01 | 1.41(1.22~1.62) | <0.01 | 1.53(1.31~1.78) | <0.01 | 1.46(1.25~1.71) | <0.01 | 1.37(0.99~1.87) | 0.05 | 1.25(0.92~1.72) | 0.16 |
| 正常高值血压上升组 | 2.13(1.76~2.58) | <0.01 | 1.92(1.58~2.33) | <0.01 | 2.22(1.80~2.74) | <0.01 | 2.04(1.65~2.53) | <0.01 | 1.66(1.06~2.62) | 0.03 | 1.42(0.90~2.23) | 0.13 |
| 正常高值血压上升-下降组 | 2.46(2.02~3.00) | <0.01 | 2.24(1.84~2.74) | <0.01 | 2.53(2.04~3.15) | <0.01 | 2.37(1.90~2.96) | <0.01 | 2.22(1.42~3.48) | <0.01 | 1.81(1.14~2.86) | 0.01 |
Table 3 Cox proportionl hazards regression analysis of the effects of different SBP trajectory groups on CVD
| CVD | 脑卒中 | MI | ||||||||||
|---|---|---|---|---|---|---|---|---|---|---|---|---|
| 模型1 | 模型2 | 模型1 | 模型2 | 模型1 | 模型2 | |||||||
| HR(95%CI) | P值 | HR(95%CI) | P值 | HR(95%CI) | P值 | HR(95%CI) | P值 | HR(95%CI) | P值 | HR(95%CI) | P值 | |
| 正常高值血压下降组 | 1.00 | 1.00 | 1.00 | 1.00 | 1.00 | 1.00 | ||||||
| 正常高值血压稳定组 | 1.48(1.29~1.71) | <0.01 | 1.41(1.22~1.62) | <0.01 | 1.53(1.31~1.78) | <0.01 | 1.46(1.25~1.71) | <0.01 | 1.37(0.99~1.87) | 0.05 | 1.25(0.92~1.72) | 0.16 |
| 正常高值血压上升组 | 2.13(1.76~2.58) | <0.01 | 1.92(1.58~2.33) | <0.01 | 2.22(1.80~2.74) | <0.01 | 2.04(1.65~2.53) | <0.01 | 1.66(1.06~2.62) | 0.03 | 1.42(0.90~2.23) | 0.13 |
| 正常高值血压上升-下降组 | 2.46(2.02~3.00) | <0.01 | 2.24(1.84~2.74) | <0.01 | 2.53(2.04~3.15) | <0.01 | 2.37(1.90~2.96) | <0.01 | 2.22(1.42~3.48) | <0.01 | 1.81(1.14~2.86) | 0.01 |
| CVD | 脑卒中 | MI | ||||||||||
|---|---|---|---|---|---|---|---|---|---|---|---|---|
| 模型1 | 模型2 | 模型1 | 模型2 | 模型1 | 模型2 | |||||||
| aHR(95%CI) | P值 | aHR(95%CI) | P值 | aHR(95%CI) | P值 | aHR(95%CI) | P值 | aHR(95%CI) | P值 | aHR(95%CI) | P值 | |
| 正常高值血压下降组 | 1.00 | 1.00 | 1.00 | 1.00 | 1.00 | 1.00 | ||||||
| 正常高值血压稳定组 | 1.47(1.16~1.85) | <0.01 | 1.43(1.12~1.82) | <0.01 | 1.47(1.14~1.90) | <0.01 | 1.45(1.11~1.89) | <0.01 | 1.45(0.85~2.47) | 0.17 | 1.34(0.76~2.34) | 0.31 |
| 正常高值血压上升组 | 2.66(1.71~4.12) | <0.01 | 2.59(1.62~4.13) | <0.01 | 2.95(1.81~4.82) | <0.01 | 2.95(1.75~4.97) | <0.01 | 1.36(0.75~2.46) | 0.11 | 1.17(0.62~2.19) | 0.41 |
| 正常高值血压上升-下降组 | 2.20(1.52~3.20) | <0.01 | 2.11(1.40~3.17) | <0.01 | 2.39(1.57~3.63) | <0.01 | 2.34(1.48~3.71) | <0.01 | 1.61(0.89~2.91) | 0.32 | 1.32(0.69~2.55) | 0.63 |
Table 4 Weighted Cox proportional hazards regression analysis of the impact of different DBP trajectory groups on CVD
| CVD | 脑卒中 | MI | ||||||||||
|---|---|---|---|---|---|---|---|---|---|---|---|---|
| 模型1 | 模型2 | 模型1 | 模型2 | 模型1 | 模型2 | |||||||
| aHR(95%CI) | P值 | aHR(95%CI) | P值 | aHR(95%CI) | P值 | aHR(95%CI) | P值 | aHR(95%CI) | P值 | aHR(95%CI) | P值 | |
| 正常高值血压下降组 | 1.00 | 1.00 | 1.00 | 1.00 | 1.00 | 1.00 | ||||||
| 正常高值血压稳定组 | 1.47(1.16~1.85) | <0.01 | 1.43(1.12~1.82) | <0.01 | 1.47(1.14~1.90) | <0.01 | 1.45(1.11~1.89) | <0.01 | 1.45(0.85~2.47) | 0.17 | 1.34(0.76~2.34) | 0.31 |
| 正常高值血压上升组 | 2.66(1.71~4.12) | <0.01 | 2.59(1.62~4.13) | <0.01 | 2.95(1.81~4.82) | <0.01 | 2.95(1.75~4.97) | <0.01 | 1.36(0.75~2.46) | 0.11 | 1.17(0.62~2.19) | 0.41 |
| 正常高值血压上升-下降组 | 2.20(1.52~3.20) | <0.01 | 2.11(1.40~3.17) | <0.01 | 2.39(1.57~3.63) | <0.01 | 2.34(1.48~3.71) | <0.01 | 1.61(0.89~2.91) | 0.32 | 1.32(0.69~2.55) | 0.63 |
| 组别 | HR(95%CI) | P值 | P交互值 |
|---|---|---|---|
| 性别 | <0.01 | ||
| 男性(以正常高值血压下降组为参照) | |||
| 正常高值血压稳定组 | 1.42(1.20~1.67) | <0.01 | |
| 正常高值血压上升组 | 1.93(1.53~2.42) | <0.01 | |
| 正常高值血压上升-下降组 | 2.30(1.82~2.90) | <0.01 | |
| 女性(以正常高值血压下降组为参照) | |||
| 正常高值血压稳定组 | 1.80(1.14~2.85) | 0.01 | |
| 正常高值血压上升组 | 2.91(1.62~5.21) | <0.01 | |
| 正常高值血压上升-下降组 | 2.79(1.43~5.43) | <0.01 | |
| 年龄 | <0.01 | ||
| <60岁(以正常高值血压下降组为参照) | |||
| 正常高值血压稳定组 | 1.48(1.22~1.78) | <0.01 | |
| 正常高值血压上升组 | 2.00(1.46~2.71) | <0.01 | |
| 正常高值血压上升-下降组 | 3.01(2.24~4.06) | <0.01 | |
| ≥60岁(以正常高值血压下降组为参照) | |||
| 正常高值血压稳定组 | 1.35(1.01~1.79) | 0.04 | |
| 正常高值血压上升组 | 1.94(1.40~2.69) | <0.01 | |
| 正常高值血压上升-下降组 | 1.91(1.35~2.69) | <0.01 | |
Table 5 Stratified analysis of the risk of CVD in different SBP trajectory groups
| 组别 | HR(95%CI) | P值 | P交互值 |
|---|---|---|---|
| 性别 | <0.01 | ||
| 男性(以正常高值血压下降组为参照) | |||
| 正常高值血压稳定组 | 1.42(1.20~1.67) | <0.01 | |
| 正常高值血压上升组 | 1.93(1.53~2.42) | <0.01 | |
| 正常高值血压上升-下降组 | 2.30(1.82~2.90) | <0.01 | |
| 女性(以正常高值血压下降组为参照) | |||
| 正常高值血压稳定组 | 1.80(1.14~2.85) | 0.01 | |
| 正常高值血压上升组 | 2.91(1.62~5.21) | <0.01 | |
| 正常高值血压上升-下降组 | 2.79(1.43~5.43) | <0.01 | |
| 年龄 | <0.01 | ||
| <60岁(以正常高值血压下降组为参照) | |||
| 正常高值血压稳定组 | 1.48(1.22~1.78) | <0.01 | |
| 正常高值血压上升组 | 2.00(1.46~2.71) | <0.01 | |
| 正常高值血压上升-下降组 | 3.01(2.24~4.06) | <0.01 | |
| ≥60岁(以正常高值血压下降组为参照) | |||
| 正常高值血压稳定组 | 1.35(1.01~1.79) | 0.04 | |
| 正常高值血压上升组 | 1.94(1.40~2.69) | <0.01 | |
| 正常高值血压上升-下降组 | 1.91(1.35~2.69) | <0.01 | |
| 组别 | aHR(95%CI) | P值 | P交互值 |
|---|---|---|---|
| 性别 | 0.06 | ||
| 男性(以正常高值血压下降组为参照) | |||
| 正常高值血压稳定组 | 1.30(1.01~1.68) | 0.04 | |
| 正常高值血压上升组 | 2.47(1.54~3.96) | <0.01 | |
| 正常高值血压上升-下降组 | 1.95(1.29~2.94) | <0.01 | |
| 女性(以正常高值血压下降组为参照) | |||
| 正常高值血压稳定组 | 2.59(1.53~4.38) | <0.01 | |
| 正常高值血压上升组 | 1.99(0.95~4.20) | 0.05 | |
| 正常高值血压上升-下降组 | 3.76(0.99~14.28) | 0.07 | |
| 年龄 | 0.11 | ||
| <60岁(以正常高值血压下降组为参照) | |||
| 正常高值血压稳定组 | 1.21(0.85~1.73) | 0.29 | |
| 正常高值血压上升组 | 2.39(1.34~4.26) | <0.01 | |
| 正常高值血压上升-下降组 | 2.19(1.25~3.83) | <0.01 | |
| ≥60岁(以正常高值血压下降组为参照) | |||
| 正常高值血压稳定组 | 1.64(1.20~2.23) | <0.01 | |
| 正常高值血压上升组 | 2.48(1.24~4.94) | 0.01 | |
| 正常高值血压上升-下降组 | 1.52(1.00~2.29) | 0.05 | |
Table 6 Stratified analysis of the risk of CVD occurrence in different DBP trajectory groups
| 组别 | aHR(95%CI) | P值 | P交互值 |
|---|---|---|---|
| 性别 | 0.06 | ||
| 男性(以正常高值血压下降组为参照) | |||
| 正常高值血压稳定组 | 1.30(1.01~1.68) | 0.04 | |
| 正常高值血压上升组 | 2.47(1.54~3.96) | <0.01 | |
| 正常高值血压上升-下降组 | 1.95(1.29~2.94) | <0.01 | |
| 女性(以正常高值血压下降组为参照) | |||
| 正常高值血压稳定组 | 2.59(1.53~4.38) | <0.01 | |
| 正常高值血压上升组 | 1.99(0.95~4.20) | 0.05 | |
| 正常高值血压上升-下降组 | 3.76(0.99~14.28) | 0.07 | |
| 年龄 | 0.11 | ||
| <60岁(以正常高值血压下降组为参照) | |||
| 正常高值血压稳定组 | 1.21(0.85~1.73) | 0.29 | |
| 正常高值血压上升组 | 2.39(1.34~4.26) | <0.01 | |
| 正常高值血压上升-下降组 | 2.19(1.25~3.83) | <0.01 | |
| ≥60岁(以正常高值血压下降组为参照) | |||
| 正常高值血压稳定组 | 1.64(1.20~2.23) | <0.01 | |
| 正常高值血压上升组 | 2.48(1.24~4.94) | 0.01 | |
| 正常高值血压上升-下降组 | 1.52(1.00~2.29) | 0.05 | |
| [1] |
|
| [2] |
GBD 2015 Risk Factors Collaborators. Global, regional, and national comparative risk assessment of 79 behavioural, environmental and occupational, and metabolic risks or clusters of risks, 1990-2015: a systematic analysis for the Global Burden of Disease Study 2015[J]. Lancet, 2016, 388(10053): 1659-1724. DOI: 10.1016/S0140-6736(16)31679-8.
|
| [3] |
IN CHINA T W C O T R O C H A D,
|
| [4] |
中国高血压防治指南修订委员会,高血压联盟(中国),中国医疗保健国际交流促进会高血压分会,等. 中国高血压防治指南(2024年修订版)[J]. 中华高血压杂志, 2024, 32(7): 603-700. DOI: 10.16439/j.issn.1673-7245.2024.07.002.
|
| [5] |
|
| [6] |
张梅,吴静,张笑,等. 2018年中国成年居民高血压患病与控制状况研究[J]. 中华流行病学杂志, 2021, 42(10): 1780-1789. DOI: 10.3760/cma.j.cn112338-20210508-00379.
|
| [7] |
|
| [8] |
|
| [9] |
|
| [10] |
方伟,李尉键,蔡泽锋,等. 超重/肥胖人群的脉压与新发糖尿病的关联研究[J]. 中华内分泌代谢杂志, 2021, 37(8): 702-708. DOI: 10.3760/cma.j.cn311282-20201126-00785.
|
| [11] |
|
| [12] |
岳博成,侯旗旗,韩全乐,等. 高血压人群罹患心房颤动对于新发心肌梗死发病风险的影响研究[J]. 中国全科医学, 2023, 26(14): 1739-1744. DOI: 10.12114/j.issn.1007-9572.2022.0734.
|
| [13] |
|
| [14] |
李刘欣,朱辰蕊,林黎明,等. 不同血压水平对青年人群早发脑卒中风险的影响[J]. 中华高血压杂志, 2022, 30(11): 1061-1068. DOI: 10.16439/j.issn.1673-7245.2022.11.013.
|
| [15] |
中华医学会糖尿病学分会. 中国2型糖尿病防治指南(2020年版)[J]. 中华内分泌代谢杂志, 2021, 37(4): 311-398. DOI: 10.3760/cma.j.cn311282-20210304-00142.
|
| [16] |
张晨旭,谢峰,林振,等. 基于组轨迹模型及其研究进展[J]. 中国卫生统计, 2020, 37(6): 946-949. DOI: 10.3969/j.issn.1002-3674.2020.06.039.
|
| [17] |
邹楷雯,王艳红,王丽. 群组轨迹模型在系统性红斑狼疮研究队列中的应用[J]. 中华临床免疫和变态反应杂志, 2024, 18(2): 131-136. DOI: 10.3969/j.issn.1673-8705.2024.02.005.
|
| [18] |
凡如. 体检人群中血压的分类识别及纵向轨迹分析[D]. 南京: 东南大学, 2022.
|
| [19] |
|
| [20] |
|
| [21] |
|
| [22] |
|
| [23] |
|
| [24] |
|
| [25] |
|
| [26] |
|
| [27] |
黄嘉怡,冯颖青. 血压变异性与主要心脑血管疾病发生及预后的研究进展[J]. 岭南心血管病杂志, 2020, 26(2): 235-238, 247. DOI: 10.3969/j.issn.1007-9688.2020.02.23.
|
| [28] |
|
| [29] |
|
| [30] |
|
| [31] |
|
| [32] |
张晶,丛洪良,曹路,等. 中老年正常高值血压人群中高同型半胱氨酸血症与脉压及冠状动脉粥样硬化性心脏病的关系[J]. 中华高血压杂志, 2019, 27(1): 70-73.
|
| [33] |
|
| [34] |
|
| [35] |
迟相林. 收缩压重要还是舒张压重要?如何治疗单纯收缩期高血压和单纯舒张期高血压?[J]. 中华高血压杂志, 2019, 27(7): 615-621.
|
| [36] |
|
| [37] |
|
| [38] |
|
| [39] |
|
| [1] | FAN Zhuanzhuan, LI Wenting, MA Guoliang. Relationship between the Chinese Visceral Adipose Index and Cardiovascular Disease in Postmenopausal Women: a Prospective Cohort Study [J]. Chinese General Practice, 2026, 29(02): 180-187. |
| [2] | ZHANG Shu, CHENG Yu, WU Shouling, CHEN Shuohua, WU Yuntao. The Impact of Cumulative Plasma Atherogenic Index Exposure on Incident Cardiovascular Disease in Non-Diabetic Individuals: a Cohort Study [J]. Chinese General Practice, 2025, 28(36): 4558-4565. |
| [3] | LIU Ruiyue, YANG Xuemei, ZHAO Naihui, WEN Xinran, CAI Xi, LIANG Yajing, MA Jiajia, WU Shouling, CUI Liufu. The Impact of the Ratio of High-sensitivity C-reactive Protein to Albumin on Incident Cardiovascular Disease in Different Age Groups: a Cohort Study [J]. Chinese General Practice, 2025, 28(36): 4566-4577. |
| [4] | ZHANG Ying, LIAO Xiaoyang, YANG Hanfei, YU Yongjun, LIU Lidi, JIA Yu, SHEN Can, LI Xiao, HUANG Chuanying, YANG Rong. Interpretation of the 2024 International Society of Hypertension Position Paper on Innovations in Blood Pressure Measurement and Reporting Technology and Its Implications for China [J]. Chinese General Practice, 2025, 28(36): 4541-4549. |
| [5] | ZHAO Zhuo, WANG He. Research Progress on the Mechanism of HIF-2α in Cardiovascular Diseases [J]. Chinese General Practice, 2025, 28(33): 4241-4248. |
| [6] | WANG Biyou, GAO Ying, YOU Junfang, LIU Li, ZHANG Qing, SU Haiyan. Canonical Correlation Analysis of Lipid Ratios and Inflammatory Markers in Individuals at Risk of Cardiovascular Disease [J]. Chinese General Practice, 2025, 28(33): 4132-4139. |
| [7] | CHEN Huilong, LIAO Yunchu, LIU Yuwei, KONG Zhenghui, HUANG Xinghui, XU Jiahui, QI Na, WANG Yuanping, LIANG Wenjian. Association between Relative Fat Mass and Cardiovascular Disease in Middle-aged and Elderly Population: a Cross-sectional and Longitudinal Study Based on CHARLS [J]. Chinese General Practice, 2025, 28(32): 4047-4054. |
| [8] | LIU Mingbo, HE Xinye, YANG Xiaohong, WANG Zengwu. Interpretation of Report on Cardiovascular Health and Diseases in China 2024 [J]. Chinese General Practice, 2025, 28(32): 3989-4008. |
| [9] | ZHOU Sheng, DENG Changsheng, ZOU Guanyang, SONG Jianping. Research Progress on the Pathogenesis of Complications of Malaria in Cardiovascular Diseases [J]. Chinese General Practice, 2025, 28(27): 3466-3472. |
| [10] | XIANG Xinyue, ZHANG Bingqing, OUYANG Yuqin, TANG Wenjuan, FENG Wenhuan. Impact of Short-term Medical Weight Loss on Atherosclerotic Cardiovascular Disease Risk in Patients with Obesity [J]. Chinese General Practice, 2025, 28(26): 3229-3239. |
| [11] | LIU Yinyin, SUI Hongping, LI Tingting, JIANG Tongtong, SHI Tieying, XIA Yunlong. Advances in Risk Prediction Models for Cardiotoxicity Associated with Breast Cancer Treatment [J]. Chinese General Practice, 2025, 28(24): 3072-3078. |
| [12] | PAN Yaojia, FU Fanglin, HAN Zheng, SUN Meng, GU Huaicong, WANG Weiqiang. Correlation of the Type of Obesity with the Cardiometabolic Multimorbidity: a Study in Male and Female Middle-aged Residents in Anhui Province [J]. Chinese General Practice, 2025, 28(18): 2285-2293. |
| [13] | HAN Zheng, SUN Meng, FU Fanglin, PAN Yaojia, WANG Weiqiang. A Study on the Relationship between the Triglyceride-Glucose Index and Cardiometabolic Multimorbidity in Individuals Aged 50 and Above [J]. Chinese General Practice, 2025, 28(18): 2278-2284. |
| [14] | ZHANG Bingqing, WANG Zhongkai, WU Changyong, SUN Huang, LI Ruijie, LIU Wenjie, LUO Yihua, ZHENG Lihui, PENG Yunzhu. Changes and Trend Prediction in the Global Burden of Congenital Heart Defects, 1990-2021 [J]. Chinese General Practice, 2025, 28(18): 2253-2261. |
| [15] | AN Qinyu, WANG Yiying, ZHANG Xiaodan, ZHANG Tianlin, ZHAN Qingqing, ZHANG Fuyan, LIU Tao, WU Yanli. Prospective Cohort Study of the Impact of Socioeconomic Status and Healthy Lifestyle on Cardiovascular Disease [J]. Chinese General Practice, 2025, 28(16): 2017-2024. |
| Viewed | ||||||
|
Full text |
|
|||||
|
Abstract |
|
|||||