
Chinese General Practice ›› 2025, Vol. 28 ›› Issue (36): 4566-4577.DOI: 10.12114/j.issn.1007-9572.2024.0521
Special Issue: 心血管最新文章合辑
• Article • Previous Articles Next Articles
Received:2024-11-04
Revised:2025-06-30
Published:2025-12-20
Online:2025-12-04
Contact:
CUI Liufu
通讯作者:
崔刘福
作者简介:作者贡献:
刘瑞越负责论文起草,研究的实施,数据收集、采集、清洗和统计学分析、绘制图表;杨雪梅负责提出研究思路,设计研究方案,研究命题的提出、设计;赵乃慧、温薪冉、蔡汐、梁雅靖、马佳佳负责数据收集、采集、清洗;吴寿岭、崔刘福负责文章的质量控制与审查,对文章整体负责,监督管理。
Add to citation manager EndNote|Ris|BibTeX
URL: https://www.chinagp.net/EN/10.12114/j.issn.1007-9572.2024.0521
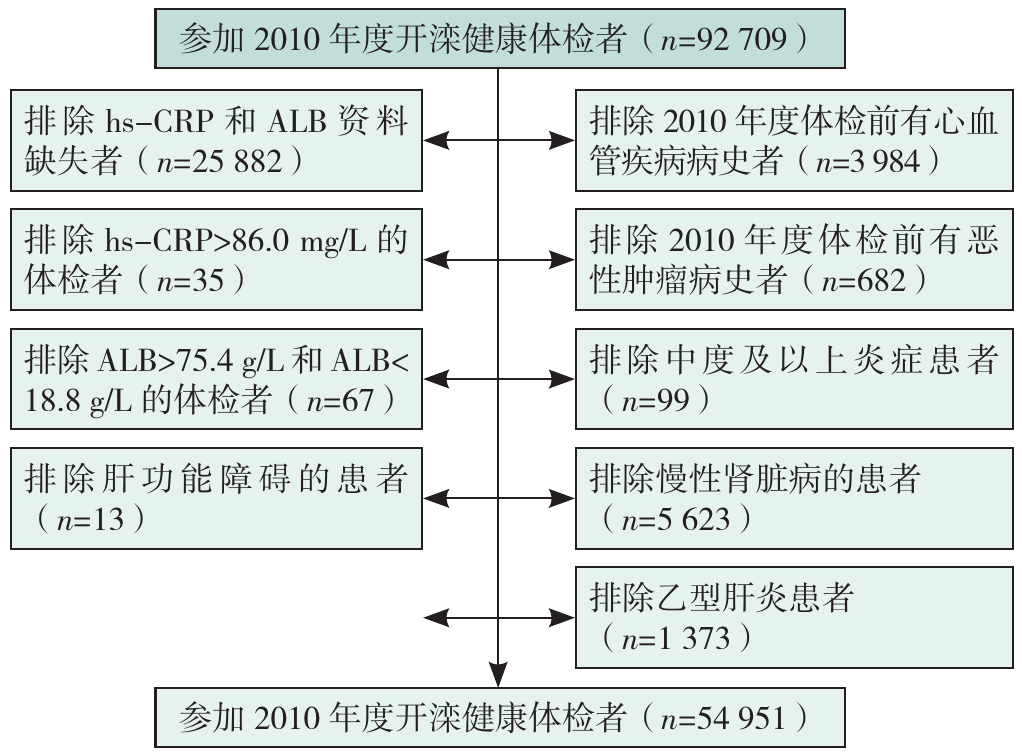
Figure 1 The flow chart of the inclusion and exclusion
| 组别 | 例数 | 年龄(岁) | 性别(男/女) | 接受高等教育[例(%)] | 吸烟[例(%)] | 饮酒[例(%)] | 体育锻炼[例(%)] | BMI(kg/m2) | hs-CRP[M(P25,P75),mg/L] | LDL-C(mmol/L) | HDL-C(mmol/L) | ||
|---|---|---|---|---|---|---|---|---|---|---|---|---|---|
| Q1组 | 13 744 | 49.9±13.4 | 10 039/3 705 | 3 279(23.9) | 4 300(31.3) | 635(4.6) | 1 807(13.1) | 23.8±3.1 | 0.3(0.1,0.5) | 2.3±0.9 | 1.6±0.5 | ||
| Q2组 | 13 731 | 52.4±12.6 | 9 850/3 881 | 2 533(18.4) | 4 476(32.6) | 732(5.3) | 2 319(16.9) | 24.6±3.1 | 0.9(0.7,1.0) | 2.6±0.8 | 1.7±0.5 | ||
| Q3组 | 13 736 | 52.1±12.3 | 10 522/3 214 | 2 210(16.1) | 4 618(33.6) | 712(5.2) | 1 840(13.4) | 25.5±3.3 | 1.8(1.4,2.2) | 2.6±1.0 | 1.5±0.4 | ||
| Q4组 | 13 740 | 52.4±12.7 | 10 672/3 068 | 1 934(14.1) | 4 741(34.5) | 606(4.4) | 1 527(11.1) | 25.9±3.6 | 4.7(3.5,7.1) | 2.5±1.0 | 1.5±0.4 | ||
| 检验统计量值 | 125.58a | 174.45b | 495.66b | 35.72b | 17.24b | 201.06b | 1 155.63a | 51 340.37c | 237.46a | 630.80a | |||
| P值 | <0.01 | <0.01 | <0.01 | <0.01 | <0.01 | <0.01 | <0.01 | <0.01 | <0.01 | <0.01 | |||
| 组别 | TC(mmol/L) | TG[M(P25,P75),mmol/L] | 收缩压(mmHg) | 舒张压(mmHg) | 糖尿病[例(%)] | 高血压[例(%)] | 服用降压药[例(%)] | 服用降糖药[例(%)] | 服用降脂药[例(%)] | eGFR[mL·min-1·(1.73 m2)-1] | ALT(U/L) | ALB(g/L) | lgCAR |
| Q1组 | 4.9±1.0 | 1.1(0.8,1.7) | 125±19 | 82±11 | 1 057(7.7) | 6 219(45.2) | 1 421(10.3) | 465(3.4) | 137(1.0) | 99.3±17.0 | 19.1±13.3 | 46.6±2.8 | -5.6±1.5 |
| Q2组 | 4.9±1.0 | 1.3(0.9,1.8) | 128±19 | 83±11 | 1 344(9.8) | 7 361(53.6) | 1 999(14.6) | 561(4.1) | 215(1.6) | 97.1±16.3 | 20.5±14.2 | 46.6±3.1 | -4.0±0.2 |
| Q3组 | 5.0±1.0 | 1.4(1.0,2.1) | 131±19 | 85±11 | 1 596(11.6) | 8 231(59.9) | 2 075(15.1) | 582(4.2) | 209(1.5) | 94.0±17.8 | 22.8±17.9 | 46.6±3.2 | -3.3±0.2 |
| Q4组 | 5.0±1.0 | 1.4(0.9,2.1) | 132±19 | 85±11 | 1 916(13.9) | 8 636(62.9) | 2 364(17.2) | 603(4.4) | 221(1.6) | 92.0±17.8 | 23.7±18.8 | 46.4±3.1 | -2.2±0.6 |
| 检验统计量值 | 66.70a | 1 266.77c | 331.12a | 295.96a | 304.03b | 1 013.67b | 278.58b | 21.09b | 24.11b | 487.64a | 237.17a | 12.50a | 44 981.90a |
| P值 | <0.01 | <0.01 | <0.01 | <0.01 | <0.01 | <0.01 | <0.01 | <0.01 | <0.01 | <0.01 | <0.01 | <0.01 | <0.01 |
Table 1 Baseline characteristics of different CAR groups in the total population
| 组别 | 例数 | 年龄(岁) | 性别(男/女) | 接受高等教育[例(%)] | 吸烟[例(%)] | 饮酒[例(%)] | 体育锻炼[例(%)] | BMI(kg/m2) | hs-CRP[M(P25,P75),mg/L] | LDL-C(mmol/L) | HDL-C(mmol/L) | ||
|---|---|---|---|---|---|---|---|---|---|---|---|---|---|
| Q1组 | 13 744 | 49.9±13.4 | 10 039/3 705 | 3 279(23.9) | 4 300(31.3) | 635(4.6) | 1 807(13.1) | 23.8±3.1 | 0.3(0.1,0.5) | 2.3±0.9 | 1.6±0.5 | ||
| Q2组 | 13 731 | 52.4±12.6 | 9 850/3 881 | 2 533(18.4) | 4 476(32.6) | 732(5.3) | 2 319(16.9) | 24.6±3.1 | 0.9(0.7,1.0) | 2.6±0.8 | 1.7±0.5 | ||
| Q3组 | 13 736 | 52.1±12.3 | 10 522/3 214 | 2 210(16.1) | 4 618(33.6) | 712(5.2) | 1 840(13.4) | 25.5±3.3 | 1.8(1.4,2.2) | 2.6±1.0 | 1.5±0.4 | ||
| Q4组 | 13 740 | 52.4±12.7 | 10 672/3 068 | 1 934(14.1) | 4 741(34.5) | 606(4.4) | 1 527(11.1) | 25.9±3.6 | 4.7(3.5,7.1) | 2.5±1.0 | 1.5±0.4 | ||
| 检验统计量值 | 125.58a | 174.45b | 495.66b | 35.72b | 17.24b | 201.06b | 1 155.63a | 51 340.37c | 237.46a | 630.80a | |||
| P值 | <0.01 | <0.01 | <0.01 | <0.01 | <0.01 | <0.01 | <0.01 | <0.01 | <0.01 | <0.01 | |||
| 组别 | TC(mmol/L) | TG[M(P25,P75),mmol/L] | 收缩压(mmHg) | 舒张压(mmHg) | 糖尿病[例(%)] | 高血压[例(%)] | 服用降压药[例(%)] | 服用降糖药[例(%)] | 服用降脂药[例(%)] | eGFR[mL·min-1·(1.73 m2)-1] | ALT(U/L) | ALB(g/L) | lgCAR |
| Q1组 | 4.9±1.0 | 1.1(0.8,1.7) | 125±19 | 82±11 | 1 057(7.7) | 6 219(45.2) | 1 421(10.3) | 465(3.4) | 137(1.0) | 99.3±17.0 | 19.1±13.3 | 46.6±2.8 | -5.6±1.5 |
| Q2组 | 4.9±1.0 | 1.3(0.9,1.8) | 128±19 | 83±11 | 1 344(9.8) | 7 361(53.6) | 1 999(14.6) | 561(4.1) | 215(1.6) | 97.1±16.3 | 20.5±14.2 | 46.6±3.1 | -4.0±0.2 |
| Q3组 | 5.0±1.0 | 1.4(1.0,2.1) | 131±19 | 85±11 | 1 596(11.6) | 8 231(59.9) | 2 075(15.1) | 582(4.2) | 209(1.5) | 94.0±17.8 | 22.8±17.9 | 46.6±3.2 | -3.3±0.2 |
| Q4组 | 5.0±1.0 | 1.4(0.9,2.1) | 132±19 | 85±11 | 1 916(13.9) | 8 636(62.9) | 2 364(17.2) | 603(4.4) | 221(1.6) | 92.0±17.8 | 23.7±18.8 | 46.4±3.1 | -2.2±0.6 |
| 检验统计量值 | 66.70a | 1 266.77c | 331.12a | 295.96a | 304.03b | 1 013.67b | 278.58b | 21.09b | 24.11b | 487.64a | 237.17a | 12.50a | 44 981.90a |
| P值 | <0.01 | <0.01 | <0.01 | <0.01 | <0.01 | <0.01 | <0.01 | <0.01 | <0.01 | <0.01 | <0.01 | <0.01 | <0.01 |
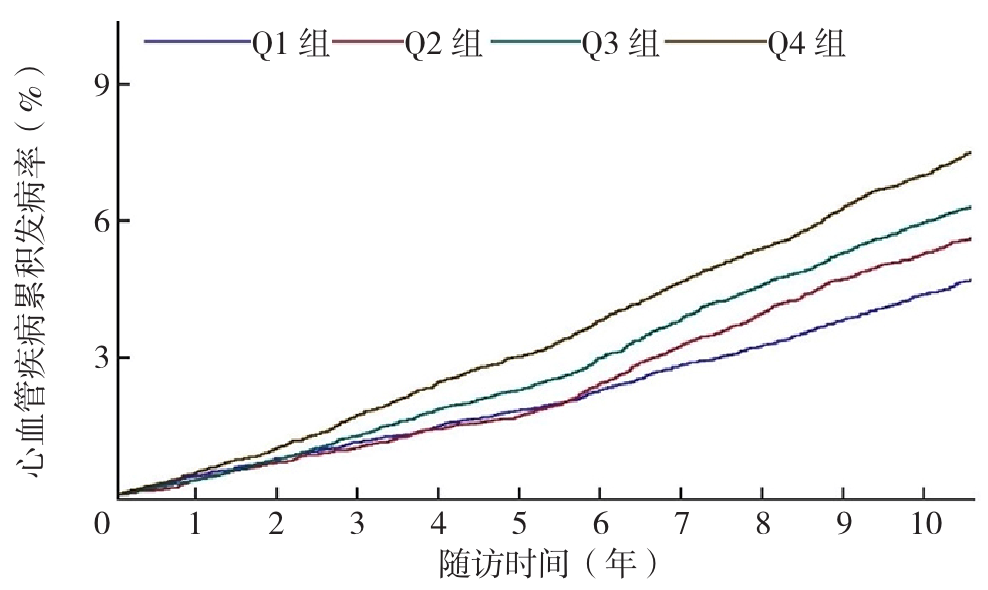
Figure 2 Kaplan-Meier survival analysis curves of cumulative incidence of CVD in different CAR groups
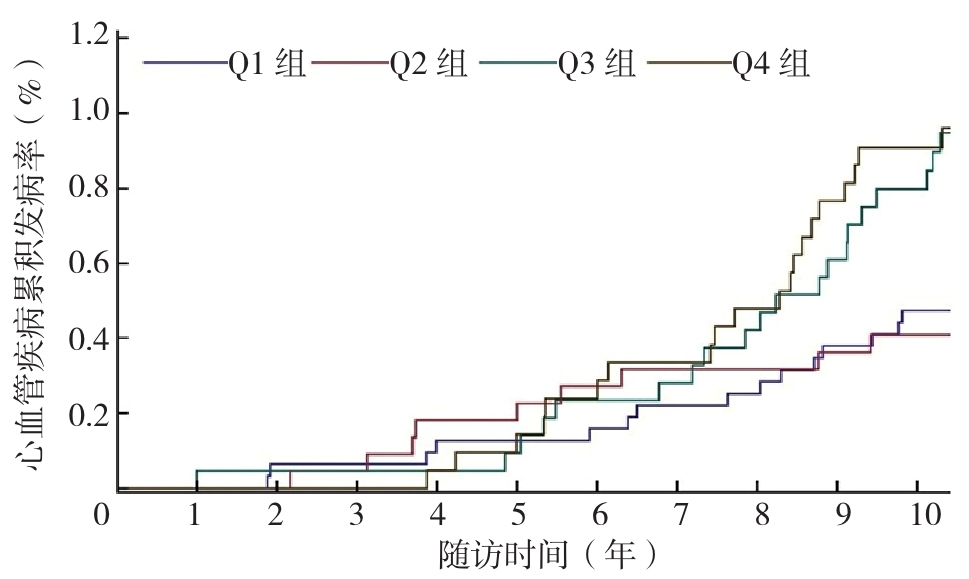
Figure 2 Kaplan-Meier survival analysis curves of cumulative incidence of CVD in different CAR groups in people under 40 years old
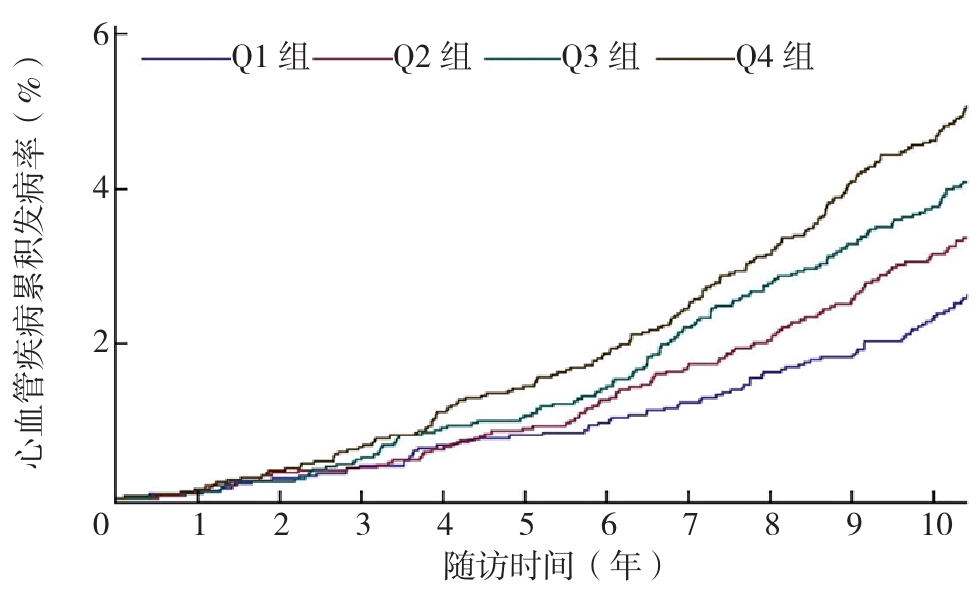
Figure 4 Kaplan-Meier survival analysis curves of cumulative incidence of CVD in different CAR groups in people aged 40-49 years
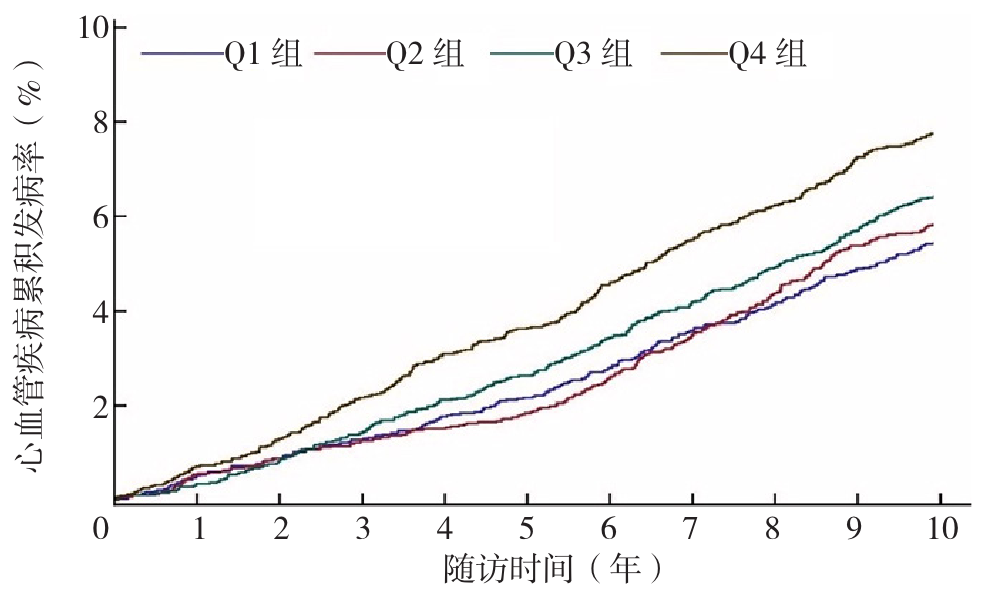
Figure 5 Kaplan-Meier survival analysis curves of cumulative incidence of CVD in different CAR groups in people aged 50-59 years
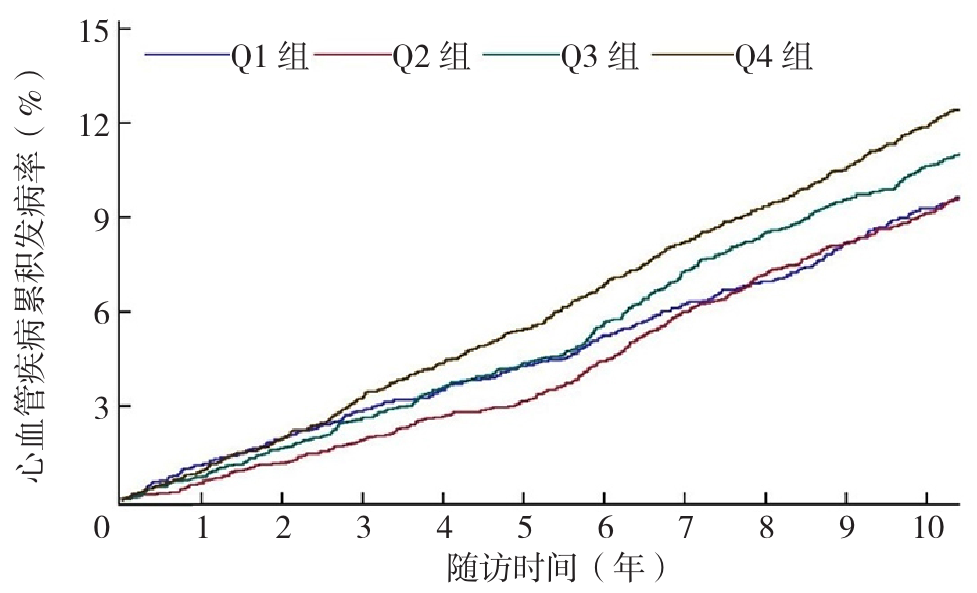
Figure 6 Kaplan-Meier survival analysis curves of cumulative incidence of CVD in people over 60 years old in different CAR groups
| 分组 | CVD发病人数(例) | 总人数(例) | 累积发病率(%) | 发病密度(例/千人年) |
|---|---|---|---|---|
| 总人群 | ||||
| Q1组 | 659 | 13 744 | 4.79 | 4.62 |
| Q2组 | 809 | 13 731 | 5.89 | 5.64 |
| Q3组 | 901 | 13 736 | 6.56 | 6.30 |
| Q4组 | 1 075 | 13 740 | 7.82 | 7.60 |
| <40岁 | ||||
| Q1组 | 17 | 3 168 | 0.54 | 0.50 |
| Q2组 | 10 | 2 212 | 0.45 | 0.41 |
| Q3组 | 25 | 2 143 | 1.17 | 1.06 |
| Q4组 | 29 | 2 094 | 1.38 | 1.25 |
| 40~49岁 | ||||
| Q1组 | 88 | 3 084 | 2.85 | 2.64 |
| Q2组 | 115 | 3 016 | 3.81 | 3.52 |
| Q3组 | 146 | 3 196 | 4.57 | 4.21 |
| Q4组 | 195 | 3 337 | 5.84 | 5.40 |
| 50~59岁 | ||||
| Q1组 | 261 | 4 326 | 6.03 | 5.81 |
| Q2组 | 280 | 4 324 | 6.48 | 6.15 |
| Q3组 | 329 | 4 666 | 7.05 | 6.72 |
| Q4组 | 392 | 4 424 | 8.86 | 8.55 |
| ≥60岁 | ||||
| Q1组 | 293 | 3 166 | 9.25 | 9.74 |
| Q2组 | 404 | 4 179 | 9.67 | 9.87 |
| Q3组 | 401 | 3 731 | 10.75 | 11.23 |
| Q4组 | 459 | 3 885 | 11.81 | 12.68 |
Table 2 Incidence of CVD in each age stratum of Q1-Q4 groups
| 分组 | CVD发病人数(例) | 总人数(例) | 累积发病率(%) | 发病密度(例/千人年) |
|---|---|---|---|---|
| 总人群 | ||||
| Q1组 | 659 | 13 744 | 4.79 | 4.62 |
| Q2组 | 809 | 13 731 | 5.89 | 5.64 |
| Q3组 | 901 | 13 736 | 6.56 | 6.30 |
| Q4组 | 1 075 | 13 740 | 7.82 | 7.60 |
| <40岁 | ||||
| Q1组 | 17 | 3 168 | 0.54 | 0.50 |
| Q2组 | 10 | 2 212 | 0.45 | 0.41 |
| Q3组 | 25 | 2 143 | 1.17 | 1.06 |
| Q4组 | 29 | 2 094 | 1.38 | 1.25 |
| 40~49岁 | ||||
| Q1组 | 88 | 3 084 | 2.85 | 2.64 |
| Q2组 | 115 | 3 016 | 3.81 | 3.52 |
| Q3组 | 146 | 3 196 | 4.57 | 4.21 |
| Q4组 | 195 | 3 337 | 5.84 | 5.40 |
| 50~59岁 | ||||
| Q1组 | 261 | 4 326 | 6.03 | 5.81 |
| Q2组 | 280 | 4 324 | 6.48 | 6.15 |
| Q3组 | 329 | 4 666 | 7.05 | 6.72 |
| Q4组 | 392 | 4 424 | 8.86 | 8.55 |
| ≥60岁 | ||||
| Q1组 | 293 | 3 166 | 9.25 | 9.74 |
| Q2组 | 404 | 4 179 | 9.67 | 9.87 |
| Q3组 | 401 | 3 731 | 10.75 | 11.23 |
| Q4组 | 459 | 3 885 | 11.81 | 12.68 |
| 分组 | 模型1 | 模型2 | 模型3 | 模型4 | ||||
|---|---|---|---|---|---|---|---|---|
| HR(95%CI) | P(P趋势)值 | HR(95%CI) | P(P趋势)值 | HR(95%CI) | P(P趋势)值 | HR(95%CI) | P(P趋势)值 | |
| 总人群 | <0.01a | <0.01a | <0.01a | <0.01a | ||||
| Q1组 | 1.00 | 1.00 | 1.00 | 1.00 | ||||
| Q2组 | 1.11(1.00~1.23) | 0.04 | 1.05(0.94~1.16) | 0.38 | 1.04(0.94~1.15) | 0.45 | 1.04(0.93~1.15) | 0.51 |
| Q3组 | 1.26(1.14~1.39) | <0.01 | 1.11(1.00~1.23) | 0.03 | 1.11(1.00~1.23) | 0.04 | 1.10(0.99~1.22) | 0.07 |
| Q4组 | 1.49(1.35~1.64) | <0.01 | 1.27(1.15~1.40) | <0.01 | 1.26(1.15~1.40) | <0.01 | 1.20(1.07~1.35) | <0.01 |
| <40岁 | <0.01a | 0.08a | 0.06a | 0.35a | ||||
| Q1组 | 1.00 | 1.00 | 1.00 | 1.00 | ||||
| Q2组 | 0.64(0.28~1.43) | 0.27 | 0.57(0.25~1.28) | 0.17 | 0.56(0.25~1.26) | 0.16 | 0.55(0.24~1.23) | 0.14 |
| Q3组 | 1.65(0.89~3.07) | 0.11 | 1.31(0.70~2.46) | 0.39 | 1.36(0.72~2.55) | 0.33 | 1.28(0.68~2.42) | 0.44 |
| Q4组 | 1.92(1.05~3.51) | 0.03 | 1.44(0.77~2.69) | 0.25 | 1.47(0.79~2.75) | 0.22 | 1.13(0.55~2.33) | 0.74 |
| 40~49岁 | <0.01a | <0.01a | <0.01a | 0.03a | ||||
| Q1组 | 1.00 | 1.00 | 1.00 | 1.00 | ||||
| Q2组 | 1.29(0.98~1.70) | 0.07 | 1.21(0.92~1.60) | 0.17 | 1.21(0.92~1.60) | 0.17 | 1.21(0.91~1.60) | 0.18 |
| Q3组 | 1.42(1.09~1.85) | 0.01 | 1.22(0.93~1.59) | 0.14 | 1.23(0.94~1.61) | 0.12 | 1.22(0.93~1.60) | 0.14 |
| Q4组 | 1.76(1.36~2.26) | <0.01 | 1.45(1.12~1.87) | 0.01 | 1.47(1.14~1.91) | <0.01 | 1.44(1.06~1.96) | 0.02 |
| 50~59岁 | <0.01a | <0.01a | <0.01a | 0.04a | ||||
| Q1组 | 1.00 | 1.00 | 1.00 | 1.00 | ||||
| Q2组 | 1.13(0.95~1.33) | 0.16 | 1.06(0.90~1.26) | 0.48 | 1.06(0.90~1.26) | 0.49 | 1.06(0.90~1.26) | 0.49 |
| Q3组 | 1.17(0.99~1.38) | 0.05 | 1.04(0.88~1.22) | 0.67 | 1.03(0.88~1.22) | 0.68 | 1.03(0.87~1.22) | 0.72 |
| Q4组 | 1.48(1.27~1.73) | <0.01 | 1.27(1.08~1.49) | <0.01 | 1.26(1.08~1.48) | <0.01 | 1.24(1.02~1.50) | 0.03 |
| ≥60岁 | <0.01a | <0.01a | <0.01a | 0.13a | ||||
| Q1组 | 1.00 | 1.00 | 1.00 | 1.00 | ||||
| Q2组 | 1.03(0.89~1.20) | 0.70 | 0.99(0.85~1.15) | 0.91 | 0.98(0.85~1.14) | 0.82 | 0.98(0.84~1.13) | 0.73 |
| Q3组 | 1.19(1.02~1.38) | 0.02 | 1.11(0.95~1.29) | 0.18 | 1.10(0.95~1.28) | 0.20 | 1.08(0.93~1.26) | 0.33 |
| Q4组 | 1.33(1.15~1.54) | <0.01 | 1.21(1.05~1.41) | 0.01 | 1.20(1.03~1.39) | 0.01 | 1.11(0.93~1.33) | 0.24 |
Table 3 Cox proportional hazards model analysis results of CVD incidence in the total population and different age groups in different CAR groups
| 分组 | 模型1 | 模型2 | 模型3 | 模型4 | ||||
|---|---|---|---|---|---|---|---|---|
| HR(95%CI) | P(P趋势)值 | HR(95%CI) | P(P趋势)值 | HR(95%CI) | P(P趋势)值 | HR(95%CI) | P(P趋势)值 | |
| 总人群 | <0.01a | <0.01a | <0.01a | <0.01a | ||||
| Q1组 | 1.00 | 1.00 | 1.00 | 1.00 | ||||
| Q2组 | 1.11(1.00~1.23) | 0.04 | 1.05(0.94~1.16) | 0.38 | 1.04(0.94~1.15) | 0.45 | 1.04(0.93~1.15) | 0.51 |
| Q3组 | 1.26(1.14~1.39) | <0.01 | 1.11(1.00~1.23) | 0.03 | 1.11(1.00~1.23) | 0.04 | 1.10(0.99~1.22) | 0.07 |
| Q4组 | 1.49(1.35~1.64) | <0.01 | 1.27(1.15~1.40) | <0.01 | 1.26(1.15~1.40) | <0.01 | 1.20(1.07~1.35) | <0.01 |
| <40岁 | <0.01a | 0.08a | 0.06a | 0.35a | ||||
| Q1组 | 1.00 | 1.00 | 1.00 | 1.00 | ||||
| Q2组 | 0.64(0.28~1.43) | 0.27 | 0.57(0.25~1.28) | 0.17 | 0.56(0.25~1.26) | 0.16 | 0.55(0.24~1.23) | 0.14 |
| Q3组 | 1.65(0.89~3.07) | 0.11 | 1.31(0.70~2.46) | 0.39 | 1.36(0.72~2.55) | 0.33 | 1.28(0.68~2.42) | 0.44 |
| Q4组 | 1.92(1.05~3.51) | 0.03 | 1.44(0.77~2.69) | 0.25 | 1.47(0.79~2.75) | 0.22 | 1.13(0.55~2.33) | 0.74 |
| 40~49岁 | <0.01a | <0.01a | <0.01a | 0.03a | ||||
| Q1组 | 1.00 | 1.00 | 1.00 | 1.00 | ||||
| Q2组 | 1.29(0.98~1.70) | 0.07 | 1.21(0.92~1.60) | 0.17 | 1.21(0.92~1.60) | 0.17 | 1.21(0.91~1.60) | 0.18 |
| Q3组 | 1.42(1.09~1.85) | 0.01 | 1.22(0.93~1.59) | 0.14 | 1.23(0.94~1.61) | 0.12 | 1.22(0.93~1.60) | 0.14 |
| Q4组 | 1.76(1.36~2.26) | <0.01 | 1.45(1.12~1.87) | 0.01 | 1.47(1.14~1.91) | <0.01 | 1.44(1.06~1.96) | 0.02 |
| 50~59岁 | <0.01a | <0.01a | <0.01a | 0.04a | ||||
| Q1组 | 1.00 | 1.00 | 1.00 | 1.00 | ||||
| Q2组 | 1.13(0.95~1.33) | 0.16 | 1.06(0.90~1.26) | 0.48 | 1.06(0.90~1.26) | 0.49 | 1.06(0.90~1.26) | 0.49 |
| Q3组 | 1.17(0.99~1.38) | 0.05 | 1.04(0.88~1.22) | 0.67 | 1.03(0.88~1.22) | 0.68 | 1.03(0.87~1.22) | 0.72 |
| Q4组 | 1.48(1.27~1.73) | <0.01 | 1.27(1.08~1.49) | <0.01 | 1.26(1.08~1.48) | <0.01 | 1.24(1.02~1.50) | 0.03 |
| ≥60岁 | <0.01a | <0.01a | <0.01a | 0.13a | ||||
| Q1组 | 1.00 | 1.00 | 1.00 | 1.00 | ||||
| Q2组 | 1.03(0.89~1.20) | 0.70 | 0.99(0.85~1.15) | 0.91 | 0.98(0.85~1.14) | 0.82 | 0.98(0.84~1.13) | 0.73 |
| Q3组 | 1.19(1.02~1.38) | 0.02 | 1.11(0.95~1.29) | 0.18 | 1.10(0.95~1.28) | 0.20 | 1.08(0.93~1.26) | 0.33 |
| Q4组 | 1.33(1.15~1.54) | <0.01 | 1.21(1.05~1.41) | 0.01 | 1.20(1.03~1.39) | 0.01 | 1.11(0.93~1.33) | 0.24 |
| 分组 | 模型1 | 模型2 | 模型3 | 模型4 | ||||
|---|---|---|---|---|---|---|---|---|
| HR(95%CI) | P(P趋势)值 | HR(95%CI) | P(P趋势)值 | HR(95%CI) | P(P趋势)值 | HR(95%CI) | P(P趋势)值 | |
| 总人群 | <0.01a | <0.01a | <0.01a | <0.01a | ||||
| Q1组 | 1.00 | 1.00 | 1.00 | 1.00 | ||||
| Q2组 | 1.07(0.95~1.22) | 0.26 | 1.02(0.90~1.16) | 0.70 | 1.02(0.90~1.16) | 0.74 | 1.02(0.90~1.15) | 0.80 |
| Q3组 | 1.26(1.12~1.42) | <0.01 | 1.12(0.99~1.27) | 0.06 | 1.12(0.99~1.26) | 0.07 | 1.10(0.97~1.25) | 0.12 |
| Q4组 | 1.47(1.30~1.65) | <0.01 | 1.28(1.13~1.44) | <0.01 | 1.27(1.13~1.43) | <0.01 | 1.21(1.04~1.39) | 0.01 |
| <40岁 | 0.26a | 0.80a | 0.79a | 0.96a | ||||
| Q1组 | 1.00 | 1.00 | 1.00 | 1.00 | ||||
| Q2组 | 0.58(0.24~1.42) | 0.23 | 0.52(0.21~1.28) | 0.15 | 0.52(0.21~1.27) | 0.15 | 0.50(0.20~1.24) | 0.13 |
| Q3组 | 1.57(0.80~3.08) | 0.18 | 1.22(0.61~2.43) | 0.57 | 1.24(0.62~2.46) | 0.54 | 1.15(0.58~2.31) | 0.68 |
| Q4组 | 1.17(0.57~2.40) | 0.66 | 0.88(0.42~1.87) | 0.74 | 0.88(0.42~1.86) | 0.73 | 0.65(0.27~2.57) | 0.33 |
| 40~49岁 | <0.01a | <0.01a | <0.01a | 0.01a | ||||
| Q1组 | 1.00 | 1.00 | 1.00 | 1.00 | ||||
| Q2组 | 1.35(0.96~1.90) | 0.08 | 1.29(0.91~1.81) | 0.15 | 1.27(0.90~1.79) | 0.16 | 1.26(0.89~1.78) | 0.18 |
| Q3组 | 1.49(1.07~2.07) | 0.01 | 1.33(0.95~1.85) | 0.09 | 1.32(0.95~1.84) | 0.10 | 1.30(0.93~1.81) | 0.12 |
| Q4组 | 2.01(1.47~2.73) | <0.01 | 1.73(1.26~2.37) | <0.01 | 1.73(1.26~2.37) | <0.01 | 1.62(1.12~2.34) | 0.01 |
| 50~59岁 | <0.01a | 0.05a | 0.07a | 0.22a | ||||
| Q1组 | 1.00 | 1.00 | 1.00 | 1.00 | ||||
| Q2组 | 1.00(0.82~1.23) | 0.96 | 0.96(0.78~1.18) | 0.71 | 0.96(0.78~1.18) | 0.69 | 0.97(0.79~1.19) | 0.75 |
| Q3组 | 1.05(0.86~1.27) | 0.65 | 0.94(0.77~1.14) | 0.51 | 0.93(0.76~1.14) | 0.48 | 0.94(0.77~1.15) | 0.53 |
| Q4组 | 1.39(1.15~1.68) | <0.01 | 1.22(1.00~1.47) | 0.04 | 1.21(0.99~1.46) | 0.05 | 1.23(0.97~1.57) | 0.08 |
| ≥60岁 | <0.01a | <0.01a | <0.01a | 0.13a | ||||
| Q1组 | 1.00 | 1.00 | 1.00 | 1.00 | ||||
| Q2组 | 1.05(0.87~1.25) | 0.63 | 1.01(0.84~1.21) | 0.92 | 1.00(0.84~1.20) | 0.97 | 0.99(0.83~1.19) | 0.95 |
| Q3组 | 1.29(1.08~1.54) | 0.01 | 1.19(0.99~1.43) | 0.06 | 1.18(0.99~1.42) | 0.06 | 1.16(0.96~1.39) | 0.11 |
| Q4组 | 1.34(1.12~1.60) | <0.01 | 1.22(0.02~1.47) | 0.02 | 1.21(1.01~1.46) | 0.03 | 1.12(0.90~1.39) | 0.31 |
Table 4 Results of Cox proportional hazards model analysis on the incidence of cvd in different car groups and different age groups after excluding study subjects taking antihypertensive medications
| 分组 | 模型1 | 模型2 | 模型3 | 模型4 | ||||
|---|---|---|---|---|---|---|---|---|
| HR(95%CI) | P(P趋势)值 | HR(95%CI) | P(P趋势)值 | HR(95%CI) | P(P趋势)值 | HR(95%CI) | P(P趋势)值 | |
| 总人群 | <0.01a | <0.01a | <0.01a | <0.01a | ||||
| Q1组 | 1.00 | 1.00 | 1.00 | 1.00 | ||||
| Q2组 | 1.07(0.95~1.22) | 0.26 | 1.02(0.90~1.16) | 0.70 | 1.02(0.90~1.16) | 0.74 | 1.02(0.90~1.15) | 0.80 |
| Q3组 | 1.26(1.12~1.42) | <0.01 | 1.12(0.99~1.27) | 0.06 | 1.12(0.99~1.26) | 0.07 | 1.10(0.97~1.25) | 0.12 |
| Q4组 | 1.47(1.30~1.65) | <0.01 | 1.28(1.13~1.44) | <0.01 | 1.27(1.13~1.43) | <0.01 | 1.21(1.04~1.39) | 0.01 |
| <40岁 | 0.26a | 0.80a | 0.79a | 0.96a | ||||
| Q1组 | 1.00 | 1.00 | 1.00 | 1.00 | ||||
| Q2组 | 0.58(0.24~1.42) | 0.23 | 0.52(0.21~1.28) | 0.15 | 0.52(0.21~1.27) | 0.15 | 0.50(0.20~1.24) | 0.13 |
| Q3组 | 1.57(0.80~3.08) | 0.18 | 1.22(0.61~2.43) | 0.57 | 1.24(0.62~2.46) | 0.54 | 1.15(0.58~2.31) | 0.68 |
| Q4组 | 1.17(0.57~2.40) | 0.66 | 0.88(0.42~1.87) | 0.74 | 0.88(0.42~1.86) | 0.73 | 0.65(0.27~2.57) | 0.33 |
| 40~49岁 | <0.01a | <0.01a | <0.01a | 0.01a | ||||
| Q1组 | 1.00 | 1.00 | 1.00 | 1.00 | ||||
| Q2组 | 1.35(0.96~1.90) | 0.08 | 1.29(0.91~1.81) | 0.15 | 1.27(0.90~1.79) | 0.16 | 1.26(0.89~1.78) | 0.18 |
| Q3组 | 1.49(1.07~2.07) | 0.01 | 1.33(0.95~1.85) | 0.09 | 1.32(0.95~1.84) | 0.10 | 1.30(0.93~1.81) | 0.12 |
| Q4组 | 2.01(1.47~2.73) | <0.01 | 1.73(1.26~2.37) | <0.01 | 1.73(1.26~2.37) | <0.01 | 1.62(1.12~2.34) | 0.01 |
| 50~59岁 | <0.01a | 0.05a | 0.07a | 0.22a | ||||
| Q1组 | 1.00 | 1.00 | 1.00 | 1.00 | ||||
| Q2组 | 1.00(0.82~1.23) | 0.96 | 0.96(0.78~1.18) | 0.71 | 0.96(0.78~1.18) | 0.69 | 0.97(0.79~1.19) | 0.75 |
| Q3组 | 1.05(0.86~1.27) | 0.65 | 0.94(0.77~1.14) | 0.51 | 0.93(0.76~1.14) | 0.48 | 0.94(0.77~1.15) | 0.53 |
| Q4组 | 1.39(1.15~1.68) | <0.01 | 1.22(1.00~1.47) | 0.04 | 1.21(0.99~1.46) | 0.05 | 1.23(0.97~1.57) | 0.08 |
| ≥60岁 | <0.01a | <0.01a | <0.01a | 0.13a | ||||
| Q1组 | 1.00 | 1.00 | 1.00 | 1.00 | ||||
| Q2组 | 1.05(0.87~1.25) | 0.63 | 1.01(0.84~1.21) | 0.92 | 1.00(0.84~1.20) | 0.97 | 0.99(0.83~1.19) | 0.95 |
| Q3组 | 1.29(1.08~1.54) | 0.01 | 1.19(0.99~1.43) | 0.06 | 1.18(0.99~1.42) | 0.06 | 1.16(0.96~1.39) | 0.11 |
| Q4组 | 1.34(1.12~1.60) | <0.01 | 1.22(0.02~1.47) | 0.02 | 1.21(1.01~1.46) | 0.03 | 1.12(0.90~1.39) | 0.31 |
| 分组 | 模型1 | 模型2 | 模型3 | 模型4 | ||||
|---|---|---|---|---|---|---|---|---|
| HR(95%CI) | P(P趋势)值 | HR(95%CI) | P(P趋势)值 | HR(95%CI) | P(P趋势)值 | HR(95%CI) | P(P趋势)值 | |
| 总人群 | <0.01a | <0.01a | <0.01a | <0.01a | ||||
| Q1组 | 1.00 | 1.00 | 1.00 | 1.00 | ||||
| Q2组 | 1.09(0.99~1.22) | 0.09 | 1.03(0.93~1.14) | 0.58 | 1.02(0.92~1.14) | 0.67 | 1.02(0.92~1.13) | 0.74 |
| Q3组 | 1.25(1.13~1.39) | <0.01 | 1.10(1.00~1.22) | 0.06 | 1.10(0.99~1.22) | 0.06 | 1.09(0.98~1.21) | 0.12 |
| Q4组 | 1.48(1.34~1.63) | <0.01 | 1.27(1.15~1.40) | <0.01 | 1.26(1.14~1.39) | <0.01 | 1.19(1.06~1.34) | <0.01 |
| <40岁 | <0.01a | 0.09a | 0.07a | 0.40a | ||||
| Q1组 | 1.00 | 1.00 | 1.00 | 1.00 | ||||
| Q2组 | 0.57(0.25~1.32) | 0.18 | 0.51(0.22~1.17) | 0.11 | 0.50(0.21~1.15) | 0.10 | 0.48(0.21~1.12) | 0.09 |
| Q3组 | 1.60(0.86~2.98) | 0.14 | 1.26(0.67~2.38) | 0.47 | 1.30(0.69~2.46) | 0.41 | 1.22(0.65~2.32) | 0.53 |
| Q4组 | 1.87(1.02~3.43) | 0.04 | 1.39(0.74~2.61) | 0.30 | 1.42(0.75~2.66) | 0.28 | 1.08(0.52~2.24) | 0.83 |
| 40~49岁 | <0.01a | <0.01a | <0.01a | 0.04a | ||||
| Q1组 | 1.00 | 1.00 | 1.00 | 1.00 | ||||
| Q2组 | 1.34(1.01~1.78) | 0.04 | 1.26(0.95~1.68) | 0.10 | 1.26(0.95~1.67) | 0.11 | 1.25(0.94~1.66) | 0.12 |
| Q3组 | 1.45(1.11~1.91) | 0.01 | 1.25(0.95~1.65) | 0.11 | 1.26(0.96~1.66) | 0.10 | 1.24(0.94~1.64) | 0.12 |
| Q4组 | 1.77(1.36~2.30) | <0.01 | 1.47(1.12~1.91) | 0.01 | 1.49(1.14~1.95) | <0.01 | 1.43(1.04~1.96) | 0.02 |
| 50~59岁 | <0.01a | <0.01a | <0.01a | 0.04a | ||||
| Q1组 | 1.00 | 1.00 | 1.00 | 1.00 | ||||
| Q2组 | 1.12(0.94~1.33) | 0.21 | 1.05(0.89~1.25) | 0.55 | 1.05(0.89~1.25) | 0.55 | 1.05(0.89~1.25) | 0.55 |
| Q3组 | 1.18(0.99~1.39) | 0.05 | 1.04(0.88~1.23) | 0.63 | 1.04(0.88~1.23) | 0.63 | 1.04(0.88~1.23) | 0.64 |
| Q4组 | 1.49(1.27~1.74) | <0.01 | 1.27(1.08~1.50) | <0.01 | 1.27(1.08~1.49) | <0.01 | 1.26(1.03~1.53) | 0.02 |
| ≥60岁 | <0.01a | <0.01a | <0.01a | 0.19a | ||||
| Q1组 | 1.00 | 1.00 | 1.00 | 1.00 | ||||
| Q2组 | 1.00(0.86~1.16) | 0.97 | 0.96(0.82~1.12) | 0.57 | 0.95(0.81~1.11) | 0.49 | 0.94(0.81~1.10) | 0.42 |
| Q3组 | 1.16(0.99~1.35) | 0.06 | 1.07(0.92~1.25) | 0.36 | 1.07(0.92~1.25) | 0.36 | 1.04(0.89~1.22) | 0.58 |
| Q4组 | 1.32(1.14~1.53) | <0.01 | 1.20(1.03~1.40) | 0.01 | 1.19(1.02~1.38) | 0.02 | 1.09(0.91~1.30) | 0.35 |
Table 5 Results of Cox proportional hazards model analysis on the incidence of cvd in different car groups and different age groups after excluding study subjects taking lipid-lowering medications
| 分组 | 模型1 | 模型2 | 模型3 | 模型4 | ||||
|---|---|---|---|---|---|---|---|---|
| HR(95%CI) | P(P趋势)值 | HR(95%CI) | P(P趋势)值 | HR(95%CI) | P(P趋势)值 | HR(95%CI) | P(P趋势)值 | |
| 总人群 | <0.01a | <0.01a | <0.01a | <0.01a | ||||
| Q1组 | 1.00 | 1.00 | 1.00 | 1.00 | ||||
| Q2组 | 1.09(0.99~1.22) | 0.09 | 1.03(0.93~1.14) | 0.58 | 1.02(0.92~1.14) | 0.67 | 1.02(0.92~1.13) | 0.74 |
| Q3组 | 1.25(1.13~1.39) | <0.01 | 1.10(1.00~1.22) | 0.06 | 1.10(0.99~1.22) | 0.06 | 1.09(0.98~1.21) | 0.12 |
| Q4组 | 1.48(1.34~1.63) | <0.01 | 1.27(1.15~1.40) | <0.01 | 1.26(1.14~1.39) | <0.01 | 1.19(1.06~1.34) | <0.01 |
| <40岁 | <0.01a | 0.09a | 0.07a | 0.40a | ||||
| Q1组 | 1.00 | 1.00 | 1.00 | 1.00 | ||||
| Q2组 | 0.57(0.25~1.32) | 0.18 | 0.51(0.22~1.17) | 0.11 | 0.50(0.21~1.15) | 0.10 | 0.48(0.21~1.12) | 0.09 |
| Q3组 | 1.60(0.86~2.98) | 0.14 | 1.26(0.67~2.38) | 0.47 | 1.30(0.69~2.46) | 0.41 | 1.22(0.65~2.32) | 0.53 |
| Q4组 | 1.87(1.02~3.43) | 0.04 | 1.39(0.74~2.61) | 0.30 | 1.42(0.75~2.66) | 0.28 | 1.08(0.52~2.24) | 0.83 |
| 40~49岁 | <0.01a | <0.01a | <0.01a | 0.04a | ||||
| Q1组 | 1.00 | 1.00 | 1.00 | 1.00 | ||||
| Q2组 | 1.34(1.01~1.78) | 0.04 | 1.26(0.95~1.68) | 0.10 | 1.26(0.95~1.67) | 0.11 | 1.25(0.94~1.66) | 0.12 |
| Q3组 | 1.45(1.11~1.91) | 0.01 | 1.25(0.95~1.65) | 0.11 | 1.26(0.96~1.66) | 0.10 | 1.24(0.94~1.64) | 0.12 |
| Q4组 | 1.77(1.36~2.30) | <0.01 | 1.47(1.12~1.91) | 0.01 | 1.49(1.14~1.95) | <0.01 | 1.43(1.04~1.96) | 0.02 |
| 50~59岁 | <0.01a | <0.01a | <0.01a | 0.04a | ||||
| Q1组 | 1.00 | 1.00 | 1.00 | 1.00 | ||||
| Q2组 | 1.12(0.94~1.33) | 0.21 | 1.05(0.89~1.25) | 0.55 | 1.05(0.89~1.25) | 0.55 | 1.05(0.89~1.25) | 0.55 |
| Q3组 | 1.18(0.99~1.39) | 0.05 | 1.04(0.88~1.23) | 0.63 | 1.04(0.88~1.23) | 0.63 | 1.04(0.88~1.23) | 0.64 |
| Q4组 | 1.49(1.27~1.74) | <0.01 | 1.27(1.08~1.50) | <0.01 | 1.27(1.08~1.49) | <0.01 | 1.26(1.03~1.53) | 0.02 |
| ≥60岁 | <0.01a | <0.01a | <0.01a | 0.19a | ||||
| Q1组 | 1.00 | 1.00 | 1.00 | 1.00 | ||||
| Q2组 | 1.00(0.86~1.16) | 0.97 | 0.96(0.82~1.12) | 0.57 | 0.95(0.81~1.11) | 0.49 | 0.94(0.81~1.10) | 0.42 |
| Q3组 | 1.16(0.99~1.35) | 0.06 | 1.07(0.92~1.25) | 0.36 | 1.07(0.92~1.25) | 0.36 | 1.04(0.89~1.22) | 0.58 |
| Q4组 | 1.32(1.14~1.53) | <0.01 | 1.20(1.03~1.40) | 0.01 | 1.19(1.02~1.38) | 0.02 | 1.09(0.91~1.30) | 0.35 |
| 分组 | 模型1 | 模型2 | 模型3 | 模型4 | ||||
|---|---|---|---|---|---|---|---|---|
| HR(95%CI) | P(P趋势)值 | HR(95%CI) | P(P趋势)值 | HR(95%CI) | P(P趋势)值 | HR(95%CI) | P(P趋势)值 | |
| 总人群 | <0.01a | <0.01a | <0.01a | <0.01a | ||||
| Q1组 | 1.00 | 1.00 | 1.00 | 1.00 | ||||
| Q2组 | 1.13(1.01~1.26) | 0.02 | 1.07(0.96~1.20) | 0.22 | 1.06(0.95~1.19) | 0.28 | 1.06(0.95~1.18) | 0.33 |
| Q3组 | 1.26(1.13~1.40) | <0.01 | 1.12(1.00~1.25) | 0.04 | 1.11(0.99~1.24) | 0.05 | 1.10(0.98~1.22) | 0.10 |
| Q4组 | 1.51(1.36~1.67) | <0.01 | 1.31(1.18~1.46) | <0.01 | 1.30(1.17~1.44) | <0.01 | 1.21(1.07~1.38) | <0.01 |
| <40岁 | 0.01a | 0.15a | 0.12a | 0.48a | ||||
| Q1组 | 1.00 | 1.00 | 1.00 | 1.00 | ||||
| Q2组 | 0.65(0.29~1.45) | 0.28 | 0.57(0.26~1.29) | 0.17 | 0.57(0.25~1.28) | 0.17 | 0.56(0.25~1.25) | 0.15 |
| Q3组 | 1.61(0.86~3.00) | 0.13 | 1.28(0.68~2.41) | 0.44 | 1.33(0.71~2.51) | 0.38 | 1.25(0.66~2.37) | 0.49 |
| Q4组 | 1.77(0.96~3.27) | 0.06 | 1.33(0.70~2.51) | 0.38 | 1.35(0.71~2.56) | 0.35 | 1.05(0.50~2.21) | 0.90 |
| 40~49岁 | <0.01a | <0.01a | <0.01a | 0.04a | ||||
| Q1组 | 1.00 | 1.00 | 1.00 | 1.00 | ||||
| Q2组 | 1.39(1.04~1.86) | 0.02 | 1.31(0.98~1.76) | 0.06 | 1.31(0.98~1.75) | 0.07 | 1.30(0.97~1.74) | 0.08 |
| Q3组 | 1.42(1.07~1.89) | 0.01 | 1.23(0.93~1.64) | 0.15 | 1.24(0.94~1.65) | 0.13 | 1.23(0.92~1.63) | 0.16 |
| Q4组 | 1.82(1.39~2.38) | <0.01 | 1.53(1.16~2.01) | <0.01 | 1.55(1.18~2.03) | <0.01 | 1.47(1.07~2.04) | 0.01 |
| 50~59岁 | <0.01a | <0.01a | <0.01a | 0.04a | ||||
| Q1组 | 1.00 | 1.00 | 1.00 | 1.00 | ||||
| Q2组 | 1.10(0.91~1.31) | 0.32 | 1.05(0.87~1.26) | 0.61 | 1.04(0.87~1.25) | 0.65 | 1.04(0.87~1.25) | 0.66 |
| Q3组 | 1.18(0.99~1.40) | 0.06 | 1.06(0.89~1.26) | 0.52 | 1.05(0.89~1.26) | 0.55 | 1.05(0.88~1.25) | 0.58 |
| Q4组 | 1.50(1.27~1.77) | <0.01 | 1.32(1.11~1.56) | <0.01 | 1.30(1.10~1.55) | <0.01 | 1.28(1.04~1.58) | 0.01 |
| ≥60岁 | <0.01a | <0.01a | <0.01a | 0.24a | ||||
| Q1组 | 1.00 | 1.00 | 1.00 | 1.00 | ||||
| Q2组 | 1.06(0.91~1.25) | 0.45 | 1.03(0.87~1.21) | 0.76 | 1.02(0.87~1.20) | 0.84 | 1.01(0.85~1.18) | 0.95 |
| Q3组 | 1.18(1.00~1.39) | 0.04 | 1.10(0.93~1.29) | 0.27 | 1.09(0.93~1.29) | 0.29 | 1.06(0.90~1.25) | 0.48 |
| Q4组 | 1.35(1.16~1.58) | <0.01 | 1.24(1.06~1.46) | 0.01 | 1.23(1.05~1.44) | 0.01 | 1.10(0.91~1.33) | 0.30 |
Table 6 Results of Cox proportional hazards model analysis on the incidence of cvd in different car groups and different age groups after excluding study subjects taking antidiabetic medications
| 分组 | 模型1 | 模型2 | 模型3 | 模型4 | ||||
|---|---|---|---|---|---|---|---|---|
| HR(95%CI) | P(P趋势)值 | HR(95%CI) | P(P趋势)值 | HR(95%CI) | P(P趋势)值 | HR(95%CI) | P(P趋势)值 | |
| 总人群 | <0.01a | <0.01a | <0.01a | <0.01a | ||||
| Q1组 | 1.00 | 1.00 | 1.00 | 1.00 | ||||
| Q2组 | 1.13(1.01~1.26) | 0.02 | 1.07(0.96~1.20) | 0.22 | 1.06(0.95~1.19) | 0.28 | 1.06(0.95~1.18) | 0.33 |
| Q3组 | 1.26(1.13~1.40) | <0.01 | 1.12(1.00~1.25) | 0.04 | 1.11(0.99~1.24) | 0.05 | 1.10(0.98~1.22) | 0.10 |
| Q4组 | 1.51(1.36~1.67) | <0.01 | 1.31(1.18~1.46) | <0.01 | 1.30(1.17~1.44) | <0.01 | 1.21(1.07~1.38) | <0.01 |
| <40岁 | 0.01a | 0.15a | 0.12a | 0.48a | ||||
| Q1组 | 1.00 | 1.00 | 1.00 | 1.00 | ||||
| Q2组 | 0.65(0.29~1.45) | 0.28 | 0.57(0.26~1.29) | 0.17 | 0.57(0.25~1.28) | 0.17 | 0.56(0.25~1.25) | 0.15 |
| Q3组 | 1.61(0.86~3.00) | 0.13 | 1.28(0.68~2.41) | 0.44 | 1.33(0.71~2.51) | 0.38 | 1.25(0.66~2.37) | 0.49 |
| Q4组 | 1.77(0.96~3.27) | 0.06 | 1.33(0.70~2.51) | 0.38 | 1.35(0.71~2.56) | 0.35 | 1.05(0.50~2.21) | 0.90 |
| 40~49岁 | <0.01a | <0.01a | <0.01a | 0.04a | ||||
| Q1组 | 1.00 | 1.00 | 1.00 | 1.00 | ||||
| Q2组 | 1.39(1.04~1.86) | 0.02 | 1.31(0.98~1.76) | 0.06 | 1.31(0.98~1.75) | 0.07 | 1.30(0.97~1.74) | 0.08 |
| Q3组 | 1.42(1.07~1.89) | 0.01 | 1.23(0.93~1.64) | 0.15 | 1.24(0.94~1.65) | 0.13 | 1.23(0.92~1.63) | 0.16 |
| Q4组 | 1.82(1.39~2.38) | <0.01 | 1.53(1.16~2.01) | <0.01 | 1.55(1.18~2.03) | <0.01 | 1.47(1.07~2.04) | 0.01 |
| 50~59岁 | <0.01a | <0.01a | <0.01a | 0.04a | ||||
| Q1组 | 1.00 | 1.00 | 1.00 | 1.00 | ||||
| Q2组 | 1.10(0.91~1.31) | 0.32 | 1.05(0.87~1.26) | 0.61 | 1.04(0.87~1.25) | 0.65 | 1.04(0.87~1.25) | 0.66 |
| Q3组 | 1.18(0.99~1.40) | 0.06 | 1.06(0.89~1.26) | 0.52 | 1.05(0.89~1.26) | 0.55 | 1.05(0.88~1.25) | 0.58 |
| Q4组 | 1.50(1.27~1.77) | <0.01 | 1.32(1.11~1.56) | <0.01 | 1.30(1.10~1.55) | <0.01 | 1.28(1.04~1.58) | 0.01 |
| ≥60岁 | <0.01a | <0.01a | <0.01a | 0.24a | ||||
| Q1组 | 1.00 | 1.00 | 1.00 | 1.00 | ||||
| Q2组 | 1.06(0.91~1.25) | 0.45 | 1.03(0.87~1.21) | 0.76 | 1.02(0.87~1.20) | 0.84 | 1.01(0.85~1.18) | 0.95 |
| Q3组 | 1.18(1.00~1.39) | 0.04 | 1.10(0.93~1.29) | 0.27 | 1.09(0.93~1.29) | 0.29 | 1.06(0.90~1.25) | 0.48 |
| Q4组 | 1.35(1.16~1.58) | <0.01 | 1.24(1.06~1.46) | 0.01 | 1.23(1.05~1.44) | 0.01 | 1.10(0.91~1.33) | 0.30 |
| 分组 | 模型1 | 模型2 | 模型3 | 模型4 | ||||
|---|---|---|---|---|---|---|---|---|
| HR(95%CI) | P(P趋势)值 | HR(95%CI) | P(P趋势)值 | HR(95%CI) | P(P趋势)值 | HR(95%CI) | P(P趋势)值 | |
| 总人群 | <0.01a | <0.01a | <0.01a | <0.01a | ||||
| Q1组 | 1.00 | 1.00 | 1.00 | 1.00 | ||||
| Q2组 | 1.15(1.03~1.28) | 0.01 | 1.08(0.97~1.20) | 0.15 | 1.08(0.97~1.20) | 0.18 | 1.07(0.96~1.19) | 0.21 |
| Q3组 | 1.31(1.18~1.46) | <0.01 | 1.16(1.04~1.29) | 0.01 | 1.16(1.04~1.28) | 0.01 | 1.14(1.03~1.27) | 0.01 |
| Q4组 | 1.53(1.38~1.69) | <0.01 | 1.30(1.18~1.45) | <0.01 | 1.30(1.17~1.44) | <0.01 | 1.24(1.09~1.40) | <0.01 |
| <40岁 | <0.01a | 0.07a | 0.06a | 0.35a | ||||
| Q1组 | 1.00 | 1.00 | 1.00 | 1.00 | ||||
| Q2组 | 0.64(0.28~1.43) | 0.27 | 0.57(0.26~1.28) | 0.17 | 0.56(0.25~1.26) | 0.15 | 0.55(0.24~1.23) | 0.14 |
| Q3组 | 1.59(0.85~2.96) | 0.14 | 1.27(0.67~2.39) | 0.46 | 1.31(0.70~2.48) | 0.39 | 1.24(0.66~2.35) | 0.50 |
| Q4组 | 1.92(1.05~3.50) | 0.03 | 1.46(0.78~2.72) | 0.23 | 1.49(0.80~2.79) | 0.21 | 1.15(0.56~2.36) | 0.71 |
| 40~49岁 | <0.01a | <0.01a | <0.01a | 0.03a | ||||
| Q1组 | 1.00 | 1.00 | 1.00 | 1.00 | ||||
| Q2组 | 1.29(0.98~1.71) | 0.07 | 1.22(0.92~1.61) | 0.16 | 1.22(0.92~1.61) | 0.17 | 1.21(0.91~1.60) | 0.18 |
| Q3组 | 1.42(1.09~1.86) | 0.01 | 1.22(0.93~1.60) | 0.14 | 1.23(0.94~1.62) | 0.13 | 1.22(0.93~1.61) | 0.15 |
| Q4组 | 1.76(1.36~2.27) | <0.01 | 1.45(1.11~1.88) | 0.01 | 1.47(1.13~1.91) | <0.01 | 1.43(1.05~1.95) | 0.02 |
| 50~59岁 | <0.01a | <0.01a | <0.01a | 0.04a | ||||
| Q1组 | 1.00 | 1.00 | 1.00 | 1.00 | ||||
| Q2组 | 1.13(0.95~1.35) | 0.16 | 1.07(0.90~1.28) | 0.46 | 1.07(0.89~1.27) | 0.47 | 1.07(0.89~1.27) | 0.48 |
| Q3组 | 1.22(1.03~1.44) | 0.02 | 1.08(0.91~1.28) | 0.38 | 1.08(0.91~1.28) | 0.39 | 1.07(0.90~1.27) | 0.46 |
| Q4组 | 1.49(1.27~1.76) | <0.01 | 1.28(1.08~1.51) | <0.01 | 1.27(1.08~1.50) | <0.01 | 1.22(1.01~1.49) | 0.04 |
| ≥60岁 | <0.01a | <0.01a | <0.01a | 0.03a | ||||
| Q1组 | 1.00 | 1.00 | 1.00 | 1.00 | ||||
| Q2组 | 1.10(0.94~1.29) | 0.24 | 1.06(0.90~1.24) | 0.48 | 1.05(0.90~1.23) | 0.54 | 1.04(0.89~1.22) | 0.59 |
| Q3组 | 1.25(1.07~1.47) | 0.00 | 1.17(0.99~1.37) | 0.05 | 1.17(0.99~1.37) | 0.06 | 1.15(0.98~1.35) | 0.09 |
| Q4组 | 1.39(1.19~1.62) | <0.01 | 1.27(1.09~1.49) | <0.01 | 1.26(1.07~1.47) | <0.01 | 1.20(0.99~1.44) | 0.05 |
Table 7 Results of Cox proportional hazards model analysis on the incidence of cvd in different car groups and different age groups after excluding study subjects with follow-up time <1 year
| 分组 | 模型1 | 模型2 | 模型3 | 模型4 | ||||
|---|---|---|---|---|---|---|---|---|
| HR(95%CI) | P(P趋势)值 | HR(95%CI) | P(P趋势)值 | HR(95%CI) | P(P趋势)值 | HR(95%CI) | P(P趋势)值 | |
| 总人群 | <0.01a | <0.01a | <0.01a | <0.01a | ||||
| Q1组 | 1.00 | 1.00 | 1.00 | 1.00 | ||||
| Q2组 | 1.15(1.03~1.28) | 0.01 | 1.08(0.97~1.20) | 0.15 | 1.08(0.97~1.20) | 0.18 | 1.07(0.96~1.19) | 0.21 |
| Q3组 | 1.31(1.18~1.46) | <0.01 | 1.16(1.04~1.29) | 0.01 | 1.16(1.04~1.28) | 0.01 | 1.14(1.03~1.27) | 0.01 |
| Q4组 | 1.53(1.38~1.69) | <0.01 | 1.30(1.18~1.45) | <0.01 | 1.30(1.17~1.44) | <0.01 | 1.24(1.09~1.40) | <0.01 |
| <40岁 | <0.01a | 0.07a | 0.06a | 0.35a | ||||
| Q1组 | 1.00 | 1.00 | 1.00 | 1.00 | ||||
| Q2组 | 0.64(0.28~1.43) | 0.27 | 0.57(0.26~1.28) | 0.17 | 0.56(0.25~1.26) | 0.15 | 0.55(0.24~1.23) | 0.14 |
| Q3组 | 1.59(0.85~2.96) | 0.14 | 1.27(0.67~2.39) | 0.46 | 1.31(0.70~2.48) | 0.39 | 1.24(0.66~2.35) | 0.50 |
| Q4组 | 1.92(1.05~3.50) | 0.03 | 1.46(0.78~2.72) | 0.23 | 1.49(0.80~2.79) | 0.21 | 1.15(0.56~2.36) | 0.71 |
| 40~49岁 | <0.01a | <0.01a | <0.01a | 0.03a | ||||
| Q1组 | 1.00 | 1.00 | 1.00 | 1.00 | ||||
| Q2组 | 1.29(0.98~1.71) | 0.07 | 1.22(0.92~1.61) | 0.16 | 1.22(0.92~1.61) | 0.17 | 1.21(0.91~1.60) | 0.18 |
| Q3组 | 1.42(1.09~1.86) | 0.01 | 1.22(0.93~1.60) | 0.14 | 1.23(0.94~1.62) | 0.13 | 1.22(0.93~1.61) | 0.15 |
| Q4组 | 1.76(1.36~2.27) | <0.01 | 1.45(1.11~1.88) | 0.01 | 1.47(1.13~1.91) | <0.01 | 1.43(1.05~1.95) | 0.02 |
| 50~59岁 | <0.01a | <0.01a | <0.01a | 0.04a | ||||
| Q1组 | 1.00 | 1.00 | 1.00 | 1.00 | ||||
| Q2组 | 1.13(0.95~1.35) | 0.16 | 1.07(0.90~1.28) | 0.46 | 1.07(0.89~1.27) | 0.47 | 1.07(0.89~1.27) | 0.48 |
| Q3组 | 1.22(1.03~1.44) | 0.02 | 1.08(0.91~1.28) | 0.38 | 1.08(0.91~1.28) | 0.39 | 1.07(0.90~1.27) | 0.46 |
| Q4组 | 1.49(1.27~1.76) | <0.01 | 1.28(1.08~1.51) | <0.01 | 1.27(1.08~1.50) | <0.01 | 1.22(1.01~1.49) | 0.04 |
| ≥60岁 | <0.01a | <0.01a | <0.01a | 0.03a | ||||
| Q1组 | 1.00 | 1.00 | 1.00 | 1.00 | ||||
| Q2组 | 1.10(0.94~1.29) | 0.24 | 1.06(0.90~1.24) | 0.48 | 1.05(0.90~1.23) | 0.54 | 1.04(0.89~1.22) | 0.59 |
| Q3组 | 1.25(1.07~1.47) | 0.00 | 1.17(0.99~1.37) | 0.05 | 1.17(0.99~1.37) | 0.06 | 1.15(0.98~1.35) | 0.09 |
| Q4组 | 1.39(1.19~1.62) | <0.01 | 1.27(1.09~1.49) | <0.01 | 1.26(1.07~1.47) | <0.01 | 1.20(0.99~1.44) | 0.05 |
| 分组 | 模型1 | 模型2 | 模型3 | 模型4 | ||||
|---|---|---|---|---|---|---|---|---|
| HR(95%CI) | P(P趋势)值 | HR(95%CI) | P(P趋势)值 | HR(95%CI) | P(P趋势)值 | HR(95%CI) | P(P趋势)值 | |
| Q1组 | 1.00 | <0.01a | 1.00 | <0.01a | 1.00 | <0.01a | 1.00 | <0.01a |
| Q2组 | 1.03(0.89~1.20) | 0.70 | 0.99(0.85~1.15) | 0.91 | 0.98(0.85~1.14) | 0.82 | 0.98(0.84~1.13) | 0.73 |
| Q3组 | 1.19(1.02~1.38) | 0.02 | 1.11(0.95~1.29) | 0.18 | 1.10(0.95~1.28) | 0.20 | 1.08(0.93~1.26) | 0.33 |
| Q4组 | 1.33(1.15~1.54) | <0.01 | 1.21(1.05~1.41) | 0.01 | 1.20(1.03~1.39) | 0.01 | 1.11(0.93~1.33) | 0.24 |
Table 8 Analysis of the mortality competitive risk model for the incidence of CVD in different CAR groups aged ≥60 years
| 分组 | 模型1 | 模型2 | 模型3 | 模型4 | ||||
|---|---|---|---|---|---|---|---|---|
| HR(95%CI) | P(P趋势)值 | HR(95%CI) | P(P趋势)值 | HR(95%CI) | P(P趋势)值 | HR(95%CI) | P(P趋势)值 | |
| Q1组 | 1.00 | <0.01a | 1.00 | <0.01a | 1.00 | <0.01a | 1.00 | <0.01a |
| Q2组 | 1.03(0.89~1.20) | 0.70 | 0.99(0.85~1.15) | 0.91 | 0.98(0.85~1.14) | 0.82 | 0.98(0.84~1.13) | 0.73 |
| Q3组 | 1.19(1.02~1.38) | 0.02 | 1.11(0.95~1.29) | 0.18 | 1.10(0.95~1.28) | 0.20 | 1.08(0.93~1.26) | 0.33 |
| Q4组 | 1.33(1.15~1.54) | <0.01 | 1.21(1.05~1.41) | 0.01 | 1.20(1.03~1.39) | 0.01 | 1.11(0.93~1.33) | 0.24 |
| [1] |
GBD 2021 Diseases and Injuries Collaborators. Global incidence,prevalence,years lived with disability(YLDs),disability-adjusted life-years(DALYs),and healthy life expectancy(HALE) for 371 diseases and injuries in 204 countries and territories and 811 subnational locations,1990-2021:a systematic analysis for the Global Burden of Disease Study 2021[J]. Lancet,2024,403(10440):2133-2161. DOI:10.1016/S0140-6736(24)00757-8.
|
| [2] |
GBD 2021 Causes of Death Collaborators. Global burden of 288 causes of death and life expectancy decomposition in 204 countries and territories and 811 subnational locations,1990-2021:a systematic analysis for the Global Burden of Disease Study 2021[J]. Lancet,2024,403(10440):2100-2132. DOI:10.1016/S0140-6736(24)00367-2.
|
| [3] |
|
| [4] |
|
| [5] |
|
| [6] |
Emerging Risk Factors Collaboration,
|
| [7] |
|
| [8] |
|
| [9] |
|
| [10] |
|
| [11] |
|
| [12] |
|
| [13] |
|
| [14] |
|
| [15] |
|
| [16] |
|
| [17] |
|
| [18] |
|
| [19] |
|
| [20] |
|
| [21] |
|
| [22] |
|
| [23] |
|
| [24] |
|
| [25] |
|
| [26] |
|
| [27] |
|
| [28] |
|
| [29] |
|
| [30] |
|
| [31] |
|
| [32] |
|
| [33] |
|
| [34] |
|
| [35] |
|
| [36] |
|
| [37] |
吴寿岭,赵晓琳,高明,等. 唐山地区健康成年人群血清高敏C反应蛋白的正常值参考范围[J]. 中华高血压杂志,2013,21(7):675-678. DOI:10.16439/j.cnki.1673-7245.2013.07.004.
|
| [38] |
|
| [1] | ZHANG Shu, CHENG Yu, WU Shouling, CHEN Shuohua, WU Yuntao. The Impact of Cumulative Plasma Atherogenic Index Exposure on Incident Cardiovascular Disease in Non-Diabetic Individuals: a Cohort Study [J]. Chinese General Practice, 2025, 28(36): 4558-4565. |
| [2] | ZHANG Ying, LIAO Xiaoyang, YANG Hanfei, YU Yongjun, LIU Lidi, JIA Yu, SHEN Can, LI Xiao, HUANG Chuanying, YANG Rong. Interpretation of the 2024 International Society of Hypertension Position Paper on Innovations in Blood Pressure Measurement and Reporting Technology and Its Implications for China [J]. Chinese General Practice, 2025, 28(36): 4541-4549. |
| [3] | ZHAO Zhuo, WANG He. Research Progress on the Mechanism of HIF-2α in Cardiovascular Diseases [J]. Chinese General Practice, 2025, 28(33): 4241-4248. |
| [4] | WANG Biyou, GAO Ying, YOU Junfang, LIU Li, ZHANG Qing, SU Haiyan. Canonical Correlation Analysis of Lipid Ratios and Inflammatory Markers in Individuals at Risk of Cardiovascular Disease [J]. Chinese General Practice, 2025, 28(33): 4132-4139. |
| [5] | CHEN Huilong, LIAO Yunchu, LIU Yuwei, KONG Zhenghui, HUANG Xinghui, XU Jiahui, QI Na, WANG Yuanping, LIANG Wenjian. Association between Relative Fat Mass and Cardiovascular Disease in Middle-aged and Elderly Population: a Cross-sectional and Longitudinal Study Based on CHARLS [J]. Chinese General Practice, 2025, 28(32): 4047-4054. |
| [6] | LIU Mingbo, HE Xinye, YANG Xiaohong, WANG Zengwu. Interpretation of Report on Cardiovascular Health and Diseases in China 2024 [J]. Chinese General Practice, 2025, 28(32): 3989-4008. |
| [7] | LIAO Jiaojiao, WANG Zhaoyu, LI Zhaoji, ZHAO Wei, ZHAN Siyan, WANG Peng, TAO Liyuan. Predictive Value of Dynamic Changes in Non-high-density Lipoprotein Cholesterol for Carotid Intima-media Thickening: an Ambidirectional Cohort Study [J]. Chinese General Practice, 2025, 28(31): 3932-3941. |
| [8] | ZHANG Ji, ZHOU Jie, LI Ling, WU Yanli, JI Wei, LIU Tao. Associations of Fasting Blood Glucose with All-cause Mortality and Specific-cause Mortality in a Prospective Cohort Study [J]. Chinese General Practice, 2025, 28(31): 3924-3931. |
| [9] | ZHOU Sheng, DENG Changsheng, ZOU Guanyang, SONG Jianping. Research Progress on the Pathogenesis of Complications of Malaria in Cardiovascular Diseases [J]. Chinese General Practice, 2025, 28(27): 3466-3472. |
| [10] | CHENG Yuxin, FANG Jiamin, LIANG Hao, WANG Zhiling, WEI Li, LIAO Huilian, XU Mingming, CHEN Yumei, LI Yanfen, DONG Lijuan, GUO Yingui. Preoperative Platelet-to-albumin Ratio in Elective Geriatric Surgery Patients and Its Correlation with Postoperative Incidental Frailty: a Multicenter Study [J]. Chinese General Practice, 2025, 28(27): 3359-3367. |
| [11] | XIANG Xinyue, ZHANG Bingqing, OUYANG Yuqin, TANG Wenjuan, FENG Wenhuan. Impact of Short-term Medical Weight Loss on Atherosclerotic Cardiovascular Disease Risk in Patients with Obesity [J]. Chinese General Practice, 2025, 28(26): 3229-3239. |
| [12] | LIU Yinyin, SUI Hongping, LI Tingting, JIANG Tongtong, SHI Tieying, XIA Yunlong. Advances in Risk Prediction Models for Cardiotoxicity Associated with Breast Cancer Treatment [J]. Chinese General Practice, 2025, 28(24): 3072-3078. |
| [13] | PAN Yaojia, FU Fanglin, HAN Zheng, SUN Meng, GU Huaicong, WANG Weiqiang. Correlation of the Type of Obesity with the Cardiometabolic Multimorbidity: a Study in Male and Female Middle-aged Residents in Anhui Province [J]. Chinese General Practice, 2025, 28(18): 2285-2293. |
| [14] | HAN Zheng, SUN Meng, FU Fanglin, PAN Yaojia, WANG Weiqiang. A Study on the Relationship between the Triglyceride-Glucose Index and Cardiometabolic Multimorbidity in Individuals Aged 50 and Above [J]. Chinese General Practice, 2025, 28(18): 2278-2284. |
| [15] | MEI Jingyan, CHEN Min, ZHANG Lieqiang, PAN Yunxi, WANG Xin, ZHAO Xiaodeng, ZHAN Wei, LIU Tao, WANG Yiying. Association between Cumulative Lipid Accumulation Index and Hypertension: a Prospective Cohort Study [J]. Chinese General Practice, 2025, 28(18): 2205-2211. |
| Viewed | ||||||
|
Full text |
|
|||||
|
Abstract |
|
|||||