
Chinese General Practice ›› 2023, Vol. 26 ›› Issue (21): 2614-2619.DOI: 10.12114/j.issn.1007-9572.2022.0735
Special Issue: 消化系统疾病最新文章合辑; 胰腺炎最新文章合辑
• Original Research • Previous Articles Next Articles
Received:2022-06-13
Revised:2022-11-09
Published:2023-07-20
Online:2022-11-27
Contact:
ZHAO Ping
通讯作者:
赵平
作者简介:
Add to citation manager EndNote|Ris|BibTeX
URL: https://www.chinagp.net/EN/10.12114/j.issn.1007-9572.2022.0735
| 组别 | 例数 | 年龄( | 性别(男/女) | 高血压〔n(%)〕 | 糖尿病〔n(%)〕 | 高脂血症〔n(%)〕 | 胆管疾病史〔n(%)〕 | BMI ( |
|---|---|---|---|---|---|---|---|---|
| AP组 | 100 | 45.4±15.3 | 76/24 | 29(29.0) | 21(21.0) | 43(43.0) | 23(23.0) | 26.3±3.1 |
| 非AP组 | 100 | 43.2±13.5 | 68/32 | 26(26.0) | 19(19.0) | 25(25.0) | 17(17.0) | 23.6±2.2 |
| χ2(t)值 | 1.267a | 1.587 | 0.226 | 0.125 | 7.219 | 1.125 | 9.754a | |
| P值 | 0.205 | 0.208 | 0.635 | 0.724 | 0.007 | 0.289 | <0.001 |
Table 1 Comparison of clinical data between acute pancreatitis group and non-acute pancreatitis group
| 组别 | 例数 | 年龄( | 性别(男/女) | 高血压〔n(%)〕 | 糖尿病〔n(%)〕 | 高脂血症〔n(%)〕 | 胆管疾病史〔n(%)〕 | BMI ( |
|---|---|---|---|---|---|---|---|---|
| AP组 | 100 | 45.4±15.3 | 76/24 | 29(29.0) | 21(21.0) | 43(43.0) | 23(23.0) | 26.3±3.1 |
| 非AP组 | 100 | 43.2±13.5 | 68/32 | 26(26.0) | 19(19.0) | 25(25.0) | 17(17.0) | 23.6±2.2 |
| χ2(t)值 | 1.267a | 1.587 | 0.226 | 0.125 | 7.219 | 1.125 | 9.754a | |
| P值 | 0.205 | 0.208 | 0.635 | 0.724 | 0.007 | 0.289 | <0.001 |
| 组别 | 例数 | SAT面积(cm2) | VAT面积(cm2) | TAT面积(cm2) | VAT/SAT | VAT/TAT |
|---|---|---|---|---|---|---|
| AP组 | 100 | 125.33±23.18 | 205.20±18.88 | 330.54±41.86 | 1.68±0.27 | 0.62±0.03 |
| 非AP组 | 100 | 119.90±20.20 | 160.40±22.23 | 280.30±42.27 | 1.34±0.05 | 0.57±0.01 |
| t值 | 1.767 | 15.362 | 8.445 | 12.292 | 17.592 | |
| P值 | 0.079 | <0.001 | <0.001 | <0.001 | <0.001 |
Table 2 Comparison of CT-assessed abdominal fat content and distribution between acute pancreatitis group and non-acute pancreatitis group
| 组别 | 例数 | SAT面积(cm2) | VAT面积(cm2) | TAT面积(cm2) | VAT/SAT | VAT/TAT |
|---|---|---|---|---|---|---|
| AP组 | 100 | 125.33±23.18 | 205.20±18.88 | 330.54±41.86 | 1.68±0.27 | 0.62±0.03 |
| 非AP组 | 100 | 119.90±20.20 | 160.40±22.23 | 280.30±42.27 | 1.34±0.05 | 0.57±0.01 |
| t值 | 1.767 | 15.362 | 8.445 | 12.292 | 17.592 | |
| P值 | 0.079 | <0.001 | <0.001 | <0.001 | <0.001 |
| 组别 | 例数 | SAT面积(cm2) | VAT面积(cm2) | TAT面积(cm2) | VAT/SAT | VAT/TAT |
|---|---|---|---|---|---|---|
| 非重症AP亚组 | 75 | 126.53±17.82 | 178.74±20.51 | 305.26±37.77 | 1.42±0.09 | 0.59±0.01 |
| 重症AP亚组 | 25 | 130.59±15.48 | 243.39±18.76 | 373.98±34.01 | 1.87±0.10 | 0.65±0.01 |
| t值 | -1.019 | -13.932 | -8.068 | -21.677 | -21.108 | |
| P值 | 0.311 | <0.001 | <0.001 | <0.001 | <0.001 |
Table 3 Comparison of CT-assessed abdominal fat content and distribution between severe and non-severe acute pancreatitis subgroups
| 组别 | 例数 | SAT面积(cm2) | VAT面积(cm2) | TAT面积(cm2) | VAT/SAT | VAT/TAT |
|---|---|---|---|---|---|---|
| 非重症AP亚组 | 75 | 126.53±17.82 | 178.74±20.51 | 305.26±37.77 | 1.42±0.09 | 0.59±0.01 |
| 重症AP亚组 | 25 | 130.59±15.48 | 243.39±18.76 | 373.98±34.01 | 1.87±0.10 | 0.65±0.01 |
| t值 | -1.019 | -13.932 | -8.068 | -21.677 | -21.108 | |
| P值 | 0.311 | <0.001 | <0.001 | <0.001 | <0.001 |
| 变量 | 赋值 |
|---|---|
| AP | 0=否,1=是 |
| AP严重程度 | 0=非重症AP,1=重症AP |
| 高脂血症 | 0=否,1=是 |
| BMI | 0=<28 kg/m2,1=≥28 kg/m2 |
| VAT面积 | 实测值 |
| TAT面积 | 实测值 |
| VAT/SAT | 实测值 |
| VAT/TAT | 实测值 |
Table 4 Assignment table for factors associated with acute pancreatitis and its severity identified using multivariate Logistic regression
| 变量 | 赋值 |
|---|---|
| AP | 0=否,1=是 |
| AP严重程度 | 0=非重症AP,1=重症AP |
| 高脂血症 | 0=否,1=是 |
| BMI | 0=<28 kg/m2,1=≥28 kg/m2 |
| VAT面积 | 实测值 |
| TAT面积 | 实测值 |
| VAT/SAT | 实测值 |
| VAT/TAT | 实测值 |
| 变量 | β | SE | Wald χ2值 | P值 | OR值 | 95%CI |
|---|---|---|---|---|---|---|
| 高脂血症 | -0.689 | 0.352 | 3.819 | 0.051 | 0.502 | (0.252,1.002) |
| BMI | 0.686 | 0.105 | 42.693 | <0.001 | 1.985 | (1.616,2.438) |
| VAT面积 | 0.119 | 0.017 | 46.934 | <0.001 | 1.126 | (1.088,1.165) |
| TAT面积 | 0.028 | 0.005 | 35.260 | <0.001 | 1.028 | (1.019,1.038) |
| VAT/SAT | 119.501 | 70.216 | 2.896 | 0.089 | 7.918E51 | (0,4.65E111) |
| VAT/TAT | 99.925 | 33.584 | 8.853 | 0.095 | 2.494E43 | (6.464E14,9.621E71) |
Table 5 Multivariate Logistic regression analysis of factors associated with acute pancreatitis
| 变量 | β | SE | Wald χ2值 | P值 | OR值 | 95%CI |
|---|---|---|---|---|---|---|
| 高脂血症 | -0.689 | 0.352 | 3.819 | 0.051 | 0.502 | (0.252,1.002) |
| BMI | 0.686 | 0.105 | 42.693 | <0.001 | 1.985 | (1.616,2.438) |
| VAT面积 | 0.119 | 0.017 | 46.934 | <0.001 | 1.126 | (1.088,1.165) |
| TAT面积 | 0.028 | 0.005 | 35.260 | <0.001 | 1.028 | (1.019,1.038) |
| VAT/SAT | 119.501 | 70.216 | 2.896 | 0.089 | 7.918E51 | (0,4.65E111) |
| VAT/TAT | 99.925 | 33.584 | 8.853 | 0.095 | 2.494E43 | (6.464E14,9.621E71) |
| 变量 | β | SE | Wald χ2值 | P值 | OR值 | 95%CI |
|---|---|---|---|---|---|---|
| 高脂血症 | -0.270 | 0.464 | 0.339 | 0.560 | 0.763 | (0.307,1.895) |
| BMI | 2.021 | 0.548 | 13.585 | <0.001 | 7.543 | (2.576,22.088) |
| VAT面积 | 28.462 | 321.477 | 0.008 | 0.929 | 2.295E12 | (0,1.000E286) |
| TAT面积 | 0.072 | 0.017 | 17.216 | <0.001 | 1.074 | (1.038,1.111) |
| VAT/SAT | 101.859 | 97.503 | 1.091 | 0.296 | 1.725E44 | (0,1.704E127) |
| VAT/TAT | 311.407 | 146.892 | 4.494 | 0.299 | 1.740E135 | (1.613E10,1.890E260) |
Table 6 Multivariate Logistic regression analysis of factors associated with the severity of acute pancreatitis
| 变量 | β | SE | Wald χ2值 | P值 | OR值 | 95%CI |
|---|---|---|---|---|---|---|
| 高脂血症 | -0.270 | 0.464 | 0.339 | 0.560 | 0.763 | (0.307,1.895) |
| BMI | 2.021 | 0.548 | 13.585 | <0.001 | 7.543 | (2.576,22.088) |
| VAT面积 | 28.462 | 321.477 | 0.008 | 0.929 | 2.295E12 | (0,1.000E286) |
| TAT面积 | 0.072 | 0.017 | 17.216 | <0.001 | 1.074 | (1.038,1.111) |
| VAT/SAT | 101.859 | 97.503 | 1.091 | 0.296 | 1.725E44 | (0,1.704E127) |
| VAT/TAT | 311.407 | 146.892 | 4.494 | 0.299 | 1.740E135 | (1.613E10,1.890E260) |
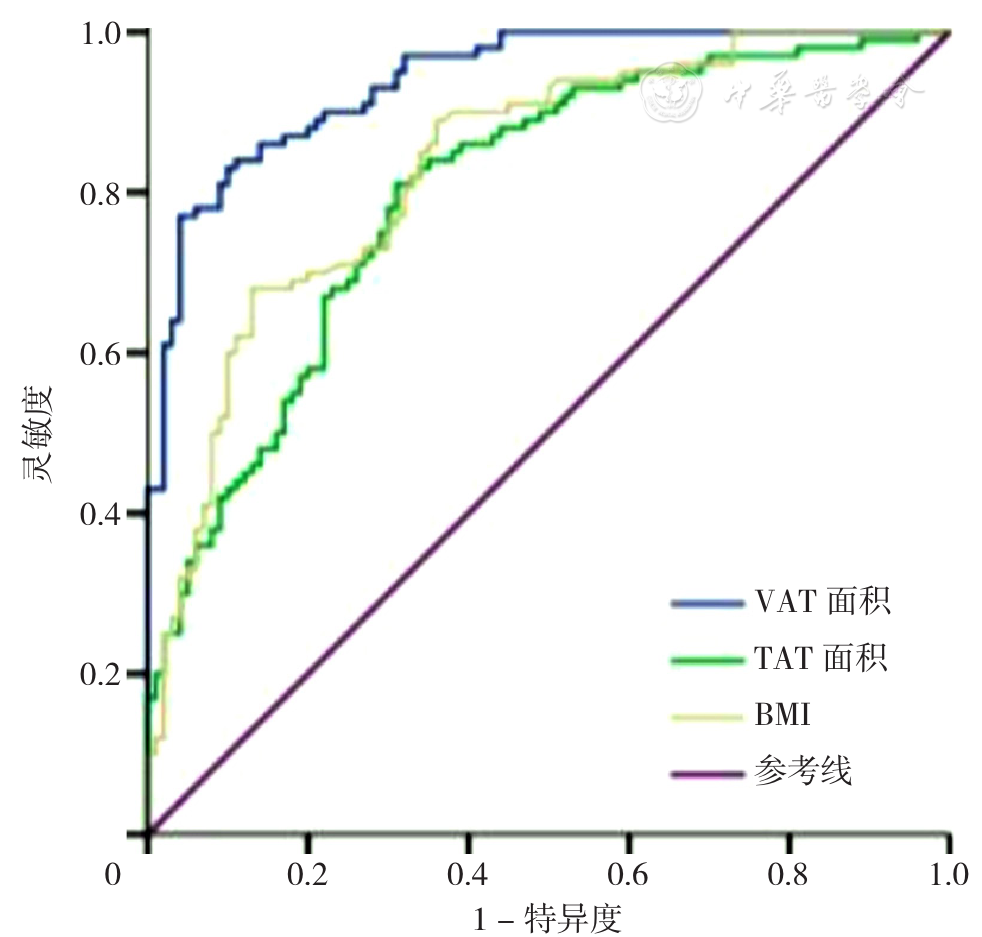
Figure 1 ROC curves of BMI,VAT and TAT predicting acute pancreatitis
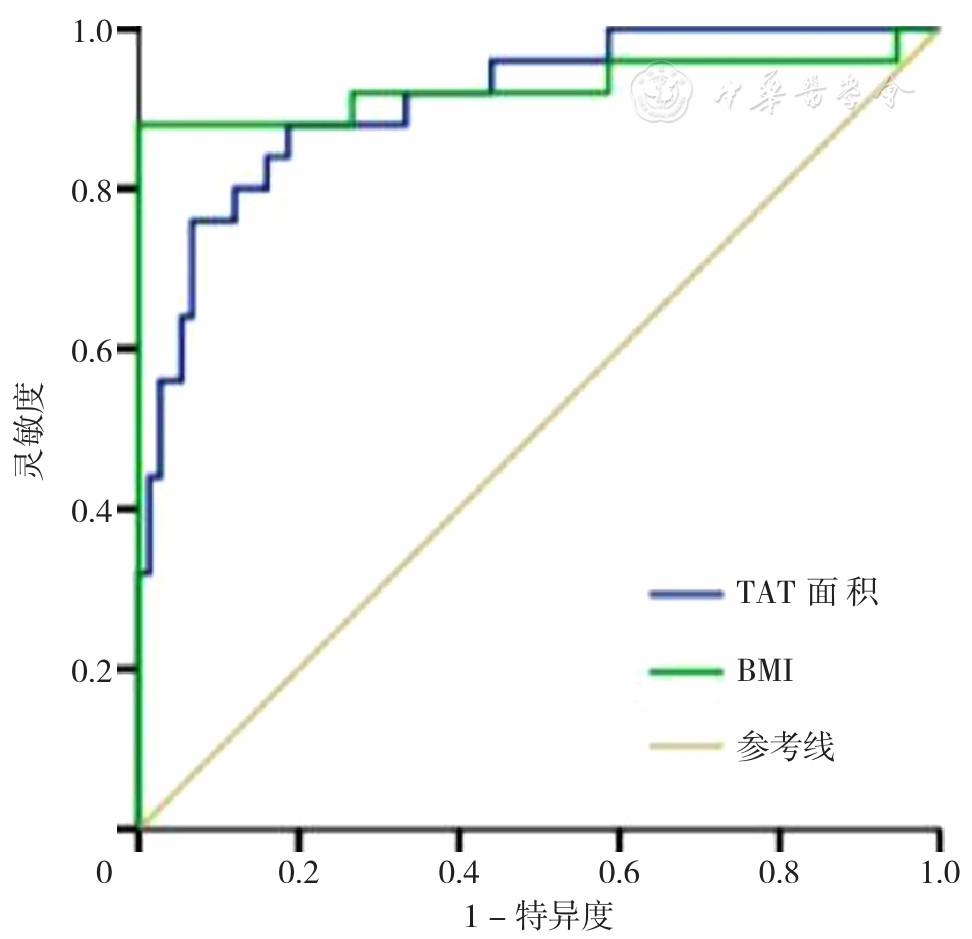
Figure 2 ROC curves of BMI and TAT predicting severe acute pancreatitis
| [1] |
|
| [2] |
中华医学会外科学分会胰腺外科学组. 中国急性胰腺炎诊治指南(2021)[J]. 中华消化外科杂志,2021,20(7):730-739. DOI:10.3760/cma.j.cn115610-20210622-00297.
|
| [3] |
|
| [4] |
|
| [5] |
|
| [6] |
|
| [7] |
|
| [8] |
|
| [9] |
|
| [10] |
中华医学会消化病学分会胰腺疾病学组. 中国急性胰腺炎诊治指南(2019年,沈阳)[J].中华消化杂志,2019,39(11):721-730. DOI:10.3760/cma.j.issn.0254-1432.2019.11.001.
|
| [11] |
|
| [12] |
|
| [13] |
|
| [14] |
|
| [15] |
|
| [16] |
|
| [17] |
|
| [18] |
|
| [19] |
|
| [20] |
|
| [21] |
|
| [22] |
|
| [23] |
|
| [1] | JIA Gaopeng, CHEN Qiuyu. Construction and Validation of a Risk Prediction Model for Recurrent Angina after Percutaneous Coronary Intervention in Elderly Patients with Acute ST-segment Elevation Myocardial Infarction: Based on CYP2C19-related Genetic Testing [J]. Chinese General Practice, 2025, 28(30): 3779-3786. |
| [2] | WU Xiangpeng, LI Enjun, LI Xiongwei, WANG Haihong, CUI Wei, WU Xiangli, QI Weihua, HOU Senlin. Timing of Administration and Combination Therapy of Non-steroidal Anti-inflammatory Drugs for the Prevention of Post-endoscopic Retrograde Cholangiopancreatography Pancreatitis [J]. Chinese General Practice, 2025, 28(30): 3823-3830. |
| [3] | LI Hao, LI Peijin, LIU Tingting, CUI Yiyuan, LI Sicong, LIU Lixing, FENG Li, Working Group on Integrated Traditional Chinese and Western Medicine Diagnosis and Treatment Guidelines for Cancer Pain. Guidelines on the Diagnosis and Treatment of Cancer Pain by Integrated Traditional Chinese and Western Medicine [J]. Chinese General Practice, 2025, 28(30): 3729-3740. |
| [4] | LI Ling, LI Yaping, QIAN Shixing, NIE Jing, LU Chunhua, LI Xia. Research on Influencing Factors and Risk Prediction of Cognitive Function in Community-dwelling Middle-aged and Elderly People [J]. Chinese General Practice, 2025, 28(30): 3773-3778. |
| [5] | LUO Xinyu, LIU Jin, CHEN Hailong. Trend Analysis of the Changing Disease Burden of Pancreatitis in China and Worldwide from 1990 to 2021 and Prediction for 2022 to 2031 [J]. Chinese General Practice, 2025, 28(26): 3321-3327. |
| [6] | ZHI Congcong, LI Xue, CHENG Yicheng, WANG Xiaolong, ZHENG Lihua. Guidelines for Integrated Traditional Chinese and Western Medicine Diagnosis and Treatment of Hemorrhoids (2025 Edition) [J]. Chinese General Practice, 2025, 28(26): 3217-3228. |
| [7] | PAN Qi, REN Jingjing, MA Fanghui, HU Mengjie. Survey of General Practitioners' Cognition and Needs for AI Assisted Diagnosis and Treatment Systems [J]. Chinese General Practice, 2025, 28(25): 3127-3136. |
| [8] | JIANG Qixia, ZHU Yuling, ZHU Wenjun, LI Xiuyun, XIE Haoting, WANG Huajun, YUAN Siming. Accuracy and Cut-off Values of "Five Points" Flap Temperature and "Single Point" Flap Temperature in Predicting Vascular Crisis [J]. Chinese General Practice, 2025, 28(24): 3013-3018. |
| [9] | LIU Yinyin, SUI Hongping, LI Tingting, JIANG Tongtong, SHI Tieying, XIA Yunlong. Advances in Risk Prediction Models for Cardiotoxicity Associated with Breast Cancer Treatment [J]. Chinese General Practice, 2025, 28(24): 3072-3078. |
| [10] | WANG Rupeng, NAN Jing, HU Yiran, YANG Shenghua, JIN Zening. Predictive Value of the Triglyceride-Glucose Body Mass Index for Slow Flow/No-reflow Phenomenon in Patients with Type 2 Diabetes Mellitus and Acute Myocardial Infarction Undergoing Emergency Percutaneous Coronary Intervention [J]. Chinese General Practice, 2025, 28(24): 2985-2992. |
| [11] | ZHOU Qian, WU Xiaomin, WANG Baohua, YAN Ruohan, YU Miao, WU Jing. Study on Nomogram Prediction Model for Risk of Gastric Cancer [J]. Chinese General Practice, 2025, 28(23): 2870-2877. |
| [12] | ZHAO Xiaoqing, GUO Tongtong, ZHANG Xinyi, LI Linhong, ZHANG Ya, JI Lihong, DONG Zhiwei, GAO Qianqian, CAI Weiqing, ZHENG Wengui, JING Qi. Construction and Validation of a Risk Prediction Model for Cognitive Impairment in Community-dwelling Older Adults [J]. Chinese General Practice, 2025, 28(22): 2776-2783. |
| [13] | Chinese Geriatrics Society, General Practice Branch of Zhejiang Medical Association, the Expert Collaboration Group on Medically Unspecified Disease in General Practice. Expert Consensus on the Diagnosis, Treatment, and Management of Emaciation (2025) [J]. Chinese General Practice, 2025, 28(21): 2577-2594. |
| [14] | GUO Shengteng, ZHANG Fenfen, WAN Di, YU Dongmei, WANG Qinghua. Risk Factors for Severe Acute Pancreatitis Complicated with Acute Lung Injury: a Meta-analysis [J]. Chinese General Practice, 2025, 28(20): 2546-2554. |
| [15] | LIU Hongya, YU Dehua. Construction and Practice of Clinical Diagnosis and Treatment Technology Combining General Practice and Specialist in Shanghai Community [J]. Chinese General Practice, 2025, 28(19): 2390-2397. |
| Viewed | ||||||
|
Full text |
|
|||||
|
Abstract |
|
|||||