中国全科医学 ›› 2023, Vol. 26 ›› Issue (12): 1456-1462.DOI: 10.12114/j.issn.1007-9572.2022.0737

• 论著 • 上一篇    下一篇

三酰甘油-葡萄糖指数及其衍生指数与2型糖尿病发病关系的巢式病例对照研究

葛旭红, 胡洁怡, 白云瑞, 王露, 冷松*()   

  1. 116027 辽宁省大连市,大连医科大学附属第二医院健康管理中心
  • 收稿日期:2022-09-23 修回日期:2023-01-15 出版日期:2023-04-20 发布日期:2023-01-30
  • 通讯作者: 冷松

  • 作者贡献:葛旭红提出研究选题方向,负责研究框架设计,数据处理以及论文的撰写;胡洁怡负责提供研究设计思路、统计学方法协助;白云瑞负责数据收集、数据清洗;王露负责数据整理、研究可行性分析;冷松负责文章的质量控制及审校,对文章整体负责;所有作者确认了论文的最终稿。
  • 基金资助:
    大连医科大学附属第二医院"1+X"计划项目(2022DXDL001)

Association between Triglyceride-glucose Index and Its Derivatives Index and the Development of Type 2 Diabetes: a Nested Case-control Study

GE Xuhong, HU Jieyi, BAI Yunrui, WANG Lu, LENG Song*()   

  1. Health Management Center, the Second Affiliated Hospital of Dalian Medical University, Dalian 116027, China
  • Received:2022-09-23 Revised:2023-01-15 Published:2023-04-20 Online:2023-01-30
  • Contact: LENG Song

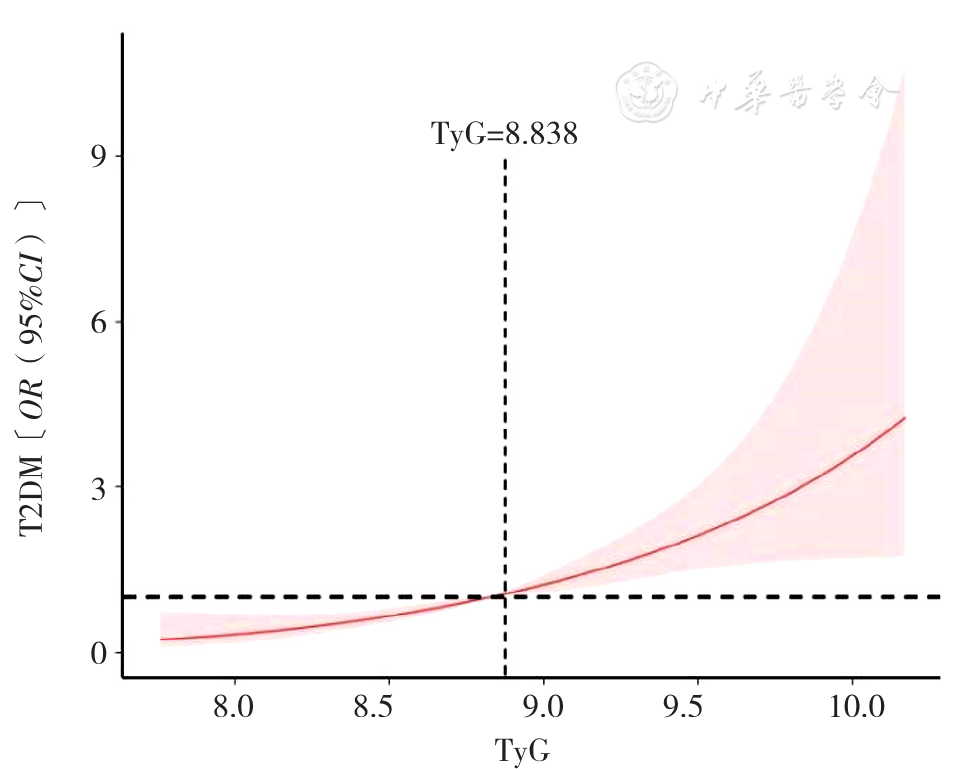
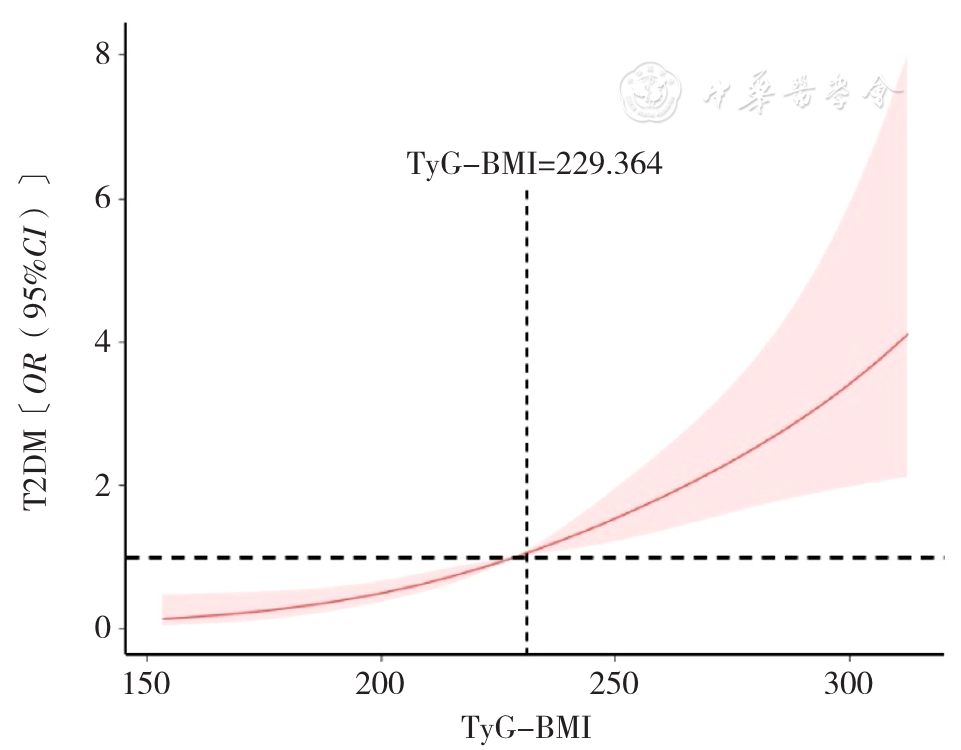
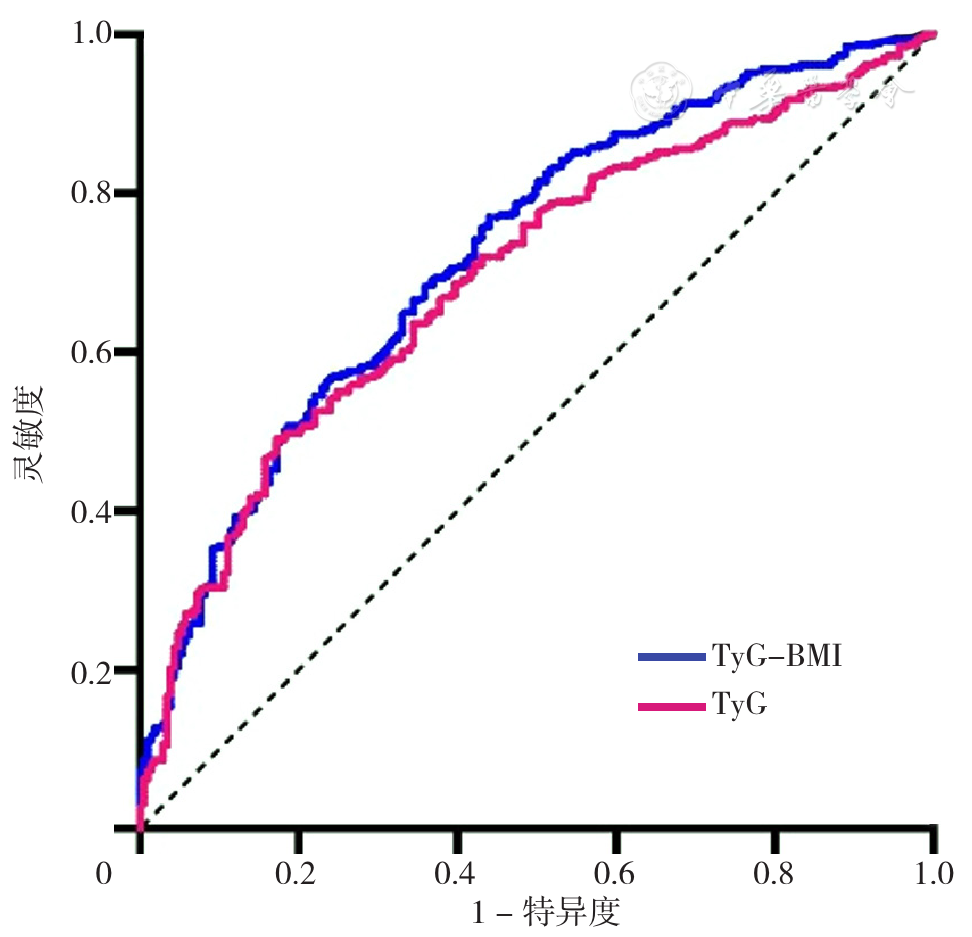
摘要: 背景 我国是世界上糖尿病患者人数最多的国家。胰岛素抵抗为2型糖尿病的主要发病机制,有研究表明胰岛素抵抗替代标志物三酰甘油-葡萄糖指数(TyG)及其衍生指数可能与2型糖尿病的发展具有一定相关性,但现有研究以单独横断面研究或纵向研究居多,在我国东北地区相关研究较少。目的 探究TyG及其衍生指数三酰甘油-葡萄糖-体质指数(TyG-BMI)与2型糖尿病之间的关系,同时分析TyG、TyG-BMI预测2型糖尿病的能力,为2型糖尿病高危人群的早期筛查提供科学依据。方法 以2015年1月至2017年12月大连医科大学附属第二医院健康管理中心6 843例体检者作为研究对象,收集其体检基线资料。采用巢式病例对照研究方法,2018年1月至2021年4月随访期间209例新发2型糖尿病患者为病例组;在同期随访中未新发2型糖尿病、内分泌系统疾病及恶性肿瘤者中,按照性别相同、年龄±2岁,采用倾向性评分进行1∶2匹配,选取418例设为对照组。依据基线资料计算TyG、TyG-BMI。采用Cox回归拟合条件Logistic回归模型分析TyG、TyG-BMI与2型糖尿病之间的关系。采用限制性立方样条回归模型分析不同水平TyG、TyG-BMI与2型糖尿病的量效关系。通过受试者工作特征曲线(ROC曲线)分析TyG、TyG-BMI对2型糖尿病的预测价值。结果 病例组BMI、腹围(AC)、收缩压(SBP)、舒张压(DBP)、空腹血糖(FPG)、三酰甘油(TG)、总胆固醇(TC)、低密度脂蛋白胆固醇(LDL-C)、TyG、TyG-BMI均高于对照组,高密度脂蛋白胆固醇(HDL-C)低于对照组(P0.05),剂量反应关系呈递增形状,当TyG、TyG-BMI分别高于8.838、229.364时,2型糖尿病发病风险逐渐升高。TyG、TyG-BMI预测2型糖尿病的ROC曲线下面积(AUC)分别为0.696[95%CI(0.658,0.732)]、0.725[95%CI(0.688,0.760)],最佳截断值分别为8.650、224.859。结论TyG、TyG-BMI的高水平状态是2型糖尿病的独立危险因素,其与2型糖尿病呈线性量效关系,二者对2型糖尿病均具有预测价值。若综合考虑风险关联强度、AUC、筛查结果的临床影响等方面,TyG-BMI或许是较优的预测指标。

关键词: 2型糖尿病, 三酰甘油-葡萄糖指数, 三酰甘油-葡萄糖-体质指数, 病例对照研究, 巢式病例对照研究, 限制性立方样条

Abstract:

Background

China has the largest number of diabetic patients in the world. Insulin resistance is a major pathogenetic mechanism and cause of type 2 diabetes. Recent studies have suggested potential relationship between triglyceride-glucose index (TyG) and its derivatives index and the development of type 2 diabetes. However, most available evidence is from cross-sectional study or longitudinal study, and there is a lack of studies in the northeast China.

Objective

To explore the association between TyG and its derivatives index called triglyceride glucose-body mass index (TyG-BMI) and the incidence risk of type 2 diabetes, analyze the predictive capacity of TyG and TyG-BMI for type 2 diabetes, so as to provide a scientific basis for the early screening of high risk population with type 2 diabetes.

Methods

A total of 6843 cases of physical examination in the health management center of the Second Affiliated Hospital of Dalian Medical University from January 2015 to December 2017 were included as research subjects. The baseline data of their physical examinations were collected. By the use of nested case-control study method, 209 patients with new-onset type 2 diabetes during follow-up from January 2018 to April 2021 were selected as the case group; 418 cases among those without new-onset type 2 diabetes, endocrine system diseases and malignancies were selected as the control group after 1∶2 matching by propensity score according to the same gender and age ±2 years. TyG and TyG-BMI were calculated based on baseline data. The Cox regression fitted conditional Logistic regression model was used to analyze the relationship between TyG, TyG-BMI and the development of type 2 diabetes. The restricted cubic spline regression model was used to analyze the dose-response relationship between TyG, TyG-BMI and type 2 diabetes. The receiver operating characteristic (ROC) curve was used to analyze the predictive value of TyG and TyG-BMI for type 2 diabetes.

Results

BMI, AC, SBP, DBP, FPG, TG, TC, LDL-C, TyG, and TyG-BMI in the case group were higher than the control group, and HDL-C in the case group was lower than the control group (P<0.05) . Quartile Q1 group of baseline TyG: TyG<8.46, 157 cases; Quartile Q2 group of baseline TyG: 8.46≤TyG<8.83, 157 cases; quartile Q3 group of baseline TyG: 8.83≤TyG<9.19, 156 cases; Quartile Q4 group of baseline TyG: TyG≥9.19, 157 cases. The risk of type 2 diabetes in quartile Q2 group of baseline TyG, quartile Q3 group of baseline TyG and quartile Q4 group of baseline TyG was 1.57 〔95%CI (0.92, 2.70) 〕, 2.07 〔95%CI (1.21, 3.53) 〕and 3.18 〔95%CI (1.76, 5.75) 〕 times higher than quartile Q1 group of baseline TyG (Ptrend<0.001) , respectively. The risk of type 2 diabetes in quartile Q2 group of baseline TyG, quartile Q3 group of baseline TyG and quartile Q4 group of baseline TyG was 2.21 times 〔95%CI (1.25, 3.94) 〕, 2.92 times 〔95%CI (1.58, 5.37) 〕, and 5.34 times 〔95%CI (2.39, 11.95) 〕 higher than quartile Q1 group of baseline TyG (Ptrend< 0.001) , respectively. The association between continuous changes in TyG, TyG-BMI and type 2 diabetes showed a linear dose-response relationship (non-linear test, P>0.05) , with an increasing shape in the dose-response relationship. The incidence risk of type 2 diabetes gradually increased when TyG and TyG-BMI were higher than 8.838 and 229.364, respectively. The area under the ROC curve (AUC) for TyG and TyG-BMI to predict type 2 diabetes was 0.696 〔95%CI (0.658, 0.732) 〕and 0.725〔95%CI (0.688, 0.760) 〕with the optimal cut-offs of 8.650 and 224.859, respectively.

Conclusions

Increased TyG and TyG-BMI levels are independent risk factors for type 2 diabetes, showing a linear dose-response relationship with type 2 diabetes, both of which have predictive value for type 2 diabetes. TyG-BMI may be a better prediction index considering the strength of risk association, AUC, and clinical impact of screening results.

Key words: Diabetes mellitus, type 2, TyG, TyG-BMI, Case-control studies, Nested case-control study, Restrictive cubic splines