
Page 55 - 2022-33-中国全科医学
P. 55
·4148· http://www.chinagp.net E-mail:zgqkyx@chinagp.net.cn
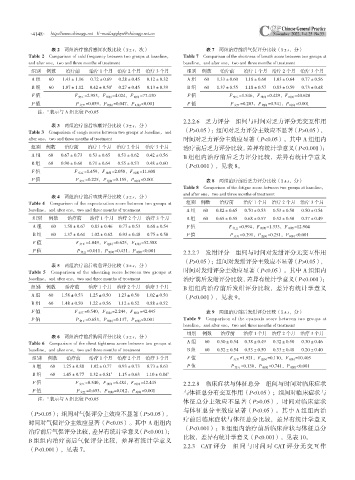
表 2 两组治疗前后感冒次数比较( ±s,次) 表 7 两组治疗前后气促评分比较( ±s,分)
Table 2 Comparison of cold frequency between two groups at baseline, Table 7 Comparison of the shortness of breath score between two groups at
and after one,two and three months of treatment baseline,and after one,two and three months of treatment
组别 例数 治疗前 治疗 1 个月 治疗 2 个月 治疗 3 个月 组别 例数 治疗前 治疗 1 个月 治疗 2 个月 治疗 3 个月
A组 60 1.43±1.16 0.72±0.69 0.28±0.45 0.12±0.32 A组 60 1.33±0.60 1.18±0.60 1.03±0.64 0.77±0.56
B组 60 1.07±1.12 0.42±0.50 a 0.27±0.45 0.13±0.39 B组 60 1.37±0.55 1.18±0.57 0.83±0.59 0.73±0.48
F 值 F 交互 =2.953,F 组间 =4.024,F 时间 =77.430 F 值 F 交互 =1.546,F 组间 =0.429,F 时间 =40.620
P 值 P 交互 =0.059,P 组间 =0.047,P 时间 <0.001 P 值 P 交互 =0.203,P 组间 =0.541,P 时间 <0.001
a
注: 表示与 A 组比较 P<0.05
2.2.2.6 乏力评分 组间与时间对乏力评分无交互作用
表 3 两组治疗前后咳嗽评分比较( ±s,分)
Table 3 Comparison of cough scores between two groups at baseline,and (P>0.05);组间对乏力评分主效应不显著(P>0.05),
after one,two and three months of treatment 时间对乏力评分主效应显著(P<0.05)。其中 A 组组内
组别 例数 治疗前 治疗 1 个月 治疗 2 个月 治疗 3 个月 治疗前后乏力评分比较,差异有统计学意义(P<0.001);
A组 60 0.67±0.73 0.53±0.65 0.53±0.62 0.42±0.56 B 组组内治疗前后乏力评分比较,差异有统计学意义
B组 60 0.90±0.60 0.71±0.64 0.55±0.53 0.48±0.60
(P<0.001),见表 8。
F 值 F 交互 =1.459,F 组间 =2.050,F 时间 =11.608
P 值 P 交互 =0.225,P 组间 =0.155,P 时间 <0.001 表 8 两组治疗前后乏力评分比较( ±s,分)
Table 8 Comparison of the fatigue score between two groups at baseline,
and after one,two and three months of treatment
表 4 两组治疗前后咳痰评分比较( ±s,分)
Table 4 Comparison of the expectoration score between two groups at 组别 例数 治疗前 治疗 1 个月 治疗 2 个月 治疗 3 个月
baseline,and after one,two and three months of treatment A组 60 0.82±0.65 0.70±0.53 0.53±0.50 0.50±0.54
组别 例数 治疗前 治疗 1 个月 治疗 2 个月 治疗 3 个月 B组 60 0.65±0.55 0.68±0.57 0.52±0.50 0.37±0.49
A组 60 1.58±0.67 0.83±0.46 0.77±0.53 0.68±0.54 F 值 F 交互 =0.994,F 组间 =1.333,F 时间 =12.904
B组 60 1.37±0.61 1.02±0.62 0.93±0.48 0.75±0.50 P 值 P 交互 =0.391,P 组间 =0.251,P 时间 <0.001
F 值 F 交互 =4.049,F 组间 =0.625,F 时间 =52.588
P 值 P 交互 =0.011,P 组间 =0.431,P 时间 <0.001 2.2.2.7 发绀评分 组间与时间对发绀评分无交互作用
(P>0.05);组间对发绀评分主效应不显著(P>0.05),
表 5 两组治疗前后喘息评分比较( ±s,分)
Table 5 Comparison of the wheezing score between two groups at 时间对发绀评分主效应显著(P<0.05)。其中 A 组组内
baseline,and after one,two and three months of treatment 治疗前后发绀评分比较,差异有统计学意义(P<0.001);
组别 例数 治疗前 治疗 1 个月 治疗 2 个月 治疗 3 个月 B 组组内治疗前后发绀评分比较,差异有统计学意义
A组 60 1.58±0.53 1.25±0.50 1.23±0.50 1.02±0.50 (P<0.001),见表 9。
B组 60 1.48±0.50 1.22±0.56 1.12±0.52 0.88±0.52
F 值 F 交互 =0.540,F 组间 =2.244,F 时间 =42.445 表 9 两组治疗前后发绀评分比较( ±s,分)
P 值 P 交互 =0.653,P 组间 =0.137,P 时间 <0.001 Table 9 Comparison of the cyanosis score between two groups at
baseline,and after one,two and three months of treatment
组别 例数 治疗前 治疗 1 个月 治疗 2 个月 治疗 3 个月
表 6 两组治疗前后胸闷评分比较( ±s,分)
Table 6 Comparison of the chest tightness score between two groups at A组 60 0.50±0.54 0.38±0.49 0.32±0.50 0.30±0.46
baseline,and after one,two and three months of treatment B组 60 0.52±0.54 0.53±0.50 0.33±0.48 0.20±0.40
组别 例数 治疗前 治疗 1 个月 治疗 2 个月 治疗 3 个月 F 值 F 交互 =1.921,F 组间 =0.110,F 时间 =10.405
A组 60 1.25±0.88 1.02±0.77 0.93±0.73 0.73±0.63 P 值 P 交互 =0.130,P 组间 =0.741,P 时间 <0.001
B组 60 1.45±0.77 1.32±0.81 a 1.15±0.63 1.10±0.84 a
F 值 F 交互 =0.540,F 组间 =6.484,F 时间 =42.445 2.2.2.8 临床症状与体征总分 组间与时间对临床症状
P 值 P 交互 =0.653,P 组间 =0.012,P 时间 <0.001 与体征总分有交互作用(P<0.05);组间对临床症状与
a
注: 表示与 A 组比较 P<0.05
体征总分主效应不显著(P>0.05),时间对临床症状
与体征总分主效应显著(P<0.05)。其中 A 组组内治
(P>0.05);组间对气促评分主效应不显著(P>0.05),
疗前后临床症状与体征总分比较,差异有统计学意义
时间对气促评分主效应显著(P<0.05)。其中 A 组组内
(P<0.001);B 组组内治疗前后临床症状与体征总分
治疗前后气促评分比较,差异有统计学意义(P<0.001);
比较,差异有统计学意义(P<0.001),见表 10。
B 组组内治疗前后气促评分比较,差异有统计学意义
2.2.3 CAT 评分 组间与时间对 CAT 评分无交互作
(P<0.001),见表 7。