
Chinese General Practice ›› 2026, Vol. 29 ›› Issue (02): 264-272.DOI: 10.12114/j.issn.1007-9572.2024.0455
Special Issue: 呼吸疾病文章合辑
• Article·Epidemiological Study • Previous Articles
Received:2024-09-10
Revised:2024-12-20
Published:2026-01-15
Online:2025-12-11
Contact:
DING Yuanlin
通讯作者:
丁元林
作者简介:作者贡献:
陈学琴进行文章构思,负责研究的实施,数据分析及解释以及文章撰写;王仕鸿进行数据的收集和整理;赖凤霞对数据进行统计分析、图表的绘制与展示;张晶晶对论文进行修订;陈浩进行大纲设计;孔丹莉获取经费,提供支持性贡献等;丁元林负责文章的指导与审查,对文章整体负责。
基金资助:CLC Number:
Add to citation manager EndNote|Ris|BibTeX
URL: https://www.chinagp.net/EN/10.12114/j.issn.1007-9572.2024.0455
| 指标 | 发病情况 | 患病情况 | 死亡情况 | ||||||
|---|---|---|---|---|---|---|---|---|---|
| 例数(万) | 粗发病率(1/10万) | 标化发病率(1/10万) | 例数(万) | 患病率(1/10万) | 标化患病率(1/10万) | 例数(万) | 粗患病率(1/10万) | 标化死亡率(1/10万) | |
| 总人群 | |||||||||
| 1990年 | 216.10 | 183.69 | 149.70 | 2 314.50 | 1 967.34 | 1 603.40 | 133.00 | 106.83 | 92.14 |
| 2021年 | 443.44 | 311.68 | 307.20 | 5 058.84 | 3 555.69 | 3 504.57 | 123.96 | 87.33 | 85.88 |
| 变化率(%) | 105.20 | 69.68 | 105.20 | 118.57 | 80.74 | 118.57 | -18.26 | -6.80 | -6.80 |
| EAPC(%) | — | 1.66c | 2.25c | — | 1.94c | 2.53c | — | -0.70c | -0.31a |
| 男性 | |||||||||
| 1990年 | 104.64 | 172.43 | 145.05 | 1 088.97 | 1 794.49 | 1 509.48 | 70.07 | 108.97 | 97.13 |
| 2021年 | 222.68 | 305.84 | 308.68 | 2 422.56 | 3 327.22 | 3 358.06 | 72.90 | 100.37 | 101.05 |
| 变化率(%) | 112.81 | 77.37 | 112.81 | 122.46 | 85.41 | 122.46 | 4.04 | -7.89 | 4.04 |
| EAPC(%) | — | 1.71c | 2.32c | — | 1.93c | 2.48c | — | -0.31b | 0.05 |
| 女性 | |||||||||
| 1990年 | 111.46 | 195.67 | 161.92 | 1 225.53 | 2 151.49 | 1 780.36 | 62.93 | 104.55 | 91.43 |
| 2021年 | 220.76 | 317.80 | 320.70 | 2 636.28 | 3 795.16 | 3 829.79 | 51.06 | 73.66 | 74.18 |
| 变化率(%) | 98.06 | 62.41 | 98.06 | 115.11 | 76.40 | 115.11 | -18.87 | -29.54 | -18.87 |
| EAPC(%) | — | 1.54c | 2.19c | — | 1.94c | 2.59c | — | -1.19c | -0.77b |
Table 1 Incidence, morbidity and mortality of chronic obstructive pulmonary disease in China, 1990-2021
| 指标 | 发病情况 | 患病情况 | 死亡情况 | ||||||
|---|---|---|---|---|---|---|---|---|---|
| 例数(万) | 粗发病率(1/10万) | 标化发病率(1/10万) | 例数(万) | 患病率(1/10万) | 标化患病率(1/10万) | 例数(万) | 粗患病率(1/10万) | 标化死亡率(1/10万) | |
| 总人群 | |||||||||
| 1990年 | 216.10 | 183.69 | 149.70 | 2 314.50 | 1 967.34 | 1 603.40 | 133.00 | 106.83 | 92.14 |
| 2021年 | 443.44 | 311.68 | 307.20 | 5 058.84 | 3 555.69 | 3 504.57 | 123.96 | 87.33 | 85.88 |
| 变化率(%) | 105.20 | 69.68 | 105.20 | 118.57 | 80.74 | 118.57 | -18.26 | -6.80 | -6.80 |
| EAPC(%) | — | 1.66c | 2.25c | — | 1.94c | 2.53c | — | -0.70c | -0.31a |
| 男性 | |||||||||
| 1990年 | 104.64 | 172.43 | 145.05 | 1 088.97 | 1 794.49 | 1 509.48 | 70.07 | 108.97 | 97.13 |
| 2021年 | 222.68 | 305.84 | 308.68 | 2 422.56 | 3 327.22 | 3 358.06 | 72.90 | 100.37 | 101.05 |
| 变化率(%) | 112.81 | 77.37 | 112.81 | 122.46 | 85.41 | 122.46 | 4.04 | -7.89 | 4.04 |
| EAPC(%) | — | 1.71c | 2.32c | — | 1.93c | 2.48c | — | -0.31b | 0.05 |
| 女性 | |||||||||
| 1990年 | 111.46 | 195.67 | 161.92 | 1 225.53 | 2 151.49 | 1 780.36 | 62.93 | 104.55 | 91.43 |
| 2021年 | 220.76 | 317.80 | 320.70 | 2 636.28 | 3 795.16 | 3 829.79 | 51.06 | 73.66 | 74.18 |
| 变化率(%) | 98.06 | 62.41 | 98.06 | 115.11 | 76.40 | 115.11 | -18.87 | -29.54 | -18.87 |
| EAPC(%) | — | 1.54c | 2.19c | — | 1.94c | 2.59c | — | -1.19c | -0.77b |
| 年龄组(岁) | 1990年(1/10万) | 2021年(1/10万) | 变化率(%) | EAPC(%) | t值 | P值 |
|---|---|---|---|---|---|---|
| 25~29 | 45.88 | 28.71 | -37.42 | 0.05 | -8.33 | <0.01 |
| 30~34 | 27.66 | 32.80 | 18.61 | -0.32 | -1.21 | 0.235 |
| 35~39 | 38.29 | 41.27 | 7.77 | 0.04 | 0.13 | 0.895 |
| 40~44 | 94.65 | 86.96 | -8.12 | -0.11 | -0.36 | 0.725 |
| 45~49 | 131.63 | 185.67 | 41.05 | 1.22 | 6.02 | <0.001 |
| 50~54 | 147.87 | 285.14 | 92.83 | 2.35 | 15.83 | <0.001 |
| 55~59 | 173.45 | 387.33 | 123.31 | 2.60 | 16.02 | <0.001 |
| 60~64 | 375.92 | 565.05 | 50.31 | 1.86 | 10.87 | <0.001 |
| 65~69 | 473.37 | 985.95 | 108.28 | 2.04 | 12.81 | <0.001 |
| 70~74 | 644.50 | 1 485.14 | 130.43 | 2.27 | 27.90 | <0.001 |
| 75~79 | 719.34 | 1 840.19 | 155.82 | 3.02 | 114.08 | <0.001 |
| ≥80 | 562.89 | 2 252.07 | 300.09 | 4.46 | 82.92 | <0.001 |
Table 2 Current status of COPD incidence in China by age group, 1990-2021
| 年龄组(岁) | 1990年(1/10万) | 2021年(1/10万) | 变化率(%) | EAPC(%) | t值 | P值 |
|---|---|---|---|---|---|---|
| 25~29 | 45.88 | 28.71 | -37.42 | 0.05 | -8.33 | <0.01 |
| 30~34 | 27.66 | 32.80 | 18.61 | -0.32 | -1.21 | 0.235 |
| 35~39 | 38.29 | 41.27 | 7.77 | 0.04 | 0.13 | 0.895 |
| 40~44 | 94.65 | 86.96 | -8.12 | -0.11 | -0.36 | 0.725 |
| 45~49 | 131.63 | 185.67 | 41.05 | 1.22 | 6.02 | <0.001 |
| 50~54 | 147.87 | 285.14 | 92.83 | 2.35 | 15.83 | <0.001 |
| 55~59 | 173.45 | 387.33 | 123.31 | 2.60 | 16.02 | <0.001 |
| 60~64 | 375.92 | 565.05 | 50.31 | 1.86 | 10.87 | <0.001 |
| 65~69 | 473.37 | 985.95 | 108.28 | 2.04 | 12.81 | <0.001 |
| 70~74 | 644.50 | 1 485.14 | 130.43 | 2.27 | 27.90 | <0.001 |
| 75~79 | 719.34 | 1 840.19 | 155.82 | 3.02 | 114.08 | <0.001 |
| ≥80 | 562.89 | 2 252.07 | 300.09 | 4.46 | 82.92 | <0.001 |
| 年龄组(岁) | 1990年(1/10万) | 2021年(1/10万) | 变化率(%) | EAPC(%) | t值 | P值 |
|---|---|---|---|---|---|---|
| 25~29 | 773.61 | 486.30 | -37.14 | -1.52 | -8.15 | <0.001 |
| 30~34 | 587.97 | 653.73 | 11.18 | -0.57 | -2.09 | 0.045 |
| 35~39 | 936.87 | 900.54 | -3.88 | -0.40 | -1.35 | 0.187 |
| 40~44 | 978.72 | 1 097.00 | 12.08 | 0.60 | 2.08 | 0.047 |
| 45~49 | 1 069.27 | 1 736.22 | 62.37 | 1.71 | 8.62 | <0.001 |
| 50~54 | 1 545.00 | 2 948.97 | 90.87 | 2.27 | 15.25 | <0.001 |
| 55~59 | 2 383.13 | 4 833.41 | 102.82 | 2.21 | 12.71 | <0.001 |
| 60~64 | 3 699.09 | 6 383.16 | 72.56 | 2.35 | 15.03 | <0.001 |
| 65~69 | 4 334.56 | 10 181.53 | 134.89 | 2.49 | 18.71 | <0.001 |
| 70~74 | 6 309.95 | 15 808.59 | 150.53 | 2.65 | 45.16 | <0.001 |
| 75~79 | 7 781.51 | 21 873.83 | 181.10 | 3.48 | 63.72 | <0.001 |
| ≥80 | 5 194.63 | 26 810.43 | 416.12 | 5.59 | 86.99 | <0.001 |
Table 3 Current status of COPD prevalence in China by age group, 1990-2021
| 年龄组(岁) | 1990年(1/10万) | 2021年(1/10万) | 变化率(%) | EAPC(%) | t值 | P值 |
|---|---|---|---|---|---|---|
| 25~29 | 773.61 | 486.30 | -37.14 | -1.52 | -8.15 | <0.001 |
| 30~34 | 587.97 | 653.73 | 11.18 | -0.57 | -2.09 | 0.045 |
| 35~39 | 936.87 | 900.54 | -3.88 | -0.40 | -1.35 | 0.187 |
| 40~44 | 978.72 | 1 097.00 | 12.08 | 0.60 | 2.08 | 0.047 |
| 45~49 | 1 069.27 | 1 736.22 | 62.37 | 1.71 | 8.62 | <0.001 |
| 50~54 | 1 545.00 | 2 948.97 | 90.87 | 2.27 | 15.25 | <0.001 |
| 55~59 | 2 383.13 | 4 833.41 | 102.82 | 2.21 | 12.71 | <0.001 |
| 60~64 | 3 699.09 | 6 383.16 | 72.56 | 2.35 | 15.03 | <0.001 |
| 65~69 | 4 334.56 | 10 181.53 | 134.89 | 2.49 | 18.71 | <0.001 |
| 70~74 | 6 309.95 | 15 808.59 | 150.53 | 2.65 | 45.16 | <0.001 |
| 75~79 | 7 781.51 | 21 873.83 | 181.10 | 3.48 | 63.72 | <0.001 |
| ≥80 | 5 194.63 | 26 810.43 | 416.12 | 5.59 | 86.99 | <0.001 |
| 年龄组(岁) | 1990年(1/10万) | 2021年(1/10万) | 变化率(%) | EAPC(%) | t值 | P值 |
|---|---|---|---|---|---|---|
| 25~29 | 1.61 | 0.36 | -77.72 | -3.80 | -4.10 | <0.001 |
| 30~34 | 2.37 | 0.69 | -70.85 | -3.53 | -4.20 | <0.001 |
| 35~39 | 3.56 | 1.23 | -65.52 | -3.73 | -4.49 | <0.001 |
| 40~44 | 9.31 | 2.75 | -70.46 | -3.08 | -4.86 | <0.001 |
| 45~49 | 11.19 | 4.89 | -56.30 | -1.96 | -3.90 | <0.001 |
| 50~54 | 21.18 | 11.72 | -44.67 | -2.15 | -3.99 | <0.001 |
| 55~59 | 43.16 | 23.81 | -44.84 | -2.20 | -4.32 | <0.001 |
| 60~64 | 120.04 | 56.49 | -52.94 | -1.87 | -4.43 | <0.001 |
| 65~69 | 190.87 | 122.28 | -35.93 | -1.49 | -3.68 | <0.001 |
| 70~74 | 483.54 | 325.34 | -32.72 | -1.36 | -3.99 | <0.001 |
| 75~79 | 864.97 | 678.45 | -21.56 | -0.68 | -3.97 | <0.001 |
| ≥80 | 1 369.65 | 1 913.91 | 39.74 | 0.95 | 4.28 | <0.001 |
Table 4 Current status of COPD mortality in China by age group, 1990-2021
| 年龄组(岁) | 1990年(1/10万) | 2021年(1/10万) | 变化率(%) | EAPC(%) | t值 | P值 |
|---|---|---|---|---|---|---|
| 25~29 | 1.61 | 0.36 | -77.72 | -3.80 | -4.10 | <0.001 |
| 30~34 | 2.37 | 0.69 | -70.85 | -3.53 | -4.20 | <0.001 |
| 35~39 | 3.56 | 1.23 | -65.52 | -3.73 | -4.49 | <0.001 |
| 40~44 | 9.31 | 2.75 | -70.46 | -3.08 | -4.86 | <0.001 |
| 45~49 | 11.19 | 4.89 | -56.30 | -1.96 | -3.90 | <0.001 |
| 50~54 | 21.18 | 11.72 | -44.67 | -2.15 | -3.99 | <0.001 |
| 55~59 | 43.16 | 23.81 | -44.84 | -2.20 | -4.32 | <0.001 |
| 60~64 | 120.04 | 56.49 | -52.94 | -1.87 | -4.43 | <0.001 |
| 65~69 | 190.87 | 122.28 | -35.93 | -1.49 | -3.68 | <0.001 |
| 70~74 | 483.54 | 325.34 | -32.72 | -1.36 | -3.99 | <0.001 |
| 75~79 | 864.97 | 678.45 | -21.56 | -0.68 | -3.97 | <0.001 |
| ≥80 | 1 369.65 | 1 913.91 | 39.74 | 0.95 | 4.28 | <0.001 |
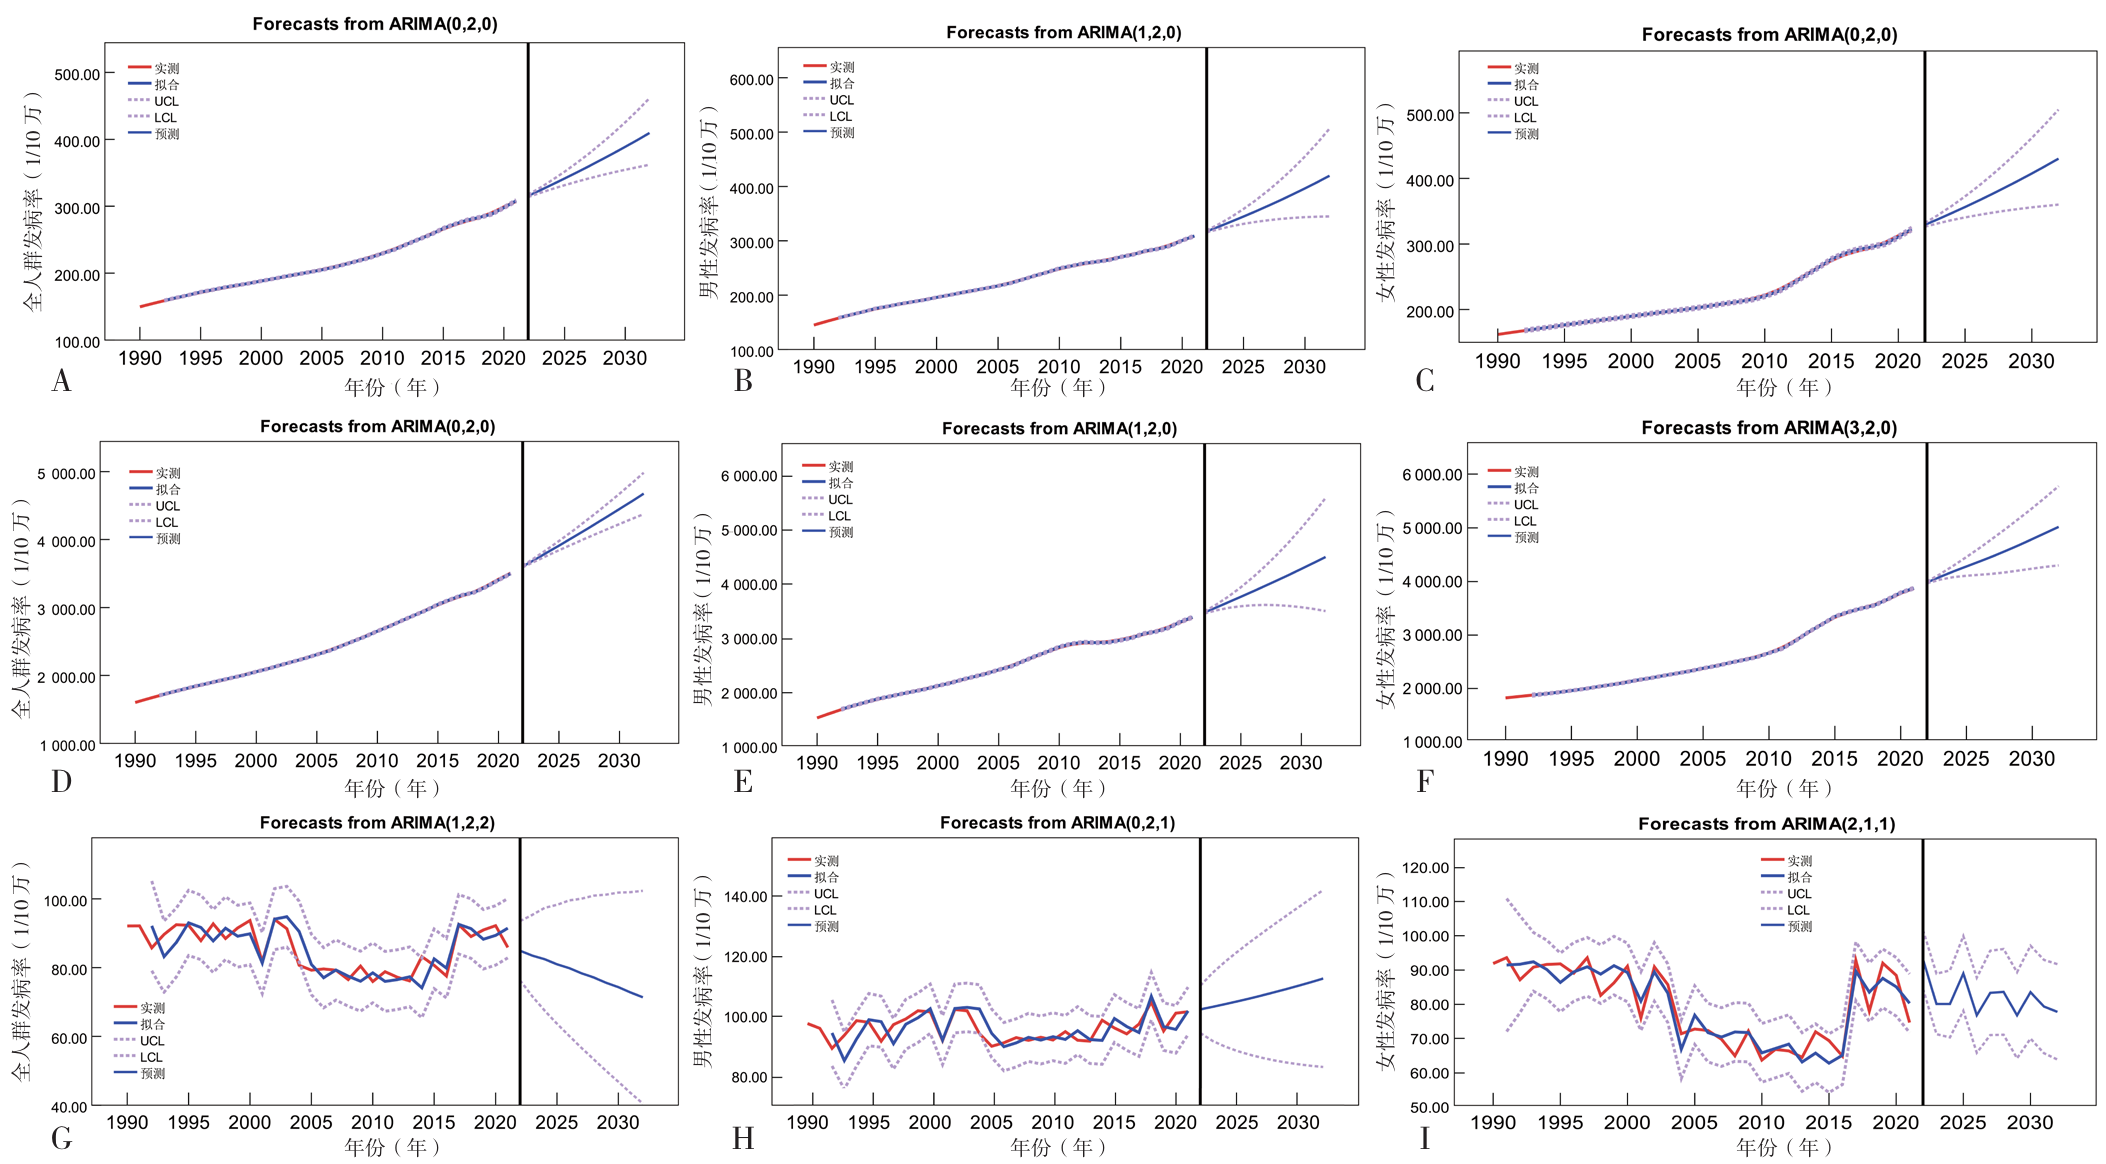
Figure 1 An ARIMA model for predicting the incidence, prevalence, and mortality of chronic obstructive pulmonary disease in China, 2022-2032
| 年份 | 全人群 | 95%CI | 男性 | 95%CI | 女性 | 95%CI |
|---|---|---|---|---|---|---|
| 2022年 | 315.46 | 313.76~317.17 | 317.25 | 315.60~319.80 | 329.22 | 326.40~332.05 |
| 2023年 | 323.91 | 320.02~327.84 | 326.09 | 321.61~330.60 | 338.00 | 331.63~344.42 |
| 2024年 | 332.55 | 325.88~339.33 | 335.19 | 326.74~343.81 | 347.05 | 336.28~357.95 |
| 2025年 | 341.39 | 331.41~351.61 | 344.58 | 331.09~358.49 | 356.37 | 340.44~372.59 |
| 2026年 | 350.44 | 336.61~364.69 | 354.26 | 334.73~374.65 | 365.98 | 344.18~388.29 |
| 2027年 | 359.70 | 341.52~378.60 | 364.26 | 337.75~392.32 | 375.89 | 347.56~405.06 |
| 2028年 | 369.17 | 346.14~393.34 | 374.58 | 340.18~411.56 | 386.10 | 350.60~422.88 |
| 2029年 | 378.87 | 350.49~408.96 | 385.25 | 342.06~432.46 | 396.61 | 353.35~441.76 |
| 2030年 | 388.80 | 354.56~425.50 | 396.28 | 343.43~455.11 | 407.45 | 355.81~461.72 |
| 2031年 | 398.97 | 358.37~442.98 | 407.72 | 344.32~479.63 | 418.62 | 358.02~482.77 |
| 2032年 | 409.39 | 361.91~461.46 | 419.57 | 344.75~506.15 | 430.13 | 359.99~504.93 |
Table 5 Projections of COPD incidence in China based on ARIMA model, 2022-2032
| 年份 | 全人群 | 95%CI | 男性 | 95%CI | 女性 | 95%CI |
|---|---|---|---|---|---|---|
| 2022年 | 315.46 | 313.76~317.17 | 317.25 | 315.60~319.80 | 329.22 | 326.40~332.05 |
| 2023年 | 323.91 | 320.02~327.84 | 326.09 | 321.61~330.60 | 338.00 | 331.63~344.42 |
| 2024年 | 332.55 | 325.88~339.33 | 335.19 | 326.74~343.81 | 347.05 | 336.28~357.95 |
| 2025年 | 341.39 | 331.41~351.61 | 344.58 | 331.09~358.49 | 356.37 | 340.44~372.59 |
| 2026年 | 350.44 | 336.61~364.69 | 354.26 | 334.73~374.65 | 365.98 | 344.18~388.29 |
| 2027年 | 359.70 | 341.52~378.60 | 364.26 | 337.75~392.32 | 375.89 | 347.56~405.06 |
| 2028年 | 369.17 | 346.14~393.34 | 374.58 | 340.18~411.56 | 386.10 | 350.60~422.88 |
| 2029年 | 378.87 | 350.49~408.96 | 385.25 | 342.06~432.46 | 396.61 | 353.35~441.76 |
| 2030年 | 388.80 | 354.56~425.50 | 396.28 | 343.43~455.11 | 407.45 | 355.81~461.72 |
| 2031年 | 398.97 | 358.37~442.98 | 407.72 | 344.32~479.63 | 418.62 | 358.02~482.77 |
| 2032年 | 409.39 | 361.91~461.46 | 419.57 | 344.75~506.15 | 430.13 | 359.99~504.93 |
| 年份 | 全人群 | 95%CI | 男性 | 95%CI | 女性 | 95%CI |
|---|---|---|---|---|---|---|
| 2022年 | 3 603.96 | 3 592.08~3 615.86 | 3 449.85 | 3 430.87~3 468.86 | 3 940.32 | 3 923.14~3 957.53 |
| 2023年 | 3 704.75 | 3 677.83~3 731.75 | 3 543.65 | 3 489.67~3 597.95 | 4 045.96 | 3 994.32~4 097.85 |
| 2024年 | 3 806.94 | 3 761.31~3 852.78 | 3 639.28 | 3 533.84~3 745.90 | 4 144.93 | 4 039.35~4 251.55 |
| 2025年 | 3 910.54 | 3 842.91~3 978.62 | 3 736.65 | 3 564.23~3 912.15 | 4 238.99 | 4 065.73~4 415.00 |
| 2026年 | 4 015.55 | 3 922.86~4 109.06 | 3 835.73 | 3 581.91~4 096.11 | 4 332.23 | 4 083.82~4 586.20 |
| 2027年 | 4 121.97 | 4 001.32~4 243.98 | 3 936.56 | 3 587.94~4 297.33 | 4 428.75 | 4 103.40~4 763.51 |
| 2028年 | 4 229.81 | 4 078.42~4 383.30 | 4 039.17 | 3 583.30~4 515.51 | 4 531.06 | 4 129.61~4 946.57 |
| 2029年 | 4 339.08 | 4 154.23~4 526.98 | 4 143.63 | 3 568.89~4 750.47 | 4 639.29 | 4 162.60~5 135.45 |
| 2030年 | 4 449.78 | 4 228.83~4 674.99 | 4 250.03 | 3 545.48~5 002.15 | 4 751.69 | 4 198.63~5 330.50 |
| 2031年 | 4 561.91 | 4 302.27~4 827.31 | 4 358.44 | 3 513.80~5 270.59 | 4 865.70 | 4 232.42~5 532.14 |
| 2032年 | 4 675.48 | 4 374.59~4 983.93 | 4 468.94 | 3 474.47~5 555.91 | 4 979.20 | 4 259.51~5 741.01 |
Table 6 Projected prevalence of COPD in China based on ARIMA model, 2022-2032
| 年份 | 全人群 | 95%CI | 男性 | 95%CI | 女性 | 95%CI |
|---|---|---|---|---|---|---|
| 2022年 | 3 603.96 | 3 592.08~3 615.86 | 3 449.85 | 3 430.87~3 468.86 | 3 940.32 | 3 923.14~3 957.53 |
| 2023年 | 3 704.75 | 3 677.83~3 731.75 | 3 543.65 | 3 489.67~3 597.95 | 4 045.96 | 3 994.32~4 097.85 |
| 2024年 | 3 806.94 | 3 761.31~3 852.78 | 3 639.28 | 3 533.84~3 745.90 | 4 144.93 | 4 039.35~4 251.55 |
| 2025年 | 3 910.54 | 3 842.91~3 978.62 | 3 736.65 | 3 564.23~3 912.15 | 4 238.99 | 4 065.73~4 415.00 |
| 2026年 | 4 015.55 | 3 922.86~4 109.06 | 3 835.73 | 3 581.91~4 096.11 | 4 332.23 | 4 083.82~4 586.20 |
| 2027年 | 4 121.97 | 4 001.32~4 243.98 | 3 936.56 | 3 587.94~4 297.33 | 4 428.75 | 4 103.40~4 763.51 |
| 2028年 | 4 229.81 | 4 078.42~4 383.30 | 4 039.17 | 3 583.30~4 515.51 | 4 531.06 | 4 129.61~4 946.57 |
| 2029年 | 4 339.08 | 4 154.23~4 526.98 | 4 143.63 | 3 568.89~4 750.47 | 4 639.29 | 4 162.60~5 135.45 |
| 2030年 | 4 449.78 | 4 228.83~4 674.99 | 4 250.03 | 3 545.48~5 002.15 | 4 751.69 | 4 198.63~5 330.50 |
| 2031年 | 4 561.91 | 4 302.27~4 827.31 | 4 358.44 | 3 513.80~5 270.59 | 4 865.70 | 4 232.42~5 532.14 |
| 2032年 | 4 675.48 | 4 374.59~4 983.93 | 4 468.94 | 3 474.47~5 555.91 | 4 979.20 | 4 259.51~5 741.01 |
| 年份 | 全人群 | 95%CI | 男性 | 95%CI | 女性 | 95%CI |
|---|---|---|---|---|---|---|
| 2022年 | 84.93 | 76.31~93.56 | 101.85 | 93.95~109.74 | 92.63 | 84.07~101.19 |
| 2023年 | 83.49 | 71.61~95.37 | 102.68 | 91.35~114.02 | 79.62 | 70.79~88.44 |
| 2024年 | 82.45 | 67.50~97.40 | 103.56 | 89.48~117.64 | 79.62 | 69.86~89.38 |
| 2025年 | 80.98 | 63.69~98.27 | 104.48 | 88.00~120.96 | 88.51 | 77.59~99.43 |
| 2026年 | 79.86 | 60.15~99.56 | 105.44 | 86.78~124.10 | 76.32 | 65.36~87.28 |
| 2027年 | 78.36 | 56.65~100.07 | 106.45 | 85.77~127.13 | 82.85 | 70.53~95.16 |
| 2028年 | 77.15 | 53.34~100.95 | 107.49 | 84.91~130.08 | 83.14 | 70.63~95.65 |
| 2029年 | 75.61 | 49.99~101.24 | 108.58 | 84.18~132.98 | 76.30 | 63.73~88.86 |
| 2030年 | 74.32 | 46.80~101.84 | 109.71 | 83.58~135.85 | 83.06 | 69.50~96.63 |
| 2031年 | 72.75 | 43.55~101.96 | 110.88 | 83.08~138.69 | 78.85 | 65.24~92.46 |
| 2032年 | 71.39 | 40.42~102.35 | 112.10 | 82.68~141.51 | 77.32 | 63.40~91.23 |
Table 7 Projected mortality rate of COPD in China based on ARIMA model, 2022-2032
| 年份 | 全人群 | 95%CI | 男性 | 95%CI | 女性 | 95%CI |
|---|---|---|---|---|---|---|
| 2022年 | 84.93 | 76.31~93.56 | 101.85 | 93.95~109.74 | 92.63 | 84.07~101.19 |
| 2023年 | 83.49 | 71.61~95.37 | 102.68 | 91.35~114.02 | 79.62 | 70.79~88.44 |
| 2024年 | 82.45 | 67.50~97.40 | 103.56 | 89.48~117.64 | 79.62 | 69.86~89.38 |
| 2025年 | 80.98 | 63.69~98.27 | 104.48 | 88.00~120.96 | 88.51 | 77.59~99.43 |
| 2026年 | 79.86 | 60.15~99.56 | 105.44 | 86.78~124.10 | 76.32 | 65.36~87.28 |
| 2027年 | 78.36 | 56.65~100.07 | 106.45 | 85.77~127.13 | 82.85 | 70.53~95.16 |
| 2028年 | 77.15 | 53.34~100.95 | 107.49 | 84.91~130.08 | 83.14 | 70.63~95.65 |
| 2029年 | 75.61 | 49.99~101.24 | 108.58 | 84.18~132.98 | 76.30 | 63.73~88.86 |
| 2030年 | 74.32 | 46.80~101.84 | 109.71 | 83.58~135.85 | 83.06 | 69.50~96.63 |
| 2031年 | 72.75 | 43.55~101.96 | 110.88 | 83.08~138.69 | 78.85 | 65.24~92.46 |
| 2032年 | 71.39 | 40.42~102.35 | 112.10 | 82.68~141.51 | 77.32 | 63.40~91.23 |
| [1] |
中华医学会, 中华医学会杂志社, 中华医学会全科医学分会, 等. 中国慢性阻塞性肺疾病基层诊疗与管理指南(2024年)[J]. 中华全科医师杂志, 2024, 23(6): 578-602. DOI: 10.3760/cma.j.cn114798-20240326-00174.
|
| [2] |
中华医学会呼吸病学分会慢性阻塞性肺疾病学组, 中国医师协会呼吸医师分会慢性阻塞性肺疾病工作委员会. 慢性阻塞性肺疾病诊治指南(2021年修订版)[J]. 中华结核和呼吸杂志, 2021, 44(3): 170-205. DOI: 10.3760/cma.j.cn112147-20210109-00031.
|
| [3] |
GBD 2016 Causes of Death Collaborators. Global, regional, and national age-sex specific mortality for 264 causes of death, 1980-2016: a systematic analysis for the Global Burden of Disease Study 2016[J]. Lancet, 2017, 390(10100): 1151-1210. DOI: 10.1016/S0140-6736(17)32152-9.
|
| [4] |
|
| [5] |
李薇, 杨汀, 王辰. 中国慢性阻塞性肺疾病防治现状及进展[J]. 中国研究型医院, 2020, 7(5): 1-5, 78-84. DOI: 10.19450/j.cnki.jcrh.2020.05.001.
|
| [6] |
屈彦, 王天一, 杨津, 等. GBD数据库的数据提取方法与流程[J]. 中国循证心血管医学杂志, 2019, 11(9): 1043-1046. DOI: 10.3969/j.issn.1674-4055.2019.09.04.
|
| [7] |
张敏, 段朝晖, 徐杰茹, 等. 基于GBD数据分析与预测2000—2030年中国胰腺癌发病与死亡趋势[J]. 中国肿瘤, 2022, 31(11): 862-868. DOI: 10.11735/j.issn.1004-0242.2022.11.A003.
|
| [8] |
陈顺, 林雪梅, 袁乔英, 等. 1990—2019年中国儿童青少年1型糖尿病负担分析与模型预测[J]. 中国儿童保健杂志, 2024, 32(7): 746-751, 784.
|
| [9] |
陶泳宏. 1990~2019年COPD发病率和死亡率趋势及预测分析[D]. 沈阳: 中国医科大学, 2023.
|
| [10] |
文富强, 陈磊. 中国慢性阻塞性肺疾病诊疗的现存问题与思考[J]. 中华医学杂志, 2020, 100(2): 81-84. DOI: 10.3760/cma.j.issn.0376-2491.2020.02.001.
|
| [11] | |
| [12] |
张小娥, 张彩莲. 慢性阻塞性肺疾病流行病学及疾病经济负担研究进展[J]. 中国慢性病预防与控制, 2017, 25(6): 472-476. DOI: 10.16386/j.cjpccd.issn.1004-6194.2017.06.021.
|
| [13] |
陈荣昌, 赵东兴. 应重视中国慢性阻塞性肺疾病的疾病负担和患者特点[J]. 中华医学杂志, 2017, 97(40): 3121-3123. DOI: 10.3760/cma.j.issn.0376-2491.2017.40.001.
|
| [14] |
|
| [15] |
|
| [16] |
李若曈, 饶蓁蓁, 傅晏红, 等. 2030年中国慢性阻塞性肺疾病的疾病负担预测与危险因素控制效果模拟[J]. 中华流行病学杂志, 2022, 43(2): 201-206. DOI: 10.3760/cma.j.cn112338-20210803-00606.
|
| [17] |
侯珊珊, 施劲东, 尹欣, 等. 1990—2019年中国慢性阻塞性肺疾病的疾病负担情况分析[J]. 中华流行病学杂志, 2022, 43(10): 1554-1561. DOI: 10.3760/cma.j.cn112338-20211009-00773.
|
| [18] |
薛天怡, 刘世友, 万金豹, 等. 2010—2019年上海市宝山区居民慢性阻塞性肺疾病死亡情况分析[J]. 上海预防医学, 2022, 34(3): 256-259. DOI: 10.19428/j.cnki.sjpm.2022.21207.
|
| [19] |
赵创艺, 袁空军, 杨媛, 等.基于ARIMA与NNAR模型的中国慢性阻塞性肺疾病疾病负担预测研究[J].中国全科医学, 2022, 25(16): 1942-1949. DOI: 10.12114/j.issn.1007-9572.2022.0045.
|
| [20] |
唐文芳, 刘日辉, 于雅琴, 等. 2000—2014年中国40岁以上成人慢性阻塞性肺疾病患病率的Meta分析[J]. 吉林大学学报(医学版), 2015, 41(5): 961-968. DOI: 10.13481/j.1671-587x.20150515.
|
| [21] |
|
| [22] |
|
| [23] |
中国老年医学学会呼吸病学分会慢性阻塞性肺疾病学组. 中国老年慢性阻塞性肺疾病临床诊治实践指南[J]. 中华结核和呼吸杂志, 2020, 43(2): 100-119. DOI: 10.3706/cma.j.issn.1001-0939.2020.02.007.
|
| [24] |
童朝晖. 中国老年慢性阻塞性肺疾病临床诊治实践指南[J]. 中华结核和呼吸杂志, 2020, 43(2): 100-119.
|
| [25] |
|
| [26] |
|
| [27] |
冯丹, 韩晓娜, 赵文娟, 等. 中国内地法定报告传染病预测和监测的ARIMA模型[J]. 疾病控制杂志, 2007, 11(2): 140-143. DOI: 10.3969/j.issn.1674-3679.2007.02.008.
|
| [28] |
史卫卫, 寻鲁宁, 曹亚景, 等. 河北省居民2015—2018年脑梗死流行特征分析及时间序列预测[J]. 中国公共卫生, 2021, 37(12): 1800-1804. DOI: 10.11847/zgggws1131022.
|
| [29] |
赵晶, 郭晓雷, 吴炳义, 等. GM(1, 1)灰色预测模型和ARIMA模型在拟合山东省心脑血管疾病死亡率中的应用[J]. 现代预防医学, 2016, 43(10): 1732-1734, 1749.
|
| [30] |
马倩倩, 何贤英, 崔芳芳, 等. 基于ARIMA与NNAR模型的中国食管癌疾病负担预测[J]. 中华疾病控制杂志, 2021, 25(9): 1048-1053. DOI: 10.16462/j.cnki.zhjbkz.2021.09.010.
|
| [31] |
中国居民营养与慢性病状况报告(2020年)[J]. 营养学报, 2020, 42(6): 521.
|
| [32] |
陈荣昌, 梁振宇, 王凤燕. 我国慢性阻塞性肺疾病早期防控的现状、挑战与思考[J]. 中华健康管理学杂志, 2022, 16(2): 73-76. DOI: 10.3760/cma.j.cn115624-20211208-00749.
|
| [33] |
陈荣昌. 推动慢性阻塞性肺疾病诊治水平的提高需要全方位和个体化的研究[J]. 中华结核和呼吸杂志, 2017, 40(12): 881-883.
|
| [1] | CHEN Dian, LONG Huanyu, CHU Lanhe, JIANG Yixia, GUO Wanjin, NIU Yang, CHEN Yahong. Interpretation of Global Strategy for the Diagnosis, Treatment, Management and Prevention of Chronic Obstructive Pulmonary Disease 2026 Report [J]. Chinese General Practice, 2026, 29(21): 2913-2932. |
| [2] | WU Yixuan, XIAO Liangman, LIU Xin, YAN Ziqi, WANG Yuting, LIN Shumin, ZHUANG Lixing. Analysis of the Disease Burden of Parkinson's Disease in China and Globally from 1990 to 2021 and Prediction of Future Trends [J]. Chinese General Practice, 2026, 29(20): 2895-2902. |
| [3] | TANG Lijuan, QI Qi, ZHANG Fan, GAO Yifu, CAO Yajing, YUE Fujuan, GAO Jinchai, LIU Xiaoli. Characterisation of the Prevalence of Overweight/Obesity among Residents Aged 18-44 Years in Hebei Province in 2013 and 2020 [J]. Chinese General Practice, 2026, 29(19): 2695-2704. |
| [4] | YUAN Yujuan, TAO Jing, WANG Ying, PENG Hui, YANG Yining. Elevated Neutrophil Percentage to Albumin Ratio is Associated with In-hospital Outcomes in Patients with Acute Myocardial Infarction [J]. Chinese General Practice, 2026, 29(18): 2489-2497. |
| [5] | YU Shan, CHE Yajie, SUBIYINUER· Maimaiti, GUO Kaiyang, FENG Xingxing, YAN Ping. A Comparative Study on the Current Situation and Influencing Factors of Subjective Cognitive Decline among Urban and Rural Elderly People in Xinjiang [J]. Chinese General Practice, 2026, 29(16): 2227-2233. |
| [6] | ZHEN Rui, GU Xufang, GAO Shengwei, ZHANG Bowen, REN Zhenjuan, YANG Ruixuan. Burden of Cardiovascular Diseases Attributable to Metabolic Risk Factors in China 1990—2021 and Projected Trends from 2022 to 2035 [J]. Chinese General Practice, 2026, 29(15): 2077-2083. |
| [7] | LI Jiali, LIU Fan, KE Lixin, LI Huijuan, WANG Haibo, ZHAO Xiaoxiao, ZHAO Xinke, LU Cuncun. Disease Burden of Obesity among Individuals Aged 60 and above Globally and in China from 1990 to 2021: Trend Analysis and Model-based Projection [J]. Chinese General Practice, 2026, 29(15): 2067-2076. |
| [8] | QIU Yanli, GAO Yongyin, BIAN Xueyan, WANG Xue, LI Yue. The Predictive Value of Estimated Pulse Wave Velocity for All-cause and Cardiovascular-related Mortality in Cancer Patients [J]. Chinese General Practice, 2026, 29(14): 1890-1897. |
| [9] | ZHAO Xuedan, AI Yue, JIN Guoen, JIA Guoqiang. The New Research Progress of Non-infectious Lung Diseases in High Altitude Areas [J]. Chinese General Practice, 2026, 29(14): 1931-1938. |
| [10] | YANG Fangting, XU Junfeng, YANG Qin, MA Yingzhi, ZHOU Ling, XIAO Jiangqin. Analysis of the Current Situation and Influencing Factors of Intolerance of Uncertainty in AECOPD Patients under the Perspective of Health Ecology [J]. Chinese General Practice, 2026, 29(11): 1434-1440. |
| [11] | TIAN Ying, PAN Dianzhu. Analysis of Related Factors of Renal Function Impairment in AECOPD Patients [J]. Chinese General Practice, 2026, 29(07): 885-892. |
| [12] | LEI Yingying, ZHENG Siying, WANG Wenxin, JIANG Hong. Prevalence Trend and Prediction of Hypertensive Heart Disease in the World and China from 1990 to 2021 [J]. Chinese General Practice, 2026, 29(05): 641-648. |
| [13] | ZHAO Xuejiao, LI Juan, LI Yujie, LU Ting, Xian Lihong, YAN Huan. Prevalence Trends and Influencing Factors for Post-stroke Cognitive Impairment in China: a Meta-analysis [J]. Chinese General Practice, 2026, 29(03): 380-392. |
| [14] | YANG Qinghui, HU Yingxue, NI Pingwei, LIU Xiao. Analysis of the Incidence and Mortality Trends of Lung Cancer in China from 1990 to 2021 and Prediction for 2035 [J]. Chinese General Practice, 2026, 29(02): 256-263. |
| [15] | MI Lingyu, CHEN Lianxin, GAO Hengbo, WANG Bincheng. Predictive Value of Triglyceride-glucose Index for Prognosis in Patients with Pulmonary Embolism [J]. Chinese General Practice, 2025, 28(35): 4421-4429. |
| Viewed | ||||||
|
Full text |
|
|||||
|
Abstract |
|
|||||
