
Chinese General Practice ›› 2024, Vol. 27 ›› Issue (33): 4168-4175.DOI: 10.12114/j.issn.1007-9572.2024.0172
Special Issue: 儿科最新文章合辑; 肥胖最新文章合辑
• Original Research·Prevention and Control of Obesity in Children and Adolescents • Previous Articles Next Articles
Received:2024-05-27
Revised:2024-07-17
Published:2024-11-20
Online:2024-08-08
Contact:
ZHANG Xiayun
通讯作者:
张夏芸
作者简介:作者贡献:
张瑜、张夏芸提出了主要研究目标及研究命题;张瑜负责研究的构思与设计,撰写论文;张瑜、于硕负责数据的整理及分析;王冰清、冉青青进行论文的修订;张夏芸负责文章的质量控制及审查,对文章整体负责,监督管理。
基金资助:CLC Number:
Add to citation manager EndNote|Ris|BibTeX
URL: https://www.chinagp.net/EN/10.12114/j.issn.1007-9572.2024.0172
| 年龄(岁) | 2018年 | 2020年 | 2021年 | |||
|---|---|---|---|---|---|---|
| 男 | 女 | 男 | 女 | 男 | 女 | |
| 7 | 3 888(52.7) | 3 489(47.3) | 4 323(51.6) | 4 054(48.4) | 4 484(52.0) | 4 147(48.0) |
| 8 | 3 695(52.4) | 3 352(47.6) | 4 779(52.1) | 4 402(47.9) | 4 224(51.4) | 3 990(48.6) |
| 9 | 3 399(52.3) | 3 103(47.7) | 4 090(52.6) | 3 681(47.4) | 4 418(52.1) | 4 068(47.9) |
| 10 | 3 584(53.3) | 3 137(46.7) | 3 710(51.9) | 3 440(48.1) | 3 827(52.5) | 3 469(47.5) |
| 11 | 2 866(53.1) | 2 532(46.9) | 3 282(52.1) | 3 017(47.9) | 3 441(52.2) | 3 145(47.8) |
| 12 | 2 002(50.9) | 1 932(49.1) | 3 336(53.4) | 2 915(46.6) | 3 227(52.7) | 2 899(47.3) |
| 13 | 1 796(53.2) | 1 582(46.8) | 2 970(52.1) | 2 729(47.9) | 3 057(53.1) | 2 697(46.9) |
| 14 | 686(52.3) | 626(47.7) | 533(53.6) | 462(46.4) | 586(54.8) | 484(45.2) |
| 15 | 261(53.5) | 227(46.5) | 1 259(52.1) | 1 159(47.9) | 1 194(50.4) | 1 173(49.6) |
| 16 | 648(49.1) | 672(50.9) | 1 328(50.4) | 1 306(49.6) | 1 336(52.3) | 1 219(47.7) |
| 17 | 417(52.5) | 378(47.5) | 319(54.4) | 267(45.6) | 350(49.8) | 353(50.2) |
| 18 | 44(57.9) | 32(42.1) | 33(57.9) | 24(42.1) | 25(62.5) | 15(37.5) |
| 合计 | 23 286(52.5) | 21 062(47.5) | 29 962(52.2) | 27 456(47.8) | 30 169(52.2) | 27 659(47.8) |
| 年龄(岁) | 2022年 | 2023年 | 合计 | |||
| 男 | 女 | 男 | 女 | 男 | 女 | |
| 7 | 4 136(51.2) | 3 939(48.8) | 4 211(51.9) | 3 896(48.1) | 21 042(51.9) | 19 525(48.1) |
| 8 | 4 538(51.9) | 4 207(48.1) | 4 099(51.1) | 3 926(48.9) | 21 335(51.8) | 19 877(48.2) |
| 9 | 4 214(51.4) | 3 977(48.6) | 4 467(52.1) | 4 107(47.9) | 20 588(52.1) | 18 936(47.9) |
| 10 | 4 430(51.8) | 4 120(48.2) | 4 081(51.0) | 3 918(49.0) | 19 632(52.1) | 18 084(47.9) |
| 11 | 3 635(53.0) | 3 229(47.0) | 4 289(52.4) | 3 893(47.6) | 17 513(52.5) | 15 816(47.5) |
| 12 | 3 193(51.8) | 2 969(48.2) | 3 592(52.6) | 3 233(47.4) | 15 350(52.4) | 13 948(47.6) |
| 13 | 2 916(52.4) | 2 644(47.6) | 3 178(52.1) | 2 920(47.9) | 13 917(52.5) | 12 572(47.5) |
| 14 | 539(54.1) | 457(45.9) | 374(50.9) | 361(49.1) | 2 718(53.2) | 2 390(46.8) |
| 15 | 1 396(50.8) | 1 352(49.2) | 1 709(53.8) | 468(46.2) | 5 819(52.0) | 5 379(48.0) |
| 16 | 1 306(51.1) | 1 252(49.2) | 1 815(52.5) | 1 643(47.5) | 6 433(51.4) | 6 092(48.6) |
| 17 | 367(56.8) | 279(43.2) | 390(55.7) | 310(47.6) | 1 843(53.7) | 1 587(46.3) |
| 18 | 20(54.1) | 17(45.9) | 22(52.4) | 20(47.6) | 144(57.1) | 108(42.9) |
| 合计 | 30 690(51.9) | 28 442(48.1) | 32 227(52.0) | 29 695(48.0) | 146 334(52.1) | 134 314(47.9) |
Table 1 Basic information of children and adolescents aged 7 to 18 from 2018 to 2023 in Putuo District by gender and age group
| 年龄(岁) | 2018年 | 2020年 | 2021年 | |||
|---|---|---|---|---|---|---|
| 男 | 女 | 男 | 女 | 男 | 女 | |
| 7 | 3 888(52.7) | 3 489(47.3) | 4 323(51.6) | 4 054(48.4) | 4 484(52.0) | 4 147(48.0) |
| 8 | 3 695(52.4) | 3 352(47.6) | 4 779(52.1) | 4 402(47.9) | 4 224(51.4) | 3 990(48.6) |
| 9 | 3 399(52.3) | 3 103(47.7) | 4 090(52.6) | 3 681(47.4) | 4 418(52.1) | 4 068(47.9) |
| 10 | 3 584(53.3) | 3 137(46.7) | 3 710(51.9) | 3 440(48.1) | 3 827(52.5) | 3 469(47.5) |
| 11 | 2 866(53.1) | 2 532(46.9) | 3 282(52.1) | 3 017(47.9) | 3 441(52.2) | 3 145(47.8) |
| 12 | 2 002(50.9) | 1 932(49.1) | 3 336(53.4) | 2 915(46.6) | 3 227(52.7) | 2 899(47.3) |
| 13 | 1 796(53.2) | 1 582(46.8) | 2 970(52.1) | 2 729(47.9) | 3 057(53.1) | 2 697(46.9) |
| 14 | 686(52.3) | 626(47.7) | 533(53.6) | 462(46.4) | 586(54.8) | 484(45.2) |
| 15 | 261(53.5) | 227(46.5) | 1 259(52.1) | 1 159(47.9) | 1 194(50.4) | 1 173(49.6) |
| 16 | 648(49.1) | 672(50.9) | 1 328(50.4) | 1 306(49.6) | 1 336(52.3) | 1 219(47.7) |
| 17 | 417(52.5) | 378(47.5) | 319(54.4) | 267(45.6) | 350(49.8) | 353(50.2) |
| 18 | 44(57.9) | 32(42.1) | 33(57.9) | 24(42.1) | 25(62.5) | 15(37.5) |
| 合计 | 23 286(52.5) | 21 062(47.5) | 29 962(52.2) | 27 456(47.8) | 30 169(52.2) | 27 659(47.8) |
| 年龄(岁) | 2022年 | 2023年 | 合计 | |||
| 男 | 女 | 男 | 女 | 男 | 女 | |
| 7 | 4 136(51.2) | 3 939(48.8) | 4 211(51.9) | 3 896(48.1) | 21 042(51.9) | 19 525(48.1) |
| 8 | 4 538(51.9) | 4 207(48.1) | 4 099(51.1) | 3 926(48.9) | 21 335(51.8) | 19 877(48.2) |
| 9 | 4 214(51.4) | 3 977(48.6) | 4 467(52.1) | 4 107(47.9) | 20 588(52.1) | 18 936(47.9) |
| 10 | 4 430(51.8) | 4 120(48.2) | 4 081(51.0) | 3 918(49.0) | 19 632(52.1) | 18 084(47.9) |
| 11 | 3 635(53.0) | 3 229(47.0) | 4 289(52.4) | 3 893(47.6) | 17 513(52.5) | 15 816(47.5) |
| 12 | 3 193(51.8) | 2 969(48.2) | 3 592(52.6) | 3 233(47.4) | 15 350(52.4) | 13 948(47.6) |
| 13 | 2 916(52.4) | 2 644(47.6) | 3 178(52.1) | 2 920(47.9) | 13 917(52.5) | 12 572(47.5) |
| 14 | 539(54.1) | 457(45.9) | 374(50.9) | 361(49.1) | 2 718(53.2) | 2 390(46.8) |
| 15 | 1 396(50.8) | 1 352(49.2) | 1 709(53.8) | 468(46.2) | 5 819(52.0) | 5 379(48.0) |
| 16 | 1 306(51.1) | 1 252(49.2) | 1 815(52.5) | 1 643(47.5) | 6 433(51.4) | 6 092(48.6) |
| 17 | 367(56.8) | 279(43.2) | 390(55.7) | 310(47.6) | 1 843(53.7) | 1 587(46.3) |
| 18 | 20(54.1) | 17(45.9) | 22(52.4) | 20(47.6) | 144(57.1) | 108(42.9) |
| 合计 | 30 690(51.9) | 28 442(48.1) | 32 227(52.0) | 29 695(48.0) | 146 334(52.1) | 134 314(47.9) |
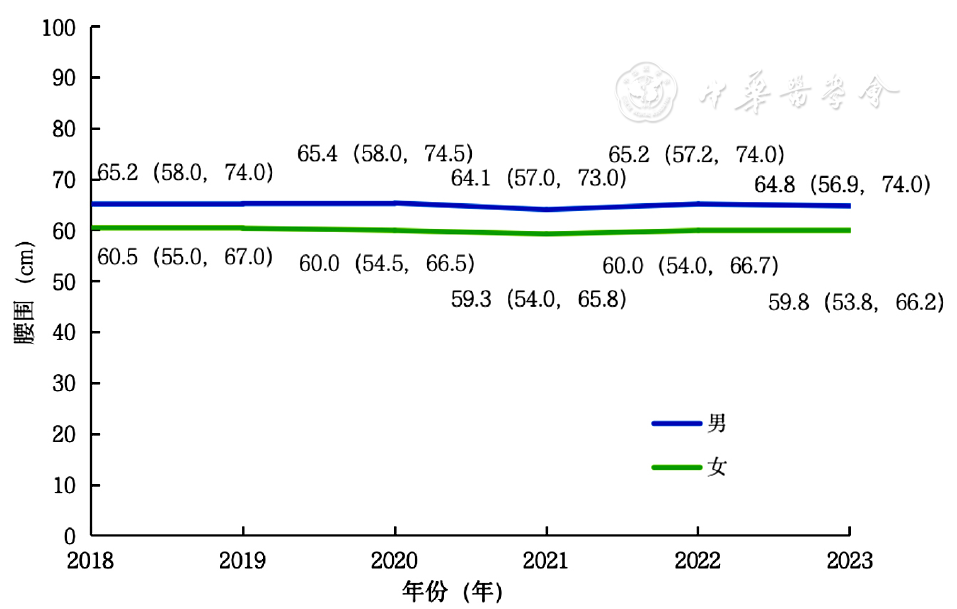
Figure 1 Waist circumference of children and adolescents in Putuo District from 2018 to 2023
| 年龄(岁) | 2018年 | 2020年 | 2021年 | 2022年 | 2023年 | H值 | P值 |
|---|---|---|---|---|---|---|---|
| 7 | 57.3(53.0,63.1) | 56.1(52.4,62.0) | 55.0(51.2,60.0) | 55.4(51.3,61.5) | 54.0(51.0,58.8) | 524.326 | <0.001 |
| 8 | 60.0(55.2,67.0) | 59.0(54.0,66.0) | 58.0(53.5,64.6) | 58.2(53.1,65.5) | 57.0(53.0,64.2) | 250.115 | <0.001 |
| 9 | 63.0(57.8,70.7) | 63.2(56.8,71.0) | 61.5(56.0,69.1) | 62.4(56.0,70.0) | 60.6(55.1,69.0) | 153.562 | <0.001 |
| 10 | 67.8(60.0,76.0) | 66.2(59.2,74.0) | 65.4(58.3,73.2) | 65.3(58.0,73.0) | 65.0(58.1,73.5) | 131.018 | <0.001 |
| 11 | 69.0(62.0,78.0) | 69.0(61.5,77.0) | 67.3(60.3,75.3) | 68.3(61.0,76.5) | 67.5(60.2,76.8) | 75.038 | <0.001 |
| 12 | 71.0(64.0,80.0) | 70.9(63.2,79.8) | 69.4(62.4,78.5) | 70.0(63.2,78.2) | 69.0(62.0,78.0) | 51.927 | <0.001 |
| 13 | 71.1(65.0,81.1) | 72.0(65.0,81.2) | 70.1(63.5,79.2) | 72.4(65.0,82.0) | 70.5(64.0,80.0) | 54.364 | <0.001 |
| 14 | 71.3(65.7,81.3) | 73.5(66.0,83.0) | 71.0(64.0,79.7) | 71.4(65.0,80.3) | 72.8(65.1,83.4) | 12.688 | 0.013 |
| 15 | 75.0(68.9,82.2) | 74.0(67.8,84.6) | 73.7(67.0,83.3) | 76.0(68.0,85.0) | 74.8(67.5,84.2) | 10.836 | 0.028 |
| 16 | 75.4(68.2,84.5) | 75.0(68.5,84.8) | 74.0(68.0,84.0) | 77.0(69.2,86.0) | 75.0(68.3,85.2) | 24.531 | <0.001 |
| 17 | 76.6(70.6,85.0) | 77.9(69.5,87.0) | 75.0(67.5,83.0) | 77.1(70.0,88.0) | 77.3(69.5,88.1) | 13.631 | 0.009 |
| 18 | 77.7(69.2,87.1) | 81.0(70.6,89.2) | 82.0(71.5,89.2) | 82.5(70.0,87.5) | 83.8(75.7,95.4) | 5.625 | 0.229 |
| 合计 | 65.2(58.0,74.0) | 65.4(58.0,74.5) | 64.1(57.0,73.0) | 65.2(57.2,74.0) | 64.8(56.9,74.0) | 209.785 | <0.001 |
Table 2 Waist circumference of male students aged 7 to 18 in Putuo District from 2018 to 2023
| 年龄(岁) | 2018年 | 2020年 | 2021年 | 2022年 | 2023年 | H值 | P值 |
|---|---|---|---|---|---|---|---|
| 7 | 57.3(53.0,63.1) | 56.1(52.4,62.0) | 55.0(51.2,60.0) | 55.4(51.3,61.5) | 54.0(51.0,58.8) | 524.326 | <0.001 |
| 8 | 60.0(55.2,67.0) | 59.0(54.0,66.0) | 58.0(53.5,64.6) | 58.2(53.1,65.5) | 57.0(53.0,64.2) | 250.115 | <0.001 |
| 9 | 63.0(57.8,70.7) | 63.2(56.8,71.0) | 61.5(56.0,69.1) | 62.4(56.0,70.0) | 60.6(55.1,69.0) | 153.562 | <0.001 |
| 10 | 67.8(60.0,76.0) | 66.2(59.2,74.0) | 65.4(58.3,73.2) | 65.3(58.0,73.0) | 65.0(58.1,73.5) | 131.018 | <0.001 |
| 11 | 69.0(62.0,78.0) | 69.0(61.5,77.0) | 67.3(60.3,75.3) | 68.3(61.0,76.5) | 67.5(60.2,76.8) | 75.038 | <0.001 |
| 12 | 71.0(64.0,80.0) | 70.9(63.2,79.8) | 69.4(62.4,78.5) | 70.0(63.2,78.2) | 69.0(62.0,78.0) | 51.927 | <0.001 |
| 13 | 71.1(65.0,81.1) | 72.0(65.0,81.2) | 70.1(63.5,79.2) | 72.4(65.0,82.0) | 70.5(64.0,80.0) | 54.364 | <0.001 |
| 14 | 71.3(65.7,81.3) | 73.5(66.0,83.0) | 71.0(64.0,79.7) | 71.4(65.0,80.3) | 72.8(65.1,83.4) | 12.688 | 0.013 |
| 15 | 75.0(68.9,82.2) | 74.0(67.8,84.6) | 73.7(67.0,83.3) | 76.0(68.0,85.0) | 74.8(67.5,84.2) | 10.836 | 0.028 |
| 16 | 75.4(68.2,84.5) | 75.0(68.5,84.8) | 74.0(68.0,84.0) | 77.0(69.2,86.0) | 75.0(68.3,85.2) | 24.531 | <0.001 |
| 17 | 76.6(70.6,85.0) | 77.9(69.5,87.0) | 75.0(67.5,83.0) | 77.1(70.0,88.0) | 77.3(69.5,88.1) | 13.631 | 0.009 |
| 18 | 77.7(69.2,87.1) | 81.0(70.6,89.2) | 82.0(71.5,89.2) | 82.5(70.0,87.5) | 83.8(75.7,95.4) | 5.625 | 0.229 |
| 合计 | 65.2(58.0,74.0) | 65.4(58.0,74.5) | 64.1(57.0,73.0) | 65.2(57.2,74.0) | 64.8(56.9,74.0) | 209.785 | <0.001 |
| 年龄(岁) | 2018年 | 2020年 | 2021年 | 2022年 | 2023年 | H值 | P值 |
|---|---|---|---|---|---|---|---|
| 7 | 54.8(51.0,59.0) | 53.0(49.8,57.5) | 52.0(49.1,56.2) | 52.3(49.0,57.2) | 51.4(48.8,55.0) | 587.505 | <0.001 |
| 8 | 56.0(53.0,61.5) | 55.0(51.1,60.0) | 54.3(50.8,59.0) | 54.6(50.7,60.0) | 53.3(52.2,58.0) | 378.600 | <0.001 |
| 9 | 58.6(54.5,64.0) | 57.6(53.5,63.4) | 56.6(52.5,62.2) | 56.7(52.5,63.0) | 56.0(52.2,61.5) | 251.393 | <0.001 |
| 10 | 61.0(57.0,67.1) | 60.1(55.8,66.2) | 59.9(55.3,65.3) | 59.3(54.5,65.5) | 59.1(55.0,65.1) | 152.432 | <0.001 |
| 11 | 63.4(59.0,70.4) | 62.0(58.0,68.0) | 61.7(57.2,68.0) | 62.0(57.2,68.2) | 61.5(57.0,67.8) | 110.575 | <0.001 |
| 12 | 65.5(60.6,71.4) | 64.5(59.9,70.4) | 63.5(59.0,69.5) | 64.3(59.5,70.4) | 63.3(59.0,69.0) | 96.686 | <0.001 |
| 13 | 66.9(62.0,72.5) | 65.0(60.8,71.0) | 64.1(60.0,70.0) | 65.0(60.7,71.0) | 65.3(61.2,71.0) | 78.552 | <0.001 |
| 14 | 66.5(62.3,73.0) | 65.0(61.0,70.5) | 65.5(60.8,72.0) | 65.8(61.7,71.1) | 65.1(61.0,71.8) | 14.132 | 0.007 |
| 15 | 70.0(64.1,75.5) | 66.0(62.0,71.0) | 66.2(62.0,71.2) | 67.4(63.0,73.5) | 66.6(62.5,72.4) | 51.157 | <0.001 |
| 16 | 68.2(63.8,74.3) | 67.1(63.0,73.0) | 65.8(62.0,70.5) | 67.7(63.0,73.0) | 68.0(63.3,73.8) | 81.147 | <0.001 |
| 17 | 69.0(64.4,74.2) | 67.1(63.0,73.0) | 66.0(61.7,71.8) | 67.8(63.2,73.0) | 68.5(64.0,74.5) | 29.016 | <0.001 |
| 18 | 73.9(68.0,81.2) | 62.8(60.2,69.2) | 66.4(62.0,74.3) | 68.0(61.2,81.0) | 67.8(64.1,74.6) | 18.769 | 0.001 |
| 合计 | 60.5(55.0,67.0) | 60.0(54.5,66.5) | 59.3(54.0,65.8) | 60.0(54.0,66.7) | 59.8(53.8,66.2) | 373.076 | <0.001 |
Table 3 Waist circumference of female students aged 7 to 18 in Putuo District from 2018 to 2023
| 年龄(岁) | 2018年 | 2020年 | 2021年 | 2022年 | 2023年 | H值 | P值 |
|---|---|---|---|---|---|---|---|
| 7 | 54.8(51.0,59.0) | 53.0(49.8,57.5) | 52.0(49.1,56.2) | 52.3(49.0,57.2) | 51.4(48.8,55.0) | 587.505 | <0.001 |
| 8 | 56.0(53.0,61.5) | 55.0(51.1,60.0) | 54.3(50.8,59.0) | 54.6(50.7,60.0) | 53.3(52.2,58.0) | 378.600 | <0.001 |
| 9 | 58.6(54.5,64.0) | 57.6(53.5,63.4) | 56.6(52.5,62.2) | 56.7(52.5,63.0) | 56.0(52.2,61.5) | 251.393 | <0.001 |
| 10 | 61.0(57.0,67.1) | 60.1(55.8,66.2) | 59.9(55.3,65.3) | 59.3(54.5,65.5) | 59.1(55.0,65.1) | 152.432 | <0.001 |
| 11 | 63.4(59.0,70.4) | 62.0(58.0,68.0) | 61.7(57.2,68.0) | 62.0(57.2,68.2) | 61.5(57.0,67.8) | 110.575 | <0.001 |
| 12 | 65.5(60.6,71.4) | 64.5(59.9,70.4) | 63.5(59.0,69.5) | 64.3(59.5,70.4) | 63.3(59.0,69.0) | 96.686 | <0.001 |
| 13 | 66.9(62.0,72.5) | 65.0(60.8,71.0) | 64.1(60.0,70.0) | 65.0(60.7,71.0) | 65.3(61.2,71.0) | 78.552 | <0.001 |
| 14 | 66.5(62.3,73.0) | 65.0(61.0,70.5) | 65.5(60.8,72.0) | 65.8(61.7,71.1) | 65.1(61.0,71.8) | 14.132 | 0.007 |
| 15 | 70.0(64.1,75.5) | 66.0(62.0,71.0) | 66.2(62.0,71.2) | 67.4(63.0,73.5) | 66.6(62.5,72.4) | 51.157 | <0.001 |
| 16 | 68.2(63.8,74.3) | 67.1(63.0,73.0) | 65.8(62.0,70.5) | 67.7(63.0,73.0) | 68.0(63.3,73.8) | 81.147 | <0.001 |
| 17 | 69.0(64.4,74.2) | 67.1(63.0,73.0) | 66.0(61.7,71.8) | 67.8(63.2,73.0) | 68.5(64.0,74.5) | 29.016 | <0.001 |
| 18 | 73.9(68.0,81.2) | 62.8(60.2,69.2) | 66.4(62.0,74.3) | 68.0(61.2,81.0) | 67.8(64.1,74.6) | 18.769 | 0.001 |
| 合计 | 60.5(55.0,67.0) | 60.0(54.5,66.5) | 59.3(54.0,65.8) | 60.0(54.0,66.7) | 59.8(53.8,66.2) | 373.076 | <0.001 |
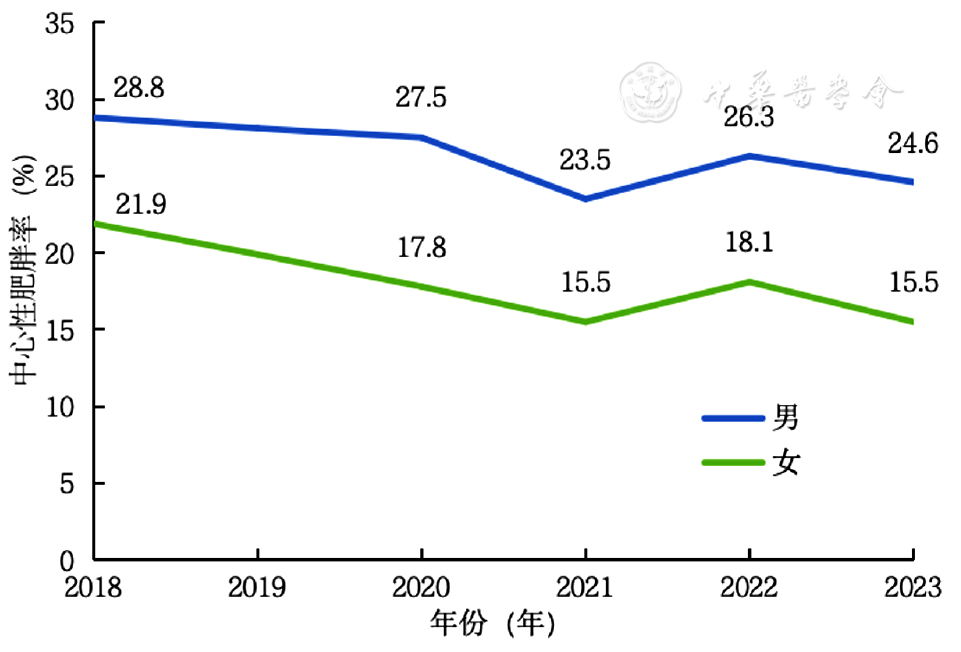
Figure 2 Prevalence of central obesity of children and adolescents in Putuo District from 2018 to 2023
| 年龄(岁) | 人次 | 总中心性肥胖率 | 中心性肥胖率 | 不同年份比较 | 趋势分析 | ||||||
|---|---|---|---|---|---|---|---|---|---|---|---|
| 2018年 | 2020年 | 2021年 | 2022年 | 2023年 | χ2值 | P值 | Z趋势值 | P趋势值 | |||
| 7 | 21 042 | 3 896(18.5) | 951(24.5) | 862(19.9) | 695(15.5) | 813(19.7) | 575(13.7) | 193.424 | <0.001 | -11.286 | <0.001 |
| 8 | 21 335 | 4 681(21.9) | 968(26.2) | 1 103(23.1) | 809(19.2) | 996(21.9) | 805(19.6) | 74.572 | <0.001 | -6.695 | <0.001 |
| 9 | 20 588 | 5 292(25.7) | 960(28.2) | 1 195(29.2) | 1 033(23.4) | 1 074(25.5) | 1 030(23.1) | 66.878 | <0.001 | -6.468 | <0.001 |
| 10 | 19 632 | 5 243(26.7) | 1 118(31.2) | 1 002(27.0) | 966(25.2) | 1 087(24.5) | 1 070(26.2) | 52.380 | <0.001 | -5.389 | <0.001 |
| 11 | 17 513 | 4 900(28.0) | 918(32.0) | 965(29.4) | 826(24.0) | 1 008(27.7) | 1 183(27.6) | 54.070 | <0.001 | -3.838 | <0.001 |
| 12 | 15 350 | 4 394(28.6) | 634(31.7) | 1 025(30.7) | 893(27.7) | 890(27.9) | 952(26.5) | 25.508 | <0.001 | -4.844 | <0.001 |
| 13 | 13 917 | 4 102(29.5) | 541(30.1) | 921(31.0) | 829(27.1) | 944(32.4) | 867(27.3) | 31.038 | <0.001 | -1.708 | 0.088 |
| 14 | 2 718 | 779(28.7) | 192(28.0) | 166(31.1) | 147(25.1) | 156(28.9) | 118(31.6) | 6.972 | 0.137 | 0.588 | 0.556 |
| 15 | 5 819 | 1 939(33.3) | 78(29.9) | 424(33.7) | 368(30.8) | 485(34.7) | 584(34.2) | 6.644 | 0.156 | 1.398 | 0.162 |
| 16 | 6 433 | 2 135(33.2) | 209(32.3) | 438(33.0) | 408(30.5) | 485(37.1) | 595(32.8) | 13.826 | 0.008 | 1.017 | 0.309 |
| 17 | 1 843 | 605(32.8) | 129(30.9) | 112(35.1) | 95(27.1) | 125(34.1) | 144(36.9) | 9.779 | 0.044 | 1.531 | 0.126 |
| 18 | 144 | 63(43.8) | 16(36.4) | 14(42.4) | 11(44.0) | 10(50.0) | 12(54.5) | 2.359 | 0.670 | 1.520 | 0.128 |
| Z趋势值 | 35.167 | 7.039 | 14.978 | 16.800 | 18.329 | 22.211 | |||||
| P趋势值 | <0.001 | <0.001 | <0.001 | <0.001 | <0.001 | <0.001 | |||||
Table 4 Prevalence of central obesity and the trend of it in male students aged 7 to 18 in Putuo District from 2018 to 2023
| 年龄(岁) | 人次 | 总中心性肥胖率 | 中心性肥胖率 | 不同年份比较 | 趋势分析 | ||||||
|---|---|---|---|---|---|---|---|---|---|---|---|
| 2018年 | 2020年 | 2021年 | 2022年 | 2023年 | χ2值 | P值 | Z趋势值 | P趋势值 | |||
| 7 | 21 042 | 3 896(18.5) | 951(24.5) | 862(19.9) | 695(15.5) | 813(19.7) | 575(13.7) | 193.424 | <0.001 | -11.286 | <0.001 |
| 8 | 21 335 | 4 681(21.9) | 968(26.2) | 1 103(23.1) | 809(19.2) | 996(21.9) | 805(19.6) | 74.572 | <0.001 | -6.695 | <0.001 |
| 9 | 20 588 | 5 292(25.7) | 960(28.2) | 1 195(29.2) | 1 033(23.4) | 1 074(25.5) | 1 030(23.1) | 66.878 | <0.001 | -6.468 | <0.001 |
| 10 | 19 632 | 5 243(26.7) | 1 118(31.2) | 1 002(27.0) | 966(25.2) | 1 087(24.5) | 1 070(26.2) | 52.380 | <0.001 | -5.389 | <0.001 |
| 11 | 17 513 | 4 900(28.0) | 918(32.0) | 965(29.4) | 826(24.0) | 1 008(27.7) | 1 183(27.6) | 54.070 | <0.001 | -3.838 | <0.001 |
| 12 | 15 350 | 4 394(28.6) | 634(31.7) | 1 025(30.7) | 893(27.7) | 890(27.9) | 952(26.5) | 25.508 | <0.001 | -4.844 | <0.001 |
| 13 | 13 917 | 4 102(29.5) | 541(30.1) | 921(31.0) | 829(27.1) | 944(32.4) | 867(27.3) | 31.038 | <0.001 | -1.708 | 0.088 |
| 14 | 2 718 | 779(28.7) | 192(28.0) | 166(31.1) | 147(25.1) | 156(28.9) | 118(31.6) | 6.972 | 0.137 | 0.588 | 0.556 |
| 15 | 5 819 | 1 939(33.3) | 78(29.9) | 424(33.7) | 368(30.8) | 485(34.7) | 584(34.2) | 6.644 | 0.156 | 1.398 | 0.162 |
| 16 | 6 433 | 2 135(33.2) | 209(32.3) | 438(33.0) | 408(30.5) | 485(37.1) | 595(32.8) | 13.826 | 0.008 | 1.017 | 0.309 |
| 17 | 1 843 | 605(32.8) | 129(30.9) | 112(35.1) | 95(27.1) | 125(34.1) | 144(36.9) | 9.779 | 0.044 | 1.531 | 0.126 |
| 18 | 144 | 63(43.8) | 16(36.4) | 14(42.4) | 11(44.0) | 10(50.0) | 12(54.5) | 2.359 | 0.670 | 1.520 | 0.128 |
| Z趋势值 | 35.167 | 7.039 | 14.978 | 16.800 | 18.329 | 22.211 | |||||
| P趋势值 | <0.001 | <0.001 | <0.001 | <0.001 | <0.001 | <0.001 | |||||
| 年龄(岁) | 人次 | 总中心性肥胖率 | 中心性肥胖率 | 不同年份比较 | 趋势分析 | ||||||
|---|---|---|---|---|---|---|---|---|---|---|---|
| 2018年 | 2020年 | 2021年 | 2022年 | 2023年 | χ2值 | P值 | Z趋势值 | P趋势值 | |||
| 7 | 19 525 | 2 765(14.2) | 701(25.4) | 603(14.9) | 479(11.6) | 617(15.7) | 365(9.4) | 206.829 | <0.001 | -11.21 | <0.001 |
| 8 | 19 877 | 3 313(16.7) | 711(21.2) | 779(17.7) | 586(14.7) | 740(17.6) | 497(12.7) | 112.441 | <0.001 | -8.652 | <0.001 |
| 9 | 18 936 | 3 424(18.1) | 627(20.2) | 725(19.7) | 693(17.0) | 742(18.7) | 637(15.5) | 38.162 | <0.001 | -5183 | <0.001 |
| 10 | 18 084 | 3 596(19.9) | 756(24.1) | 718(20.9) | 641(18.5) | 786(19.1) | 695(17.7) | 54.406 | <0.001 | -6.646 | <0.001 |
| 11 | 15 816 | 3 068(19.4) | 634(25.0) | 554(18.4) | 552(17.6) | 616(19.1) | 712(18.3) | 63.740 | <0.001 | -5.011 | <0.001 |
| 12 | 13 948 | 2 495(17.9) | 419(21.7) | 537(18.4) | 472(16.3) | 564(19.0) | 503(15.6) | 39.076 | <0.001 | -4.529 | <0.001 |
| 13 | 12 572 | 2 198(17.5) | 338(21.4) | 481(17.6) | 419(15.5) | 472(17.9) | 488(16.7) | 25.107 | <0.001 | -2.821 | 0.005 |
| 14 | 2 390 | 422(17.7) | 119(19.0) | 68(14.7) | 89(18.4) | 81(17.7) | 65(18.0) | 3.741 | 0.442 | -0.020 | 0.984 |
| 15 | 5 379 | 886(16.5) | 58(25.6) | 149(12.9) | 163(13.9) | 267(19.7) | 249(17.0) | 41.077 | <0.001 | 1.795 | 0.073 |
| 16 | 6 092 | 1 071(17.6) | 149(22.2) | 238(18.2) | 130(10.7) | 228(18.2) | 326(19.8) | 56.534 | <0.001 | 0.300 | 0.765 |
| 17 | 1 587 | 275(17.3) | 78(20.6) | 40(15.0) | 50(14.2) | 44(15.8) | 63(20.3) | 8.791 | 0.067 | -0.208 | 0.835 |
| 18 | 108 | 27(25.0) | 14(43.8) | 1(4.2) | 3(20.0) | 5(29.4) | 4(20.0) | — | 0.011 | -1.230 | 0.219 |
| Z趋势值 | 6.533 | 2.238 | -0.341 | 1.205 | 2.672 | 11.177 | |||||
| P趋势值 | <0.001 | 0.025 | 0.733 | 0.228 | 0.008 | <0.001 | |||||
Table 5 Prevalence of central obesity and the trend of it in female students aged 7 to 18 in Putuo District from 2018 to 2023
| 年龄(岁) | 人次 | 总中心性肥胖率 | 中心性肥胖率 | 不同年份比较 | 趋势分析 | ||||||
|---|---|---|---|---|---|---|---|---|---|---|---|
| 2018年 | 2020年 | 2021年 | 2022年 | 2023年 | χ2值 | P值 | Z趋势值 | P趋势值 | |||
| 7 | 19 525 | 2 765(14.2) | 701(25.4) | 603(14.9) | 479(11.6) | 617(15.7) | 365(9.4) | 206.829 | <0.001 | -11.21 | <0.001 |
| 8 | 19 877 | 3 313(16.7) | 711(21.2) | 779(17.7) | 586(14.7) | 740(17.6) | 497(12.7) | 112.441 | <0.001 | -8.652 | <0.001 |
| 9 | 18 936 | 3 424(18.1) | 627(20.2) | 725(19.7) | 693(17.0) | 742(18.7) | 637(15.5) | 38.162 | <0.001 | -5183 | <0.001 |
| 10 | 18 084 | 3 596(19.9) | 756(24.1) | 718(20.9) | 641(18.5) | 786(19.1) | 695(17.7) | 54.406 | <0.001 | -6.646 | <0.001 |
| 11 | 15 816 | 3 068(19.4) | 634(25.0) | 554(18.4) | 552(17.6) | 616(19.1) | 712(18.3) | 63.740 | <0.001 | -5.011 | <0.001 |
| 12 | 13 948 | 2 495(17.9) | 419(21.7) | 537(18.4) | 472(16.3) | 564(19.0) | 503(15.6) | 39.076 | <0.001 | -4.529 | <0.001 |
| 13 | 12 572 | 2 198(17.5) | 338(21.4) | 481(17.6) | 419(15.5) | 472(17.9) | 488(16.7) | 25.107 | <0.001 | -2.821 | 0.005 |
| 14 | 2 390 | 422(17.7) | 119(19.0) | 68(14.7) | 89(18.4) | 81(17.7) | 65(18.0) | 3.741 | 0.442 | -0.020 | 0.984 |
| 15 | 5 379 | 886(16.5) | 58(25.6) | 149(12.9) | 163(13.9) | 267(19.7) | 249(17.0) | 41.077 | <0.001 | 1.795 | 0.073 |
| 16 | 6 092 | 1 071(17.6) | 149(22.2) | 238(18.2) | 130(10.7) | 228(18.2) | 326(19.8) | 56.534 | <0.001 | 0.300 | 0.765 |
| 17 | 1 587 | 275(17.3) | 78(20.6) | 40(15.0) | 50(14.2) | 44(15.8) | 63(20.3) | 8.791 | 0.067 | -0.208 | 0.835 |
| 18 | 108 | 27(25.0) | 14(43.8) | 1(4.2) | 3(20.0) | 5(29.4) | 4(20.0) | — | 0.011 | -1.230 | 0.219 |
| Z趋势值 | 6.533 | 2.238 | -0.341 | 1.205 | 2.672 | 11.177 | |||||
| P趋势值 | <0.001 | 0.025 | 0.733 | 0.228 | 0.008 | <0.001 | |||||
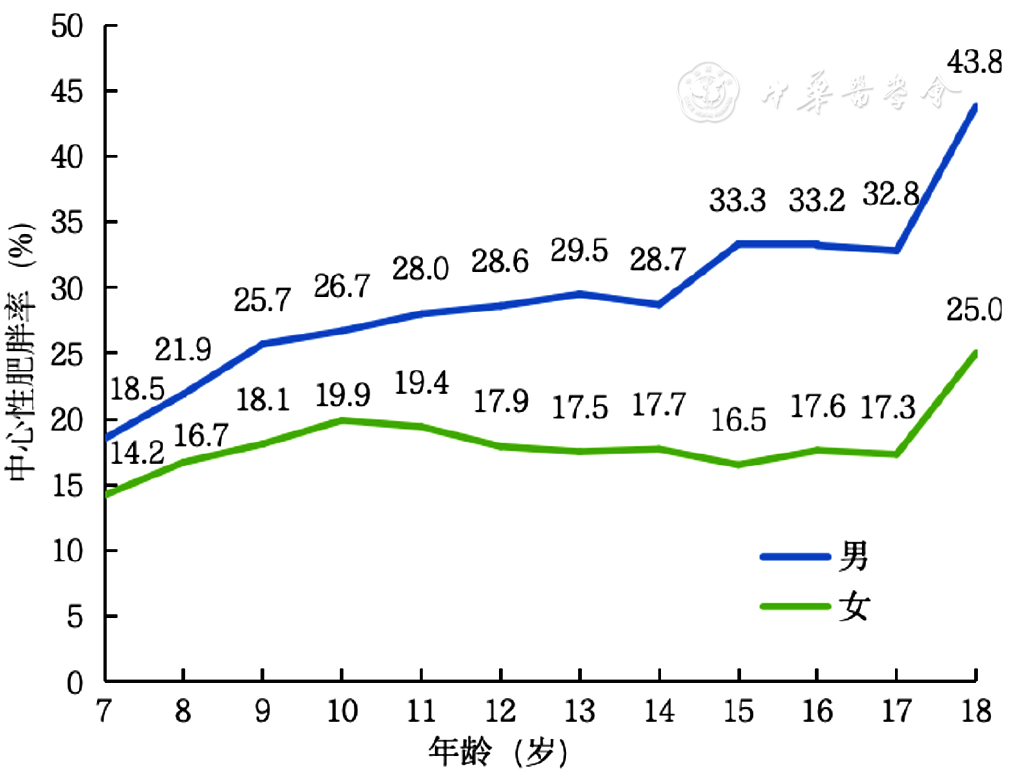
Figure 3 Prevalence of central obesity of children and adolescents aged 7 to 18 in Putuo District
| 年龄(岁) | 腰围[M(P25,P75),cm] | 中心性肥胖率[人次(%)] | ||||||
|---|---|---|---|---|---|---|---|---|
| 男 | 女 | U值 | P值 | 男 | 女 | χ2值 | P值 | |
| 7 | 55.5(51.8,61.0) | 52.6(49.5,57.0) | 149 380 884.500 | <0.001 | 3 896(18.5) | 2 765(14.2) | 139.899 | <0.001 |
| 8 | 58.4(53.8,65.5) | 54.7(51.0,60.0) | 149 011 986.000 | <0.001 | 4 681(21.9) | 3 313(16.7) | 182.995 | <0.001 |
| 9 | 62.0(56.0,70.0) | 57.0(53.0,63.0) | 131 440 332.000 | <0.001 | 5 292(25.7) | 3 424(18.1) | 333.395 | <0.001 |
| 10 | 66.0(59.0,74.0) | 60.0(55.3,66.0) | 118 839 826.000 | <0.001 | 5 243(26.7) | 3 596(19.9) | 244.106 | <0.001 |
| 11 | 68.1(61.0,77.0) | 62.0(57.5,68.3) | 93 543 608.500 | <0.001 | 4 900(28.0) | 3 068(19.4) | 336.398 | <0.001 |
| 12 | 70.0(63.0,79.0) | 64.0(59.5,70.0) | 72 052 644.000 | <0.001 | 4 394(28.6) | 2 495(17.9) | 468.478 | <0.001 |
| 13 | 71.0(64.5,80.6) | 65.0(61.0,71.0) | 56 536 350.000 | <0.001 | 4 102(29.5) | 2 198(17.5) | 523.966 | <0.001 |
| 14 | 71.7(65.0,81.5) | 65.8(61.2,71.5) | 2 093 833.500 | <0.001 | 779(28.7) | 422(17.7) | 85.626 | <0.001 |
| 15 | 74.8(67.7,84.2) | 66.8(62.3,72.2) | 8 524 691.500 | <0.001 | 1 939(33.3) | 886(16.5) | 420.738 | <0.001 |
| 16 | 75.2(68.5,85.0) | 67.1(63.0,73.0) | 10 396 635.500 | <0.001 | 2 135(33.2) | 1 071(17.6) | 400.223 | <0.001 |
| 17 | 77.0(69.5,86.5) | 67.8(63.2,73.3) | 718 897.500 | <0.001 | 605(32.8) | 275(17.3) | 107.389 | <0.001 |
| 18 | 81.0(70.6,89.9) | 68.6(62.5,76.7) | 3 807.000 | <0.001 | 63(43.8) | 27(25.0) | 9.450 | 0.002 |
| 合计 | 65.5(57.3,74.0) | 60.0(54.1,66.4) | 7 128 257 114.500 | <0.001 | 38 029(26.0) | 23 540(17.5) | 2 928.075 | <0.001 |
Table 6 Comparison of waist circumference and the prevalence of central obesity among children and adolescents aged 7 to 18 by gender
| 年龄(岁) | 腰围[M(P25,P75),cm] | 中心性肥胖率[人次(%)] | ||||||
|---|---|---|---|---|---|---|---|---|
| 男 | 女 | U值 | P值 | 男 | 女 | χ2值 | P值 | |
| 7 | 55.5(51.8,61.0) | 52.6(49.5,57.0) | 149 380 884.500 | <0.001 | 3 896(18.5) | 2 765(14.2) | 139.899 | <0.001 |
| 8 | 58.4(53.8,65.5) | 54.7(51.0,60.0) | 149 011 986.000 | <0.001 | 4 681(21.9) | 3 313(16.7) | 182.995 | <0.001 |
| 9 | 62.0(56.0,70.0) | 57.0(53.0,63.0) | 131 440 332.000 | <0.001 | 5 292(25.7) | 3 424(18.1) | 333.395 | <0.001 |
| 10 | 66.0(59.0,74.0) | 60.0(55.3,66.0) | 118 839 826.000 | <0.001 | 5 243(26.7) | 3 596(19.9) | 244.106 | <0.001 |
| 11 | 68.1(61.0,77.0) | 62.0(57.5,68.3) | 93 543 608.500 | <0.001 | 4 900(28.0) | 3 068(19.4) | 336.398 | <0.001 |
| 12 | 70.0(63.0,79.0) | 64.0(59.5,70.0) | 72 052 644.000 | <0.001 | 4 394(28.6) | 2 495(17.9) | 468.478 | <0.001 |
| 13 | 71.0(64.5,80.6) | 65.0(61.0,71.0) | 56 536 350.000 | <0.001 | 4 102(29.5) | 2 198(17.5) | 523.966 | <0.001 |
| 14 | 71.7(65.0,81.5) | 65.8(61.2,71.5) | 2 093 833.500 | <0.001 | 779(28.7) | 422(17.7) | 85.626 | <0.001 |
| 15 | 74.8(67.7,84.2) | 66.8(62.3,72.2) | 8 524 691.500 | <0.001 | 1 939(33.3) | 886(16.5) | 420.738 | <0.001 |
| 16 | 75.2(68.5,85.0) | 67.1(63.0,73.0) | 10 396 635.500 | <0.001 | 2 135(33.2) | 1 071(17.6) | 400.223 | <0.001 |
| 17 | 77.0(69.5,86.5) | 67.8(63.2,73.3) | 718 897.500 | <0.001 | 605(32.8) | 275(17.3) | 107.389 | <0.001 |
| 18 | 81.0(70.6,89.9) | 68.6(62.5,76.7) | 3 807.000 | <0.001 | 63(43.8) | 27(25.0) | 9.450 | 0.002 |
| 合计 | 65.5(57.3,74.0) | 60.0(54.1,66.4) | 7 128 257 114.500 | <0.001 | 38 029(26.0) | 23 540(17.5) | 2 928.075 | <0.001 |
| [1] |
|
| [2] | |
| [3] |
叶新华,陈虹,康曦光,等. 兰州市儿童肥胖与睡眠障碍的相关性分析[J]. 中国当代儿科杂志,2019,21(10):987-991.
|
| [4] |
|
| [5] | |
| [6] |
|
| [7] |
李斌,郭均涛,王宏,等. 体质量指数、腰臀比、体脂百分率评价青少年肥胖的研究[J]. 重庆医学,2014,43(34):4637-4639,4642. DOI:10.3969/j.issn.1671-8348.2014.34.027.
|
| [8] |
马冠生,季成叶,马军,等. 中国7~18岁学龄儿童青少年腰围界值点研究[J]. 中华流行病学杂志,2010,31(6):609-615. DOI:10.3760/cma.j.issn.0254-6450.2010.06.003.
|
| [9] |
|
| [10] |
|
| [11] |
王晓红,赵天旺,雷朝秋,等. 中国1993—2015年儿童青少年腰围及腹型肥胖流行趋势[J]. 中国学校卫生,2020,41(6):897-900. DOI:10.16835/j.cnki.1000-9817.2020.06.026.
|
| [12] |
|
| [13] |
|
| [14] |
|
| [15] |
|
| [16] |
徐春晓,袁浙萍,朱益民. 腰围身高比是儿童青少年中心性肥胖评价的理想指标[C]//江西省科协第二届学术年会暨华东地区第十一次流行病学学术交流会议论文集. 2012:491.
|
| [17] |
|
| [18] |
师亚楠,燕武,曹梦瑶,等. 南京地区3~16岁儿童青少年颈围的参照标准值及其评估腹型肥胖准确性的横断面调查[J]. 中国循证儿科杂志,2023,18(5):334-340. DOI:10.3969/j.issn.1673-5501.2023.05.002.
|
| [19] |
国家质量监督检验检疫总局,中国国家标准化管理委员会. 学生健康检查技术规范:GB/T 26343—2010[S]. 北京:中国标准出版社,2011.
|
| [20] |
中华人民共和国国家卫生健康委员会. 7岁~18岁儿童青少年高腰围筛查界值(WS/T 611—2018)[S]. 北京:中国标准出版社,2018.
|
| [21] |
杨漾,吴艳强,王向军,等. 上海市儿童青少年腰围变化趋势及参考值[J]. 公共卫生与预防医学,2018,29(4):134-137. DOI:10.3969/j.issn.1006-2483.2018.04.036.
|
| [22] |
|
| [23] |
国家卫生健康委办公厅. 2019年全国学生常见病和健康影响因素监测与干预工作方案[EB/OL]. (2019-03-26)[2024-03-07].
|
| [24] |
国家卫生健康委办公厅,教育部办公厅,市场监督总局办公厅,等. 儿童青少年肥胖防控实施方案[EB/OL]. (2020-10-23)[2024-03-07].
|
| [25] |
卫洪光. "多样化"引领初中体育教学新趋势[J]. 教育,2016(33):44-45.
|
| [26] |
黄闪,桂曌环,章舒心,等. 中小学生家长肥胖知信行与子女腹型肥胖发生风险的关联[J]. 中国学校卫生,2022,43(11):1613-1617. DOI:10.16835/j.cnki.1000-9817.2022.11.004.
|
| [27] |
|
| [28] |
严明明,罗淑颖,张耀东. 郑州市城区7~15岁儿童青少年中心性肥胖流行现况[J]. 中国儿童保健杂志,2022,30(9):1000-1004. DOI:10.11852/zgetbjzz2021-1786.
|
| [29] |
左娇蕾,张倩,刘爱玲,等. 北京市儿童青少年体成分的分析[J]. 中国健康教育,2011,27(6):415-418,433.
|
| [30] |
寇永妹. 唐山市3199名7~18岁儿童青少年肥胖现况调查[D]. 唐山:华北理工大学,2020.
|
| [31] |
房红芸,刘丹,赵丽云,等. 中国6~17岁儿童青少年腰围水平及中心性肥胖流行特征[J]. 中华流行病学杂志,2018,39(6):715-719. DOI:10.3760/cma.j.issn.0254-6450.2018.06.004.
|
| [32] |
|
| [33] |
|
| [34] |
刘瑛,刘翠,宁静,等. COVID-19疫情期间居家限制对学龄前超重/肥胖儿童生活方式的影响[J]. 广东医学,2020,41(16):1621-1625. DOI:10.13820/j.cnki.gdyx.20201776.
|
| [35] |
|
| [36] |
|
| [1] | BAI Jiaxin, CHEN Yu, ZHOU Yiheng, LIU Lidi, YANG Rong, YAO Yi, YUAN Bo, ZHANG Yonggang, LEI Yi, ZENG Rui, JIA Yu, LIAO Xiaoyang. Assessment and Treatment of Early-onset Hypertension: Position Statement of the British and Irish Hypertension Association and Its Implications for Clinical Management of Early-onset Hypertension in China [J]. Chinese General Practice, 2025, 28(30): 3741-3746. |
| [2] | LYU Juan, LI Yuchuan, CAI Siyu, WANG Chen. Reasons for Seeking Medical Treatment in Endocrinology Department and the Need for Non-medical Intervention in Children with Normal Height: a Qualitative Study [J]. Chinese General Practice, 2025, 28(30): 3766-3772. |
| [3] | XU Yanpeng, HUANG Pe, ZHANG Pingping, LUO Yan, SHI Xiaoqi, WU Liusong, CHEN Yan, HE Zhixu. Expression of β-Adrenergic Receptors in Acute T-cell Lymphoblastic Leukemia and Its Clinical Significance [J]. Chinese General Practice, 2025, 28(27): 3391-3398. |
| [4] | SHAO Xiaoying, SHAO Jie, ZHU Yan, SHAO Jinling, SHANG Ling, WU Zhenlian, ZHAO Yu, ZHANG Jiacai. Analysis of the Current Status of Iron Deficiency and Factors Affecting Iron Deficiency Anemia among Children Aged 6-36 Months in Guizhou Province [J]. Chinese General Practice, 2025, 28(27): 3368-3374. |
| [5] | QUAN Jialin, ZHU Lin, SU Yu, CHEN Zekai, CHEN Ziqi, ZHANG Zhuofan. Research on the Improvement Effect of Exercise Modes on the Executive Function of Overweight or Obese Children or Adolescents: a Network Meta-analysis [J]. Chinese General Practice, 2025, 28(27): 3422-3431. |
| [6] | SHANG Zhonghua, JIANG Zhiyue, HUANG Zhaohui, YANG Xing, LIU Haiyan, ZHANG Li. Trends in Cervical Cancer Burden in China from 1990 to 2021 and Prediction for 2022 to 2035 [J]. Chinese General Practice, 2025, 28(26): 3314-3320. |
| [7] | JIANG Shihua, ZHU Zheng, REN Yingying, ZHU Yaolei, WANG Yue, GAO Xibin. Meta Analysis of the Prevalence and Risk Factors of Myopia in Chinese Children and Adolescents [J]. Chinese General Practice, 2025, 28(24): 3043-3052. |
| [8] | NA Feiyang, YANG Yi, WANG Yong, WANG Yannan. Study on the Etiology of Chronic Cough in Children Aged 0-14 Years in Lanzhou from 2014 to 2023 [J]. Chinese General Practice, 2025, 28(24): 3026-3031. |
| [9] | LI Miaoxiu, ZHU Bowen, KONG Lingjun, FANG Min. Progress in Research on Clinical Assessment Tools for Conservative Treatment of Adolescent Idiopathic Scoliosis [J]. Chinese General Practice, 2025, 28(24): 3079-3088. |
| [10] | NIE Daning, SHI Shusheng, TAO Yuru. Clinical Effect of Proprioceptive Neuromuscular Facilitation Technique Combined with Spiral Stabilizing Muscle Chain Training in the Treatment of Adolescent Idiopathic Scoliosis [J]. Chinese General Practice, 2025, 28(24): 3032-3042. |
| [11] | YANG Handan, QIAO Wen, HE Shu, CHEN Yi, TONG Yunmei. The Impact of Acceptance and Commitment Therapy Combined with Sertraline on Depressive Mood, Suicidal Ideation, and Sleep Quality of Adolescents with Depression [J]. Chinese General Practice, 2025, 28(22): 2813-2818. |
| [12] | LUO Jinping, SUN Jiaying, MOU Yifan, GENG Minghui, ZHANG Baoxuan, WANG Kang, YIN Wenqiang, CHEN Zhongming, MA Dongping. Quantitative Evaluation of China's Pediatric Drug Policies Based on Policy Modeling Consistency Index Model [J]. Chinese General Practice, 2025, 28(21): 2652-2660. |
| [13] | DU Qiongliang, LIN Bailang, GUO Honghua. Research Progress and Implications of Group Well-child Care [J]. Chinese General Practice, 2025, 28(21): 2672-2678. |
| [14] | HU Wanqin, YU Shenyan, CAO Xuehua, XIANG Feng, JIA Yu. Factors Associated with Precocious Puberty in Chinese Children: a Meta-analysis [J]. Chinese General Practice, 2025, 28(21): 2661-2671. |
| [15] | GUO Yi, HAN Xuanye, LIU Zhaojun, JIANG Yaoyao, FU Yang, SHI Lei, ZHAO Shihong. Construction of a Medical Transition Intervention Model for Multiple Chronic Diseases in Children Based on the E-Coach Management Model [J]. Chinese General Practice, 2025, 28(20): 2530-2537. |
| Viewed | ||||||
|
Full text |
|
|||||
|
Abstract |
|
|||||