
Chinese General Practice ›› 2024, Vol. 27 ›› Issue (33): 4168-4175.DOI: 10.12114/j.issn.1007-9572.2024.0172
Special Issue: 儿科最新文章合辑; 肥胖/减重最新文章合辑
• Original Research·Prevention and Control of Obesity in Children and Adolescents • Previous Articles Next Articles
Received:2024-05-27
Revised:2024-07-17
Published:2024-11-20
Online:2024-08-08
Contact:
ZHANG Xiayun
通讯作者:
张夏芸
作者简介:作者贡献:
张瑜、张夏芸提出了主要研究目标及研究命题;张瑜负责研究的构思与设计,撰写论文;张瑜、于硕负责数据的整理及分析;王冰清、冉青青进行论文的修订;张夏芸负责文章的质量控制及审查,对文章整体负责,监督管理。
基金资助:CLC Number:
Add to citation manager EndNote|Ris|BibTeX
URL: https://www.chinagp.net/EN/10.12114/j.issn.1007-9572.2024.0172
| 年龄(岁) | 2018年 | 2020年 | 2021年 | |||
|---|---|---|---|---|---|---|
| 男 | 女 | 男 | 女 | 男 | 女 | |
| 7 | 3 888(52.7) | 3 489(47.3) | 4 323(51.6) | 4 054(48.4) | 4 484(52.0) | 4 147(48.0) |
| 8 | 3 695(52.4) | 3 352(47.6) | 4 779(52.1) | 4 402(47.9) | 4 224(51.4) | 3 990(48.6) |
| 9 | 3 399(52.3) | 3 103(47.7) | 4 090(52.6) | 3 681(47.4) | 4 418(52.1) | 4 068(47.9) |
| 10 | 3 584(53.3) | 3 137(46.7) | 3 710(51.9) | 3 440(48.1) | 3 827(52.5) | 3 469(47.5) |
| 11 | 2 866(53.1) | 2 532(46.9) | 3 282(52.1) | 3 017(47.9) | 3 441(52.2) | 3 145(47.8) |
| 12 | 2 002(50.9) | 1 932(49.1) | 3 336(53.4) | 2 915(46.6) | 3 227(52.7) | 2 899(47.3) |
| 13 | 1 796(53.2) | 1 582(46.8) | 2 970(52.1) | 2 729(47.9) | 3 057(53.1) | 2 697(46.9) |
| 14 | 686(52.3) | 626(47.7) | 533(53.6) | 462(46.4) | 586(54.8) | 484(45.2) |
| 15 | 261(53.5) | 227(46.5) | 1 259(52.1) | 1 159(47.9) | 1 194(50.4) | 1 173(49.6) |
| 16 | 648(49.1) | 672(50.9) | 1 328(50.4) | 1 306(49.6) | 1 336(52.3) | 1 219(47.7) |
| 17 | 417(52.5) | 378(47.5) | 319(54.4) | 267(45.6) | 350(49.8) | 353(50.2) |
| 18 | 44(57.9) | 32(42.1) | 33(57.9) | 24(42.1) | 25(62.5) | 15(37.5) |
| 合计 | 23 286(52.5) | 21 062(47.5) | 29 962(52.2) | 27 456(47.8) | 30 169(52.2) | 27 659(47.8) |
| 年龄(岁) | 2022年 | 2023年 | 合计 | |||
| 男 | 女 | 男 | 女 | 男 | 女 | |
| 7 | 4 136(51.2) | 3 939(48.8) | 4 211(51.9) | 3 896(48.1) | 21 042(51.9) | 19 525(48.1) |
| 8 | 4 538(51.9) | 4 207(48.1) | 4 099(51.1) | 3 926(48.9) | 21 335(51.8) | 19 877(48.2) |
| 9 | 4 214(51.4) | 3 977(48.6) | 4 467(52.1) | 4 107(47.9) | 20 588(52.1) | 18 936(47.9) |
| 10 | 4 430(51.8) | 4 120(48.2) | 4 081(51.0) | 3 918(49.0) | 19 632(52.1) | 18 084(47.9) |
| 11 | 3 635(53.0) | 3 229(47.0) | 4 289(52.4) | 3 893(47.6) | 17 513(52.5) | 15 816(47.5) |
| 12 | 3 193(51.8) | 2 969(48.2) | 3 592(52.6) | 3 233(47.4) | 15 350(52.4) | 13 948(47.6) |
| 13 | 2 916(52.4) | 2 644(47.6) | 3 178(52.1) | 2 920(47.9) | 13 917(52.5) | 12 572(47.5) |
| 14 | 539(54.1) | 457(45.9) | 374(50.9) | 361(49.1) | 2 718(53.2) | 2 390(46.8) |
| 15 | 1 396(50.8) | 1 352(49.2) | 1 709(53.8) | 468(46.2) | 5 819(52.0) | 5 379(48.0) |
| 16 | 1 306(51.1) | 1 252(49.2) | 1 815(52.5) | 1 643(47.5) | 6 433(51.4) | 6 092(48.6) |
| 17 | 367(56.8) | 279(43.2) | 390(55.7) | 310(47.6) | 1 843(53.7) | 1 587(46.3) |
| 18 | 20(54.1) | 17(45.9) | 22(52.4) | 20(47.6) | 144(57.1) | 108(42.9) |
| 合计 | 30 690(51.9) | 28 442(48.1) | 32 227(52.0) | 29 695(48.0) | 146 334(52.1) | 134 314(47.9) |
Table 1 Basic information of children and adolescents aged 7 to 18 from 2018 to 2023 in Putuo District by gender and age group
| 年龄(岁) | 2018年 | 2020年 | 2021年 | |||
|---|---|---|---|---|---|---|
| 男 | 女 | 男 | 女 | 男 | 女 | |
| 7 | 3 888(52.7) | 3 489(47.3) | 4 323(51.6) | 4 054(48.4) | 4 484(52.0) | 4 147(48.0) |
| 8 | 3 695(52.4) | 3 352(47.6) | 4 779(52.1) | 4 402(47.9) | 4 224(51.4) | 3 990(48.6) |
| 9 | 3 399(52.3) | 3 103(47.7) | 4 090(52.6) | 3 681(47.4) | 4 418(52.1) | 4 068(47.9) |
| 10 | 3 584(53.3) | 3 137(46.7) | 3 710(51.9) | 3 440(48.1) | 3 827(52.5) | 3 469(47.5) |
| 11 | 2 866(53.1) | 2 532(46.9) | 3 282(52.1) | 3 017(47.9) | 3 441(52.2) | 3 145(47.8) |
| 12 | 2 002(50.9) | 1 932(49.1) | 3 336(53.4) | 2 915(46.6) | 3 227(52.7) | 2 899(47.3) |
| 13 | 1 796(53.2) | 1 582(46.8) | 2 970(52.1) | 2 729(47.9) | 3 057(53.1) | 2 697(46.9) |
| 14 | 686(52.3) | 626(47.7) | 533(53.6) | 462(46.4) | 586(54.8) | 484(45.2) |
| 15 | 261(53.5) | 227(46.5) | 1 259(52.1) | 1 159(47.9) | 1 194(50.4) | 1 173(49.6) |
| 16 | 648(49.1) | 672(50.9) | 1 328(50.4) | 1 306(49.6) | 1 336(52.3) | 1 219(47.7) |
| 17 | 417(52.5) | 378(47.5) | 319(54.4) | 267(45.6) | 350(49.8) | 353(50.2) |
| 18 | 44(57.9) | 32(42.1) | 33(57.9) | 24(42.1) | 25(62.5) | 15(37.5) |
| 合计 | 23 286(52.5) | 21 062(47.5) | 29 962(52.2) | 27 456(47.8) | 30 169(52.2) | 27 659(47.8) |
| 年龄(岁) | 2022年 | 2023年 | 合计 | |||
| 男 | 女 | 男 | 女 | 男 | 女 | |
| 7 | 4 136(51.2) | 3 939(48.8) | 4 211(51.9) | 3 896(48.1) | 21 042(51.9) | 19 525(48.1) |
| 8 | 4 538(51.9) | 4 207(48.1) | 4 099(51.1) | 3 926(48.9) | 21 335(51.8) | 19 877(48.2) |
| 9 | 4 214(51.4) | 3 977(48.6) | 4 467(52.1) | 4 107(47.9) | 20 588(52.1) | 18 936(47.9) |
| 10 | 4 430(51.8) | 4 120(48.2) | 4 081(51.0) | 3 918(49.0) | 19 632(52.1) | 18 084(47.9) |
| 11 | 3 635(53.0) | 3 229(47.0) | 4 289(52.4) | 3 893(47.6) | 17 513(52.5) | 15 816(47.5) |
| 12 | 3 193(51.8) | 2 969(48.2) | 3 592(52.6) | 3 233(47.4) | 15 350(52.4) | 13 948(47.6) |
| 13 | 2 916(52.4) | 2 644(47.6) | 3 178(52.1) | 2 920(47.9) | 13 917(52.5) | 12 572(47.5) |
| 14 | 539(54.1) | 457(45.9) | 374(50.9) | 361(49.1) | 2 718(53.2) | 2 390(46.8) |
| 15 | 1 396(50.8) | 1 352(49.2) | 1 709(53.8) | 468(46.2) | 5 819(52.0) | 5 379(48.0) |
| 16 | 1 306(51.1) | 1 252(49.2) | 1 815(52.5) | 1 643(47.5) | 6 433(51.4) | 6 092(48.6) |
| 17 | 367(56.8) | 279(43.2) | 390(55.7) | 310(47.6) | 1 843(53.7) | 1 587(46.3) |
| 18 | 20(54.1) | 17(45.9) | 22(52.4) | 20(47.6) | 144(57.1) | 108(42.9) |
| 合计 | 30 690(51.9) | 28 442(48.1) | 32 227(52.0) | 29 695(48.0) | 146 334(52.1) | 134 314(47.9) |
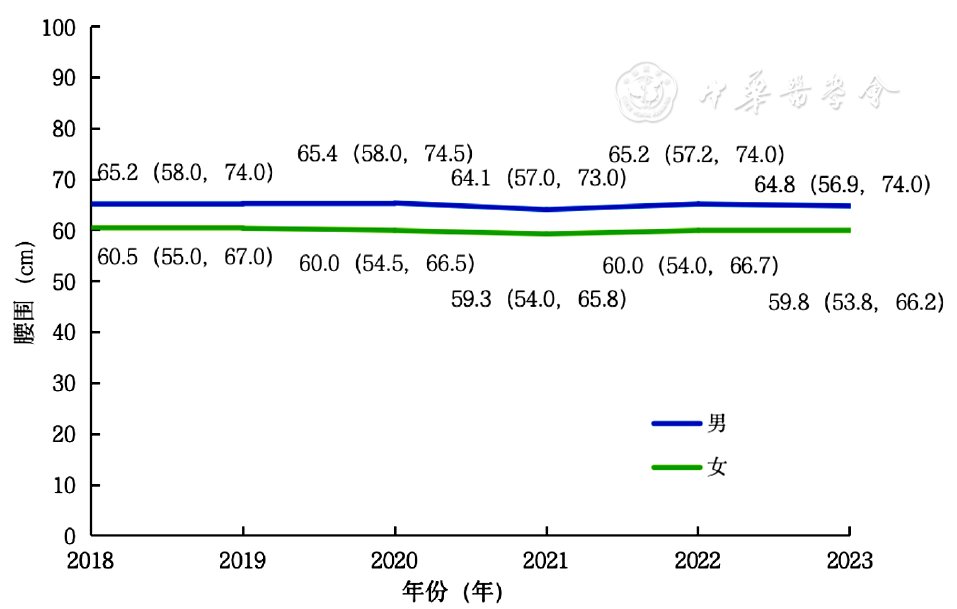
Figure 1 Waist circumference of children and adolescents in Putuo District from 2018 to 2023
| 年龄(岁) | 2018年 | 2020年 | 2021年 | 2022年 | 2023年 | H值 | P值 |
|---|---|---|---|---|---|---|---|
| 7 | 57.3(53.0,63.1) | 56.1(52.4,62.0) | 55.0(51.2,60.0) | 55.4(51.3,61.5) | 54.0(51.0,58.8) | 524.326 | <0.001 |
| 8 | 60.0(55.2,67.0) | 59.0(54.0,66.0) | 58.0(53.5,64.6) | 58.2(53.1,65.5) | 57.0(53.0,64.2) | 250.115 | <0.001 |
| 9 | 63.0(57.8,70.7) | 63.2(56.8,71.0) | 61.5(56.0,69.1) | 62.4(56.0,70.0) | 60.6(55.1,69.0) | 153.562 | <0.001 |
| 10 | 67.8(60.0,76.0) | 66.2(59.2,74.0) | 65.4(58.3,73.2) | 65.3(58.0,73.0) | 65.0(58.1,73.5) | 131.018 | <0.001 |
| 11 | 69.0(62.0,78.0) | 69.0(61.5,77.0) | 67.3(60.3,75.3) | 68.3(61.0,76.5) | 67.5(60.2,76.8) | 75.038 | <0.001 |
| 12 | 71.0(64.0,80.0) | 70.9(63.2,79.8) | 69.4(62.4,78.5) | 70.0(63.2,78.2) | 69.0(62.0,78.0) | 51.927 | <0.001 |
| 13 | 71.1(65.0,81.1) | 72.0(65.0,81.2) | 70.1(63.5,79.2) | 72.4(65.0,82.0) | 70.5(64.0,80.0) | 54.364 | <0.001 |
| 14 | 71.3(65.7,81.3) | 73.5(66.0,83.0) | 71.0(64.0,79.7) | 71.4(65.0,80.3) | 72.8(65.1,83.4) | 12.688 | 0.013 |
| 15 | 75.0(68.9,82.2) | 74.0(67.8,84.6) | 73.7(67.0,83.3) | 76.0(68.0,85.0) | 74.8(67.5,84.2) | 10.836 | 0.028 |
| 16 | 75.4(68.2,84.5) | 75.0(68.5,84.8) | 74.0(68.0,84.0) | 77.0(69.2,86.0) | 75.0(68.3,85.2) | 24.531 | <0.001 |
| 17 | 76.6(70.6,85.0) | 77.9(69.5,87.0) | 75.0(67.5,83.0) | 77.1(70.0,88.0) | 77.3(69.5,88.1) | 13.631 | 0.009 |
| 18 | 77.7(69.2,87.1) | 81.0(70.6,89.2) | 82.0(71.5,89.2) | 82.5(70.0,87.5) | 83.8(75.7,95.4) | 5.625 | 0.229 |
| 合计 | 65.2(58.0,74.0) | 65.4(58.0,74.5) | 64.1(57.0,73.0) | 65.2(57.2,74.0) | 64.8(56.9,74.0) | 209.785 | <0.001 |
Table 2 Waist circumference of male students aged 7 to 18 in Putuo District from 2018 to 2023
| 年龄(岁) | 2018年 | 2020年 | 2021年 | 2022年 | 2023年 | H值 | P值 |
|---|---|---|---|---|---|---|---|
| 7 | 57.3(53.0,63.1) | 56.1(52.4,62.0) | 55.0(51.2,60.0) | 55.4(51.3,61.5) | 54.0(51.0,58.8) | 524.326 | <0.001 |
| 8 | 60.0(55.2,67.0) | 59.0(54.0,66.0) | 58.0(53.5,64.6) | 58.2(53.1,65.5) | 57.0(53.0,64.2) | 250.115 | <0.001 |
| 9 | 63.0(57.8,70.7) | 63.2(56.8,71.0) | 61.5(56.0,69.1) | 62.4(56.0,70.0) | 60.6(55.1,69.0) | 153.562 | <0.001 |
| 10 | 67.8(60.0,76.0) | 66.2(59.2,74.0) | 65.4(58.3,73.2) | 65.3(58.0,73.0) | 65.0(58.1,73.5) | 131.018 | <0.001 |
| 11 | 69.0(62.0,78.0) | 69.0(61.5,77.0) | 67.3(60.3,75.3) | 68.3(61.0,76.5) | 67.5(60.2,76.8) | 75.038 | <0.001 |
| 12 | 71.0(64.0,80.0) | 70.9(63.2,79.8) | 69.4(62.4,78.5) | 70.0(63.2,78.2) | 69.0(62.0,78.0) | 51.927 | <0.001 |
| 13 | 71.1(65.0,81.1) | 72.0(65.0,81.2) | 70.1(63.5,79.2) | 72.4(65.0,82.0) | 70.5(64.0,80.0) | 54.364 | <0.001 |
| 14 | 71.3(65.7,81.3) | 73.5(66.0,83.0) | 71.0(64.0,79.7) | 71.4(65.0,80.3) | 72.8(65.1,83.4) | 12.688 | 0.013 |
| 15 | 75.0(68.9,82.2) | 74.0(67.8,84.6) | 73.7(67.0,83.3) | 76.0(68.0,85.0) | 74.8(67.5,84.2) | 10.836 | 0.028 |
| 16 | 75.4(68.2,84.5) | 75.0(68.5,84.8) | 74.0(68.0,84.0) | 77.0(69.2,86.0) | 75.0(68.3,85.2) | 24.531 | <0.001 |
| 17 | 76.6(70.6,85.0) | 77.9(69.5,87.0) | 75.0(67.5,83.0) | 77.1(70.0,88.0) | 77.3(69.5,88.1) | 13.631 | 0.009 |
| 18 | 77.7(69.2,87.1) | 81.0(70.6,89.2) | 82.0(71.5,89.2) | 82.5(70.0,87.5) | 83.8(75.7,95.4) | 5.625 | 0.229 |
| 合计 | 65.2(58.0,74.0) | 65.4(58.0,74.5) | 64.1(57.0,73.0) | 65.2(57.2,74.0) | 64.8(56.9,74.0) | 209.785 | <0.001 |
| 年龄(岁) | 2018年 | 2020年 | 2021年 | 2022年 | 2023年 | H值 | P值 |
|---|---|---|---|---|---|---|---|
| 7 | 54.8(51.0,59.0) | 53.0(49.8,57.5) | 52.0(49.1,56.2) | 52.3(49.0,57.2) | 51.4(48.8,55.0) | 587.505 | <0.001 |
| 8 | 56.0(53.0,61.5) | 55.0(51.1,60.0) | 54.3(50.8,59.0) | 54.6(50.7,60.0) | 53.3(52.2,58.0) | 378.600 | <0.001 |
| 9 | 58.6(54.5,64.0) | 57.6(53.5,63.4) | 56.6(52.5,62.2) | 56.7(52.5,63.0) | 56.0(52.2,61.5) | 251.393 | <0.001 |
| 10 | 61.0(57.0,67.1) | 60.1(55.8,66.2) | 59.9(55.3,65.3) | 59.3(54.5,65.5) | 59.1(55.0,65.1) | 152.432 | <0.001 |
| 11 | 63.4(59.0,70.4) | 62.0(58.0,68.0) | 61.7(57.2,68.0) | 62.0(57.2,68.2) | 61.5(57.0,67.8) | 110.575 | <0.001 |
| 12 | 65.5(60.6,71.4) | 64.5(59.9,70.4) | 63.5(59.0,69.5) | 64.3(59.5,70.4) | 63.3(59.0,69.0) | 96.686 | <0.001 |
| 13 | 66.9(62.0,72.5) | 65.0(60.8,71.0) | 64.1(60.0,70.0) | 65.0(60.7,71.0) | 65.3(61.2,71.0) | 78.552 | <0.001 |
| 14 | 66.5(62.3,73.0) | 65.0(61.0,70.5) | 65.5(60.8,72.0) | 65.8(61.7,71.1) | 65.1(61.0,71.8) | 14.132 | 0.007 |
| 15 | 70.0(64.1,75.5) | 66.0(62.0,71.0) | 66.2(62.0,71.2) | 67.4(63.0,73.5) | 66.6(62.5,72.4) | 51.157 | <0.001 |
| 16 | 68.2(63.8,74.3) | 67.1(63.0,73.0) | 65.8(62.0,70.5) | 67.7(63.0,73.0) | 68.0(63.3,73.8) | 81.147 | <0.001 |
| 17 | 69.0(64.4,74.2) | 67.1(63.0,73.0) | 66.0(61.7,71.8) | 67.8(63.2,73.0) | 68.5(64.0,74.5) | 29.016 | <0.001 |
| 18 | 73.9(68.0,81.2) | 62.8(60.2,69.2) | 66.4(62.0,74.3) | 68.0(61.2,81.0) | 67.8(64.1,74.6) | 18.769 | 0.001 |
| 合计 | 60.5(55.0,67.0) | 60.0(54.5,66.5) | 59.3(54.0,65.8) | 60.0(54.0,66.7) | 59.8(53.8,66.2) | 373.076 | <0.001 |
Table 3 Waist circumference of female students aged 7 to 18 in Putuo District from 2018 to 2023
| 年龄(岁) | 2018年 | 2020年 | 2021年 | 2022年 | 2023年 | H值 | P值 |
|---|---|---|---|---|---|---|---|
| 7 | 54.8(51.0,59.0) | 53.0(49.8,57.5) | 52.0(49.1,56.2) | 52.3(49.0,57.2) | 51.4(48.8,55.0) | 587.505 | <0.001 |
| 8 | 56.0(53.0,61.5) | 55.0(51.1,60.0) | 54.3(50.8,59.0) | 54.6(50.7,60.0) | 53.3(52.2,58.0) | 378.600 | <0.001 |
| 9 | 58.6(54.5,64.0) | 57.6(53.5,63.4) | 56.6(52.5,62.2) | 56.7(52.5,63.0) | 56.0(52.2,61.5) | 251.393 | <0.001 |
| 10 | 61.0(57.0,67.1) | 60.1(55.8,66.2) | 59.9(55.3,65.3) | 59.3(54.5,65.5) | 59.1(55.0,65.1) | 152.432 | <0.001 |
| 11 | 63.4(59.0,70.4) | 62.0(58.0,68.0) | 61.7(57.2,68.0) | 62.0(57.2,68.2) | 61.5(57.0,67.8) | 110.575 | <0.001 |
| 12 | 65.5(60.6,71.4) | 64.5(59.9,70.4) | 63.5(59.0,69.5) | 64.3(59.5,70.4) | 63.3(59.0,69.0) | 96.686 | <0.001 |
| 13 | 66.9(62.0,72.5) | 65.0(60.8,71.0) | 64.1(60.0,70.0) | 65.0(60.7,71.0) | 65.3(61.2,71.0) | 78.552 | <0.001 |
| 14 | 66.5(62.3,73.0) | 65.0(61.0,70.5) | 65.5(60.8,72.0) | 65.8(61.7,71.1) | 65.1(61.0,71.8) | 14.132 | 0.007 |
| 15 | 70.0(64.1,75.5) | 66.0(62.0,71.0) | 66.2(62.0,71.2) | 67.4(63.0,73.5) | 66.6(62.5,72.4) | 51.157 | <0.001 |
| 16 | 68.2(63.8,74.3) | 67.1(63.0,73.0) | 65.8(62.0,70.5) | 67.7(63.0,73.0) | 68.0(63.3,73.8) | 81.147 | <0.001 |
| 17 | 69.0(64.4,74.2) | 67.1(63.0,73.0) | 66.0(61.7,71.8) | 67.8(63.2,73.0) | 68.5(64.0,74.5) | 29.016 | <0.001 |
| 18 | 73.9(68.0,81.2) | 62.8(60.2,69.2) | 66.4(62.0,74.3) | 68.0(61.2,81.0) | 67.8(64.1,74.6) | 18.769 | 0.001 |
| 合计 | 60.5(55.0,67.0) | 60.0(54.5,66.5) | 59.3(54.0,65.8) | 60.0(54.0,66.7) | 59.8(53.8,66.2) | 373.076 | <0.001 |
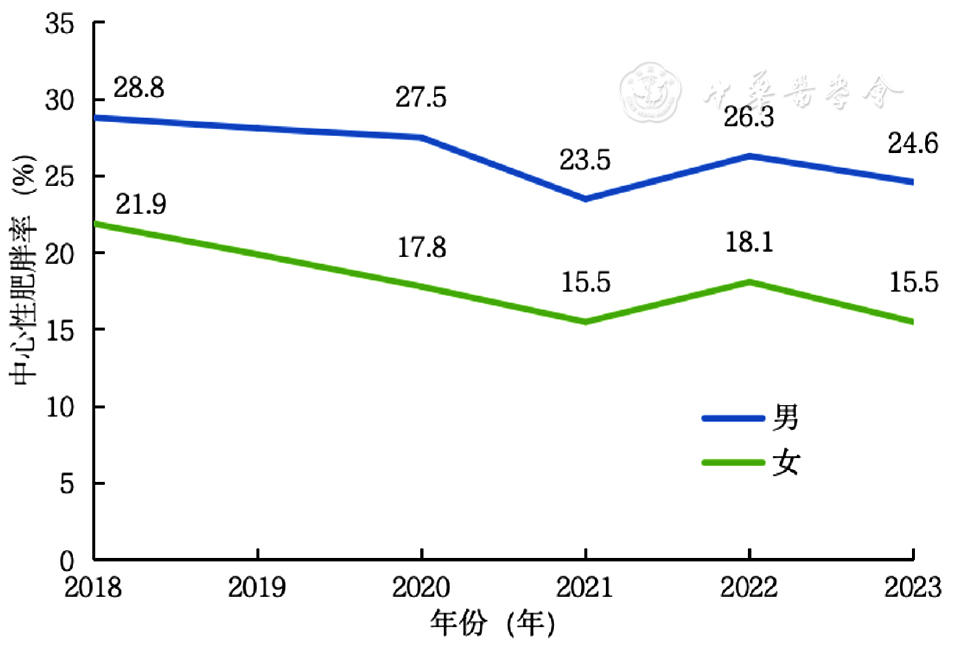
Figure 2 Prevalence of central obesity of children and adolescents in Putuo District from 2018 to 2023
| 年龄(岁) | 人次 | 总中心性肥胖率 | 中心性肥胖率 | 不同年份比较 | 趋势分析 | ||||||
|---|---|---|---|---|---|---|---|---|---|---|---|
| 2018年 | 2020年 | 2021年 | 2022年 | 2023年 | χ2值 | P值 | Z趋势值 | P趋势值 | |||
| 7 | 21 042 | 3 896(18.5) | 951(24.5) | 862(19.9) | 695(15.5) | 813(19.7) | 575(13.7) | 193.424 | <0.001 | -11.286 | <0.001 |
| 8 | 21 335 | 4 681(21.9) | 968(26.2) | 1 103(23.1) | 809(19.2) | 996(21.9) | 805(19.6) | 74.572 | <0.001 | -6.695 | <0.001 |
| 9 | 20 588 | 5 292(25.7) | 960(28.2) | 1 195(29.2) | 1 033(23.4) | 1 074(25.5) | 1 030(23.1) | 66.878 | <0.001 | -6.468 | <0.001 |
| 10 | 19 632 | 5 243(26.7) | 1 118(31.2) | 1 002(27.0) | 966(25.2) | 1 087(24.5) | 1 070(26.2) | 52.380 | <0.001 | -5.389 | <0.001 |
| 11 | 17 513 | 4 900(28.0) | 918(32.0) | 965(29.4) | 826(24.0) | 1 008(27.7) | 1 183(27.6) | 54.070 | <0.001 | -3.838 | <0.001 |
| 12 | 15 350 | 4 394(28.6) | 634(31.7) | 1 025(30.7) | 893(27.7) | 890(27.9) | 952(26.5) | 25.508 | <0.001 | -4.844 | <0.001 |
| 13 | 13 917 | 4 102(29.5) | 541(30.1) | 921(31.0) | 829(27.1) | 944(32.4) | 867(27.3) | 31.038 | <0.001 | -1.708 | 0.088 |
| 14 | 2 718 | 779(28.7) | 192(28.0) | 166(31.1) | 147(25.1) | 156(28.9) | 118(31.6) | 6.972 | 0.137 | 0.588 | 0.556 |
| 15 | 5 819 | 1 939(33.3) | 78(29.9) | 424(33.7) | 368(30.8) | 485(34.7) | 584(34.2) | 6.644 | 0.156 | 1.398 | 0.162 |
| 16 | 6 433 | 2 135(33.2) | 209(32.3) | 438(33.0) | 408(30.5) | 485(37.1) | 595(32.8) | 13.826 | 0.008 | 1.017 | 0.309 |
| 17 | 1 843 | 605(32.8) | 129(30.9) | 112(35.1) | 95(27.1) | 125(34.1) | 144(36.9) | 9.779 | 0.044 | 1.531 | 0.126 |
| 18 | 144 | 63(43.8) | 16(36.4) | 14(42.4) | 11(44.0) | 10(50.0) | 12(54.5) | 2.359 | 0.670 | 1.520 | 0.128 |
| Z趋势值 | 35.167 | 7.039 | 14.978 | 16.800 | 18.329 | 22.211 | |||||
| P趋势值 | <0.001 | <0.001 | <0.001 | <0.001 | <0.001 | <0.001 | |||||
Table 4 Prevalence of central obesity and the trend of it in male students aged 7 to 18 in Putuo District from 2018 to 2023
| 年龄(岁) | 人次 | 总中心性肥胖率 | 中心性肥胖率 | 不同年份比较 | 趋势分析 | ||||||
|---|---|---|---|---|---|---|---|---|---|---|---|
| 2018年 | 2020年 | 2021年 | 2022年 | 2023年 | χ2值 | P值 | Z趋势值 | P趋势值 | |||
| 7 | 21 042 | 3 896(18.5) | 951(24.5) | 862(19.9) | 695(15.5) | 813(19.7) | 575(13.7) | 193.424 | <0.001 | -11.286 | <0.001 |
| 8 | 21 335 | 4 681(21.9) | 968(26.2) | 1 103(23.1) | 809(19.2) | 996(21.9) | 805(19.6) | 74.572 | <0.001 | -6.695 | <0.001 |
| 9 | 20 588 | 5 292(25.7) | 960(28.2) | 1 195(29.2) | 1 033(23.4) | 1 074(25.5) | 1 030(23.1) | 66.878 | <0.001 | -6.468 | <0.001 |
| 10 | 19 632 | 5 243(26.7) | 1 118(31.2) | 1 002(27.0) | 966(25.2) | 1 087(24.5) | 1 070(26.2) | 52.380 | <0.001 | -5.389 | <0.001 |
| 11 | 17 513 | 4 900(28.0) | 918(32.0) | 965(29.4) | 826(24.0) | 1 008(27.7) | 1 183(27.6) | 54.070 | <0.001 | -3.838 | <0.001 |
| 12 | 15 350 | 4 394(28.6) | 634(31.7) | 1 025(30.7) | 893(27.7) | 890(27.9) | 952(26.5) | 25.508 | <0.001 | -4.844 | <0.001 |
| 13 | 13 917 | 4 102(29.5) | 541(30.1) | 921(31.0) | 829(27.1) | 944(32.4) | 867(27.3) | 31.038 | <0.001 | -1.708 | 0.088 |
| 14 | 2 718 | 779(28.7) | 192(28.0) | 166(31.1) | 147(25.1) | 156(28.9) | 118(31.6) | 6.972 | 0.137 | 0.588 | 0.556 |
| 15 | 5 819 | 1 939(33.3) | 78(29.9) | 424(33.7) | 368(30.8) | 485(34.7) | 584(34.2) | 6.644 | 0.156 | 1.398 | 0.162 |
| 16 | 6 433 | 2 135(33.2) | 209(32.3) | 438(33.0) | 408(30.5) | 485(37.1) | 595(32.8) | 13.826 | 0.008 | 1.017 | 0.309 |
| 17 | 1 843 | 605(32.8) | 129(30.9) | 112(35.1) | 95(27.1) | 125(34.1) | 144(36.9) | 9.779 | 0.044 | 1.531 | 0.126 |
| 18 | 144 | 63(43.8) | 16(36.4) | 14(42.4) | 11(44.0) | 10(50.0) | 12(54.5) | 2.359 | 0.670 | 1.520 | 0.128 |
| Z趋势值 | 35.167 | 7.039 | 14.978 | 16.800 | 18.329 | 22.211 | |||||
| P趋势值 | <0.001 | <0.001 | <0.001 | <0.001 | <0.001 | <0.001 | |||||
| 年龄(岁) | 人次 | 总中心性肥胖率 | 中心性肥胖率 | 不同年份比较 | 趋势分析 | ||||||
|---|---|---|---|---|---|---|---|---|---|---|---|
| 2018年 | 2020年 | 2021年 | 2022年 | 2023年 | χ2值 | P值 | Z趋势值 | P趋势值 | |||
| 7 | 19 525 | 2 765(14.2) | 701(25.4) | 603(14.9) | 479(11.6) | 617(15.7) | 365(9.4) | 206.829 | <0.001 | -11.21 | <0.001 |
| 8 | 19 877 | 3 313(16.7) | 711(21.2) | 779(17.7) | 586(14.7) | 740(17.6) | 497(12.7) | 112.441 | <0.001 | -8.652 | <0.001 |
| 9 | 18 936 | 3 424(18.1) | 627(20.2) | 725(19.7) | 693(17.0) | 742(18.7) | 637(15.5) | 38.162 | <0.001 | -5183 | <0.001 |
| 10 | 18 084 | 3 596(19.9) | 756(24.1) | 718(20.9) | 641(18.5) | 786(19.1) | 695(17.7) | 54.406 | <0.001 | -6.646 | <0.001 |
| 11 | 15 816 | 3 068(19.4) | 634(25.0) | 554(18.4) | 552(17.6) | 616(19.1) | 712(18.3) | 63.740 | <0.001 | -5.011 | <0.001 |
| 12 | 13 948 | 2 495(17.9) | 419(21.7) | 537(18.4) | 472(16.3) | 564(19.0) | 503(15.6) | 39.076 | <0.001 | -4.529 | <0.001 |
| 13 | 12 572 | 2 198(17.5) | 338(21.4) | 481(17.6) | 419(15.5) | 472(17.9) | 488(16.7) | 25.107 | <0.001 | -2.821 | 0.005 |
| 14 | 2 390 | 422(17.7) | 119(19.0) | 68(14.7) | 89(18.4) | 81(17.7) | 65(18.0) | 3.741 | 0.442 | -0.020 | 0.984 |
| 15 | 5 379 | 886(16.5) | 58(25.6) | 149(12.9) | 163(13.9) | 267(19.7) | 249(17.0) | 41.077 | <0.001 | 1.795 | 0.073 |
| 16 | 6 092 | 1 071(17.6) | 149(22.2) | 238(18.2) | 130(10.7) | 228(18.2) | 326(19.8) | 56.534 | <0.001 | 0.300 | 0.765 |
| 17 | 1 587 | 275(17.3) | 78(20.6) | 40(15.0) | 50(14.2) | 44(15.8) | 63(20.3) | 8.791 | 0.067 | -0.208 | 0.835 |
| 18 | 108 | 27(25.0) | 14(43.8) | 1(4.2) | 3(20.0) | 5(29.4) | 4(20.0) | — | 0.011 | -1.230 | 0.219 |
| Z趋势值 | 6.533 | 2.238 | -0.341 | 1.205 | 2.672 | 11.177 | |||||
| P趋势值 | <0.001 | 0.025 | 0.733 | 0.228 | 0.008 | <0.001 | |||||
Table 5 Prevalence of central obesity and the trend of it in female students aged 7 to 18 in Putuo District from 2018 to 2023
| 年龄(岁) | 人次 | 总中心性肥胖率 | 中心性肥胖率 | 不同年份比较 | 趋势分析 | ||||||
|---|---|---|---|---|---|---|---|---|---|---|---|
| 2018年 | 2020年 | 2021年 | 2022年 | 2023年 | χ2值 | P值 | Z趋势值 | P趋势值 | |||
| 7 | 19 525 | 2 765(14.2) | 701(25.4) | 603(14.9) | 479(11.6) | 617(15.7) | 365(9.4) | 206.829 | <0.001 | -11.21 | <0.001 |
| 8 | 19 877 | 3 313(16.7) | 711(21.2) | 779(17.7) | 586(14.7) | 740(17.6) | 497(12.7) | 112.441 | <0.001 | -8.652 | <0.001 |
| 9 | 18 936 | 3 424(18.1) | 627(20.2) | 725(19.7) | 693(17.0) | 742(18.7) | 637(15.5) | 38.162 | <0.001 | -5183 | <0.001 |
| 10 | 18 084 | 3 596(19.9) | 756(24.1) | 718(20.9) | 641(18.5) | 786(19.1) | 695(17.7) | 54.406 | <0.001 | -6.646 | <0.001 |
| 11 | 15 816 | 3 068(19.4) | 634(25.0) | 554(18.4) | 552(17.6) | 616(19.1) | 712(18.3) | 63.740 | <0.001 | -5.011 | <0.001 |
| 12 | 13 948 | 2 495(17.9) | 419(21.7) | 537(18.4) | 472(16.3) | 564(19.0) | 503(15.6) | 39.076 | <0.001 | -4.529 | <0.001 |
| 13 | 12 572 | 2 198(17.5) | 338(21.4) | 481(17.6) | 419(15.5) | 472(17.9) | 488(16.7) | 25.107 | <0.001 | -2.821 | 0.005 |
| 14 | 2 390 | 422(17.7) | 119(19.0) | 68(14.7) | 89(18.4) | 81(17.7) | 65(18.0) | 3.741 | 0.442 | -0.020 | 0.984 |
| 15 | 5 379 | 886(16.5) | 58(25.6) | 149(12.9) | 163(13.9) | 267(19.7) | 249(17.0) | 41.077 | <0.001 | 1.795 | 0.073 |
| 16 | 6 092 | 1 071(17.6) | 149(22.2) | 238(18.2) | 130(10.7) | 228(18.2) | 326(19.8) | 56.534 | <0.001 | 0.300 | 0.765 |
| 17 | 1 587 | 275(17.3) | 78(20.6) | 40(15.0) | 50(14.2) | 44(15.8) | 63(20.3) | 8.791 | 0.067 | -0.208 | 0.835 |
| 18 | 108 | 27(25.0) | 14(43.8) | 1(4.2) | 3(20.0) | 5(29.4) | 4(20.0) | — | 0.011 | -1.230 | 0.219 |
| Z趋势值 | 6.533 | 2.238 | -0.341 | 1.205 | 2.672 | 11.177 | |||||
| P趋势值 | <0.001 | 0.025 | 0.733 | 0.228 | 0.008 | <0.001 | |||||
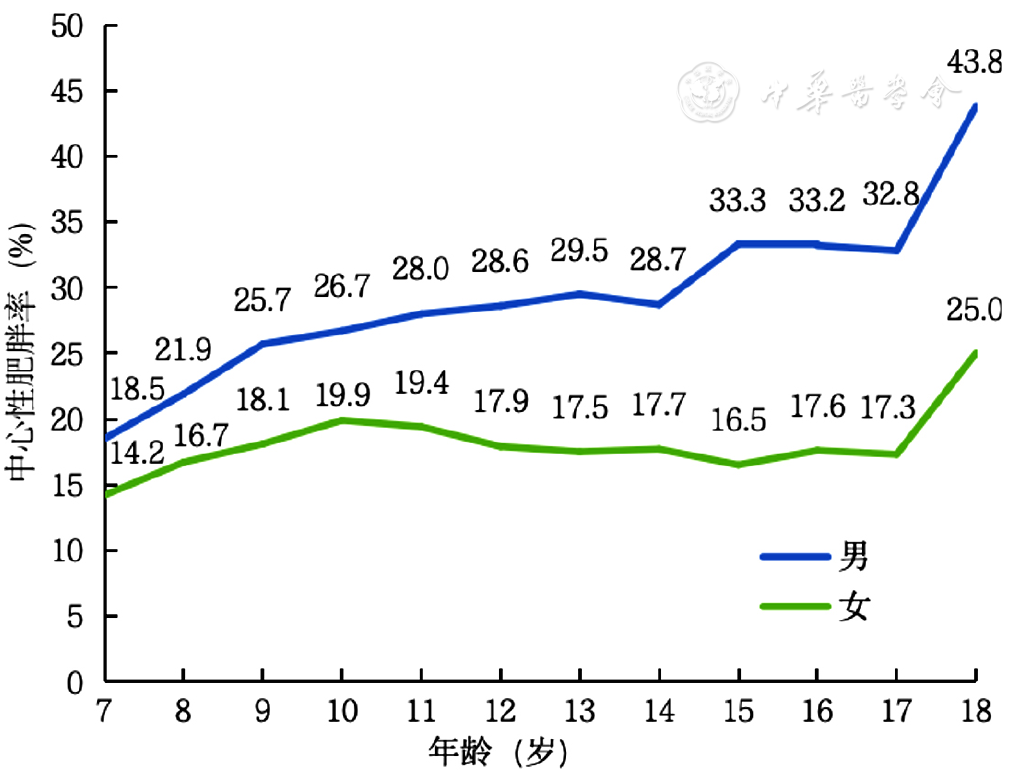
Figure 3 Prevalence of central obesity of children and adolescents aged 7 to 18 in Putuo District
| 年龄(岁) | 腰围[M(P25,P75),cm] | 中心性肥胖率[人次(%)] | ||||||
|---|---|---|---|---|---|---|---|---|
| 男 | 女 | U值 | P值 | 男 | 女 | χ2值 | P值 | |
| 7 | 55.5(51.8,61.0) | 52.6(49.5,57.0) | 149 380 884.500 | <0.001 | 3 896(18.5) | 2 765(14.2) | 139.899 | <0.001 |
| 8 | 58.4(53.8,65.5) | 54.7(51.0,60.0) | 149 011 986.000 | <0.001 | 4 681(21.9) | 3 313(16.7) | 182.995 | <0.001 |
| 9 | 62.0(56.0,70.0) | 57.0(53.0,63.0) | 131 440 332.000 | <0.001 | 5 292(25.7) | 3 424(18.1) | 333.395 | <0.001 |
| 10 | 66.0(59.0,74.0) | 60.0(55.3,66.0) | 118 839 826.000 | <0.001 | 5 243(26.7) | 3 596(19.9) | 244.106 | <0.001 |
| 11 | 68.1(61.0,77.0) | 62.0(57.5,68.3) | 93 543 608.500 | <0.001 | 4 900(28.0) | 3 068(19.4) | 336.398 | <0.001 |
| 12 | 70.0(63.0,79.0) | 64.0(59.5,70.0) | 72 052 644.000 | <0.001 | 4 394(28.6) | 2 495(17.9) | 468.478 | <0.001 |
| 13 | 71.0(64.5,80.6) | 65.0(61.0,71.0) | 56 536 350.000 | <0.001 | 4 102(29.5) | 2 198(17.5) | 523.966 | <0.001 |
| 14 | 71.7(65.0,81.5) | 65.8(61.2,71.5) | 2 093 833.500 | <0.001 | 779(28.7) | 422(17.7) | 85.626 | <0.001 |
| 15 | 74.8(67.7,84.2) | 66.8(62.3,72.2) | 8 524 691.500 | <0.001 | 1 939(33.3) | 886(16.5) | 420.738 | <0.001 |
| 16 | 75.2(68.5,85.0) | 67.1(63.0,73.0) | 10 396 635.500 | <0.001 | 2 135(33.2) | 1 071(17.6) | 400.223 | <0.001 |
| 17 | 77.0(69.5,86.5) | 67.8(63.2,73.3) | 718 897.500 | <0.001 | 605(32.8) | 275(17.3) | 107.389 | <0.001 |
| 18 | 81.0(70.6,89.9) | 68.6(62.5,76.7) | 3 807.000 | <0.001 | 63(43.8) | 27(25.0) | 9.450 | 0.002 |
| 合计 | 65.5(57.3,74.0) | 60.0(54.1,66.4) | 7 128 257 114.500 | <0.001 | 38 029(26.0) | 23 540(17.5) | 2 928.075 | <0.001 |
Table 6 Comparison of waist circumference and the prevalence of central obesity among children and adolescents aged 7 to 18 by gender
| 年龄(岁) | 腰围[M(P25,P75),cm] | 中心性肥胖率[人次(%)] | ||||||
|---|---|---|---|---|---|---|---|---|
| 男 | 女 | U值 | P值 | 男 | 女 | χ2值 | P值 | |
| 7 | 55.5(51.8,61.0) | 52.6(49.5,57.0) | 149 380 884.500 | <0.001 | 3 896(18.5) | 2 765(14.2) | 139.899 | <0.001 |
| 8 | 58.4(53.8,65.5) | 54.7(51.0,60.0) | 149 011 986.000 | <0.001 | 4 681(21.9) | 3 313(16.7) | 182.995 | <0.001 |
| 9 | 62.0(56.0,70.0) | 57.0(53.0,63.0) | 131 440 332.000 | <0.001 | 5 292(25.7) | 3 424(18.1) | 333.395 | <0.001 |
| 10 | 66.0(59.0,74.0) | 60.0(55.3,66.0) | 118 839 826.000 | <0.001 | 5 243(26.7) | 3 596(19.9) | 244.106 | <0.001 |
| 11 | 68.1(61.0,77.0) | 62.0(57.5,68.3) | 93 543 608.500 | <0.001 | 4 900(28.0) | 3 068(19.4) | 336.398 | <0.001 |
| 12 | 70.0(63.0,79.0) | 64.0(59.5,70.0) | 72 052 644.000 | <0.001 | 4 394(28.6) | 2 495(17.9) | 468.478 | <0.001 |
| 13 | 71.0(64.5,80.6) | 65.0(61.0,71.0) | 56 536 350.000 | <0.001 | 4 102(29.5) | 2 198(17.5) | 523.966 | <0.001 |
| 14 | 71.7(65.0,81.5) | 65.8(61.2,71.5) | 2 093 833.500 | <0.001 | 779(28.7) | 422(17.7) | 85.626 | <0.001 |
| 15 | 74.8(67.7,84.2) | 66.8(62.3,72.2) | 8 524 691.500 | <0.001 | 1 939(33.3) | 886(16.5) | 420.738 | <0.001 |
| 16 | 75.2(68.5,85.0) | 67.1(63.0,73.0) | 10 396 635.500 | <0.001 | 2 135(33.2) | 1 071(17.6) | 400.223 | <0.001 |
| 17 | 77.0(69.5,86.5) | 67.8(63.2,73.3) | 718 897.500 | <0.001 | 605(32.8) | 275(17.3) | 107.389 | <0.001 |
| 18 | 81.0(70.6,89.9) | 68.6(62.5,76.7) | 3 807.000 | <0.001 | 63(43.8) | 27(25.0) | 9.450 | 0.002 |
| 合计 | 65.5(57.3,74.0) | 60.0(54.1,66.4) | 7 128 257 114.500 | <0.001 | 38 029(26.0) | 23 540(17.5) | 2 928.075 | <0.001 |
| [1] |
|
| [2] | |
| [3] |
叶新华,陈虹,康曦光,等. 兰州市儿童肥胖与睡眠障碍的相关性分析[J]. 中国当代儿科杂志,2019,21(10):987-991.
|
| [4] |
|
| [5] | |
| [6] |
|
| [7] |
李斌,郭均涛,王宏,等. 体质量指数、腰臀比、体脂百分率评价青少年肥胖的研究[J]. 重庆医学,2014,43(34):4637-4639,4642. DOI:10.3969/j.issn.1671-8348.2014.34.027.
|
| [8] |
马冠生,季成叶,马军,等. 中国7~18岁学龄儿童青少年腰围界值点研究[J]. 中华流行病学杂志,2010,31(6):609-615. DOI:10.3760/cma.j.issn.0254-6450.2010.06.003.
|
| [9] |
|
| [10] |
|
| [11] |
王晓红,赵天旺,雷朝秋,等. 中国1993—2015年儿童青少年腰围及腹型肥胖流行趋势[J]. 中国学校卫生,2020,41(6):897-900. DOI:10.16835/j.cnki.1000-9817.2020.06.026.
|
| [12] |
|
| [13] |
|
| [14] |
|
| [15] |
|
| [16] |
徐春晓,袁浙萍,朱益民. 腰围身高比是儿童青少年中心性肥胖评价的理想指标[C]//江西省科协第二届学术年会暨华东地区第十一次流行病学学术交流会议论文集. 2012:491.
|
| [17] |
|
| [18] |
师亚楠,燕武,曹梦瑶,等. 南京地区3~16岁儿童青少年颈围的参照标准值及其评估腹型肥胖准确性的横断面调查[J]. 中国循证儿科杂志,2023,18(5):334-340. DOI:10.3969/j.issn.1673-5501.2023.05.002.
|
| [19] |
国家质量监督检验检疫总局,中国国家标准化管理委员会. 学生健康检查技术规范:GB/T 26343—2010[S]. 北京:中国标准出版社,2011.
|
| [20] |
中华人民共和国国家卫生健康委员会. 7岁~18岁儿童青少年高腰围筛查界值(WS/T 611—2018)[S]. 北京:中国标准出版社,2018.
|
| [21] |
杨漾,吴艳强,王向军,等. 上海市儿童青少年腰围变化趋势及参考值[J]. 公共卫生与预防医学,2018,29(4):134-137. DOI:10.3969/j.issn.1006-2483.2018.04.036.
|
| [22] |
|
| [23] |
国家卫生健康委办公厅. 2019年全国学生常见病和健康影响因素监测与干预工作方案[EB/OL]. (2019-03-26)[2024-03-07].
|
| [24] |
国家卫生健康委办公厅,教育部办公厅,市场监督总局办公厅,等. 儿童青少年肥胖防控实施方案[EB/OL]. (2020-10-23)[2024-03-07].
|
| [25] |
卫洪光. "多样化"引领初中体育教学新趋势[J]. 教育,2016(33):44-45.
|
| [26] |
黄闪,桂曌环,章舒心,等. 中小学生家长肥胖知信行与子女腹型肥胖发生风险的关联[J]. 中国学校卫生,2022,43(11):1613-1617. DOI:10.16835/j.cnki.1000-9817.2022.11.004.
|
| [27] |
|
| [28] |
严明明,罗淑颖,张耀东. 郑州市城区7~15岁儿童青少年中心性肥胖流行现况[J]. 中国儿童保健杂志,2022,30(9):1000-1004. DOI:10.11852/zgetbjzz2021-1786.
|
| [29] |
左娇蕾,张倩,刘爱玲,等. 北京市儿童青少年体成分的分析[J]. 中国健康教育,2011,27(6):415-418,433.
|
| [30] |
寇永妹. 唐山市3199名7~18岁儿童青少年肥胖现况调查[D]. 唐山:华北理工大学,2020.
|
| [31] |
房红芸,刘丹,赵丽云,等. 中国6~17岁儿童青少年腰围水平及中心性肥胖流行特征[J]. 中华流行病学杂志,2018,39(6):715-719. DOI:10.3760/cma.j.issn.0254-6450.2018.06.004.
|
| [32] |
|
| [33] |
|
| [34] |
刘瑛,刘翠,宁静,等. COVID-19疫情期间居家限制对学龄前超重/肥胖儿童生活方式的影响[J]. 广东医学,2020,41(16):1621-1625. DOI:10.13820/j.cnki.gdyx.20201776.
|
| [35] |
|
| [36] |
|
| [1] | ZENG Ling, XIE Leyun, YU Renhe, SONG Lin, ZENG Saizhen. Age-stratified Clinical Characteristics and Risk Factors for Lobar Pneumonia in Children with Mycoplasma Pneumoniae Pneumonia [J]. Chinese General Practice, 2026, 29(32): 4752-4758. |
| [2] | SU Die, ZHANG Yan, CHEN Xiaosong, HAN Yuxia, YAN Yongbin, DUAN Junya, CHEN Xinying, ZHAO Chenghao. Outcome Measures in Randomized Controlled Trials of Traditional Chinese Medicine for Refractory Mycoplasma Pneumoniae Pneumonia in Children [J]. Chinese General Practice, 2026, 29(31): 4609-4618. |
| [3] | YU Xinyan, ZHANG Fang, GU Zhile, WANG Yanfang, SU Peng, ZHANG Haicheng. Correlation between Fasting Plasma Glucose, Body Mass Index, and Waist Circumference among Community-dwelling Elderly Individuals [J]. Chinese General Practice, 2026, 29(28): 4132-4140. |
| [4] | ZHANG Ying, TANG Yijun, LIU Lidi, JIANG Lihua, JIA Yu, YANG Rong, YANG Ziyu, LIAO Xiaoyang. Management of Cardiovascular Metabolic Risks in Obese Children and Adolescents in China: Based on the 2024 Italian Society of Pediatric Endocrinology and Diabetes Position Paper on Cardiometabolic Risk in Children and Adolescents with Obesity [J]. Chinese General Practice, 2026, 29(27): 3879-3887. |
| [5] | ZHANG Xiaozhen, YANG Chengbo, JIN Qianhui, WANG Shuai, ZHOU Jihe. Comparative Study on the Effects of the Computer Assisted Rehabilitation Environment System and Conventional Rehabilitation on Improving Motor Function in Children with Global Developmental Delay [J]. Chinese General Practice, 2026, 29(27): 3938-3946. |
| [6] | WANG Rong, DI Yunzheng, XU Yaxin, XU Jun, YAO Ting, CHEN Yamei. Summary of the Best Evidence for Managing the Transition of Adolescent Inflammatory Bowel Disease Patients to Adult Medical Care [J]. Chinese General Practice, 2026, 29(25): 3704-3712. |
| [7] | Nanjing Drum Tower Hospital, the Affiliated Hospital of Nanjing University Medicine School, China Rehabilitation Science Institute, China Rehabilitation Research Center, Professional Committee on Integrative Nutrition Management, Jiangsu Integrative Medicine Research Society, Specialty Committee of Rehabilitation Engineering and Industry, China Association of Rehabilitation Medicine, Regenerative Repair and Anti-Aging Branch of Guangdong Association for the Development of Rehabilitation Medicine. Expert Consensus on Nutritional Rehabilitation Management of Adolescent Idiopathic Scoliosis [J]. Chinese General Practice, 2026, 29(24): 3393-3408. |
| [8] | ZHANG Boyu, XU Bo, LI Jianguo, YIN He, LUO Pengren, WANG Haojie, JIN Zhefeng, ZHU Liguo. Research on the Diagnostic Value of Rasterstereography for Angles Related to Adolescent Idiopathic Scoliosis [J]. Chinese General Practice, 2026, 29(24): 3434-3439. |
| [9] | GAO Min, DING Ying, HAN Shanshan, XU Yan, WU Ruihong, LI Yudi. Correlation of Selected Blood Biomarkers with 24-hour Urine Protein Excretion in 3 774 Pediatric Patients with IgA Vasculitis Nephritis [J]. Chinese General Practice, 2026, 29(23): 3320-3328. |
| [10] | Expert Group on Guidelines for the Assessment, Treatment, and Prevention of Childhood Obesity in China, Professional Committee on Obesity Control in Women and Children, China Maternal and Child Health Research Association. Guidelines for the Assessment, Treatment, and Prevention of Childhood Obesity in China (Second Edition) [J]. Chinese General Practice, 2026, 29(23): 3233-3252. |
| [11] | MA Linling, WANG Qiqiong, NI Xiaofeng, SHI Yuqing, WEN Yan, PAN Xiangcheng. Construction of a Scientific Popularization Framework for Antibacterial Drugs for Children Discharged from Hospital [J]. Chinese General Practice, 2026, 29(22): 3214-3219. |
| [12] | CHAI Zhihao, ZHANG Weisen, LUO Jiaoling, ZHU Feng, ZHU Tong, JIN Yali, PAN Jing, LU Yingjun, JIANG Chaoqiang. The Mediation Effect of Socioeconomic Status in Childhood Parental Literacy and Cognitive Function in Middle-aged and Older People: Based on Guangzhou Biobank Cohort Study [J]. Chinese General Practice, 2026, 29(21): 2959-2966. |
| [13] | YAN Wen, ZHANG Hanzhi, JIN Hua, QIAN Jie, YU Dehua. Study on the Diagnosis and Treatment Capacity for Depressive Disorders in Community Health Service Institutions in Shanghai [J]. Chinese General Practice, 2026, 29(20): 2790-2799. |
| [14] | HUANG Haili, LI Yuhong, YU Yang, GUO Ping, HAN Changzheng, LIU Ping. A Mixed Study of Fertility Intention and Its Influencing Factors among the Childbearing-age Women in Anhui Province [J]. Chinese General Practice, 2026, 29(20): 2887-2894. |
| [15] | WANG Rui, LUO Dan, YANG Cuicui, WENG Xinyi, WANG Yubing, XU Jingjing. Complex Network Analysis of Resilience in Adolescents with Type 1 Diabetes Mellitus Based on Multi-sourced Stigma [J]. Chinese General Practice, 2026, 29(16): 2264-2272. |
| Viewed | ||||||
|
Full text |
|
|||||
|
Abstract |
|
|||||
