
Chinese General Practice ›› 2022, Vol. 25 ›› Issue (16): 1942-1949.DOI: 10.12114/j.issn.1007-9572.2022.0045
Special Issue: 呼吸疾病文章合辑
• Original Research·Population Health • Previous Articles Next Articles
Received:2022-01-17
Revised:2022-04-21
Published:2022-06-05
Online:2022-05-05
Contact:
Guangqing ZHOU, Haiyan LI
About author:
通讯作者:
周光清, 李海燕
作者简介:基金资助:
Add to citation manager EndNote|Ris|BibTeX
URL: https://www.chinagp.net/EN/10.12114/j.issn.1007-9572.2022.0045
| 年份(年) | 患病率 | 死亡率 | DALYs率 | ||||||
|---|---|---|---|---|---|---|---|---|---|
| 男 | 女 | 总体 | 男 | 女 | 总体 | 男 | 女 | 总体 | |
| 1990 | 2 115.35 | 2 588.10 | 2 344.40 | 103.35 | 106.94 | 105.09 | 2 240.82 | 2 170.08 | 2 206.55 |
| 1991 | 2 156.32 | 2 636.89 | 2 388.88 | 104.12 | 107.54 | 105.78 | 2 240.63 | 2 174.07 | 2 208.42 |
| 1992 | 21 96.38 | 2 682.11 | 2 431.19 | 104.88 | 108.12 | 106.44 | 2 236.94 | 2 175.45 | 2 207.22 |
| 1993 | 2 235.23 | 2 724.94 | 2 471.77 | 105.14 | 108.27 | 106.65 | 2 223.03 | 2 168.12 | 2 196.50 |
| 1994 | 2 276.57 | 2 768.57 | 2 514.10 | 105.03 | 106.44 | 105.71 | 2 203.45 | 2 132.30 | 2 169.10 |
| 1995 | 2 316.70 | 2 812.08 | 2 555.82 | 105.28 | 103.22 | 104.28 | 2 191.19 | 2 066.37 | 2 130.94 |
| 1996 | 2 359.38 | 2 852.67 | 2 597.55 | 104.69 | 101.64 | 103.22 | 2 162.80 | 2 026.29 | 2 096.89 |
| 1997 | 2 401.21 | 2 882.54 | 2 633.73 | 103.38 | 98.87 | 101.20 | 2 122.79 | 1 967.25 | 2 047.65 |
| 1998 | 2 441.64 | 2 907.81 | 2 667.03 | 102.94 | 95.77 | 99.47 | 2 103.08 | 1 909.73 | 2 009.60 |
| 1999 | 2 484.93 | 2 933.72 | 2 702.14 | 102.71 | 95.45 | 99.20 | 2 091.82 | 1 894.37 | 1 996.25 |
| 2000 | 2 523.99 | 2 958.72 | 2 734.63 | 103.28 | 95.12 | 99.33 | 2 097.41 | 1 876.95 | 1 990.59 |
| 2001 | 2 562.02 | 2 987.09 | 2 768.22 | 102.25 | 92.74 | 97.64 | 2 065.48 | 1 829.58 | 1 951.05 |
| 2002 | 2 593.82 | 3 010.99 | 2 796.41 | 101.07 | 91.32 | 96.33 | 2 036.33 | 1 804.99 | 1 923.99 |
| 2003 | 2 619.92 | 3 031.32 | 2 819.89 | 99.54 | 90.01 | 94.90 | 2 003.20 | 1 781.53 | 1 895.45 |
| 2004 | 2 645.39 | 3 049.97 | 2 842.22 | 99.69 | 88.46 | 94.23 | 1 994.70 | 1 747.64 | 1 874.51 |
| 2005 | 2 665.43 | 3 064.01 | 2 859.48 | 97.60 | 84.97 | 91.46 | 1 811.85 | 1 938.76 | 1 678.11 |
| 2006 | 2 682.11 | 3 066.22 | 2 869.24 | 91.62 | 80.05 | 85.98 | 1 822.25 | 1 589.21 | 1 708.72 |
| 2007 | 2 688.32 | 3 049.42 | 2 864.34 | 88.50 | 76.28 | 82.54 | 1 752.14 | 1 516.16 | 1 637.11 |
| 2008 | 2 686.63 | 3 028.75 | 2 853.48 | 88.01 | 74.19 | 81.27 | 1 726.05 | 1 466.42 | 1 599.43 |
| 2009 | 2 687.15 | 3 022.96 | 2 851.01 | 88.17 | 72.82 | 80.68 | 1 708.05 | 1 429.76 | 1 572.25 |
| 2010 | 2 690.39 | 3 047.51 | 2 864.75 | 88.12 | 71.29 | 79.90 | 1 689.60 | 1 395.42 | 1 545.97 |
| 2011 | 2 703.01 | 3 111.97 | 2 902.79 | 86.26 | 69.03 | 77.84 | 1 650.52 | 1 358.96 | 1 508.09 |
| 2012 | 2 713.18 | 3 196.18 | 2 949.25 | 84.46 | 65.46 | 75.18 | 1 614.66 | 1 309.26 | 1 465.39 |
| 2013 | 2 719.78 | 3 291.78 | 2 999.51 | 82.37 | 63.22 | 73.01 | 1 571.04 | 1 276.73 | 1 427.11 |
| 2014 | 2 729.63 | 3 390.67 | 3 053.09 | 80.95 | 61.76 | 71.56 | 1 539.28 | 1 256.75 | 1 401.04 |
| 2015 | 2 727.91 | 3 469.86 | 3 091.15 | 80.03 | 60.17 | 70.30 | 1 514.74 | 1 236.33 | 1 378.44 |
| 2016 | 2 672.59 | 3 430.31 | 3 043.71 | 80.41 | 60.28 | 70.56 | 1 507.87 | 1 228.31 | 1 370.94 |
| 2017 | 2 639.44 | 3 390.06 | 3 007.24 | 79.80 | 60.42 | 70.31 | 1 490.14 | 1 220.84 | 1 358.18 |
| 2018 | 2 691.60 | 3 478.29 | 3 077.23 | 80.17 | 61.57 | 71.05 | 1 494.11 | 1 240.29 | 1 369.69 |
| 2019 | 2 768.81 | 3 597.85 | 3 175.37 | 82.25 | 63.27 | 72.94 | 1 523.84 | 1 272.75 | 1 400.71 |
| 变化率(%) | 30.89 | 39.01 | 35.45 | -20.42 | -40.84 | -30.59 | -32.00 | -41.35 | -36.52 |
| AAPC(95%CI)(%) | 0.92(0.85,0.98)a | 1.13(1.06,1.19)a | 1.04(0.97,1.11)a | -0.83(-1.41,0.51)a | -1.83(-2.17,-1.50)a | -1.29(-1.67,-0.97)a | -1.37(-1.63,-1.11)a | -1.86(-2.11,-1.62)a | -1.56(-1.86,-1.26)a |
Table 1 Changes in the burden of COPD in China,1990—2019
| 年份(年) | 患病率 | 死亡率 | DALYs率 | ||||||
|---|---|---|---|---|---|---|---|---|---|
| 男 | 女 | 总体 | 男 | 女 | 总体 | 男 | 女 | 总体 | |
| 1990 | 2 115.35 | 2 588.10 | 2 344.40 | 103.35 | 106.94 | 105.09 | 2 240.82 | 2 170.08 | 2 206.55 |
| 1991 | 2 156.32 | 2 636.89 | 2 388.88 | 104.12 | 107.54 | 105.78 | 2 240.63 | 2 174.07 | 2 208.42 |
| 1992 | 21 96.38 | 2 682.11 | 2 431.19 | 104.88 | 108.12 | 106.44 | 2 236.94 | 2 175.45 | 2 207.22 |
| 1993 | 2 235.23 | 2 724.94 | 2 471.77 | 105.14 | 108.27 | 106.65 | 2 223.03 | 2 168.12 | 2 196.50 |
| 1994 | 2 276.57 | 2 768.57 | 2 514.10 | 105.03 | 106.44 | 105.71 | 2 203.45 | 2 132.30 | 2 169.10 |
| 1995 | 2 316.70 | 2 812.08 | 2 555.82 | 105.28 | 103.22 | 104.28 | 2 191.19 | 2 066.37 | 2 130.94 |
| 1996 | 2 359.38 | 2 852.67 | 2 597.55 | 104.69 | 101.64 | 103.22 | 2 162.80 | 2 026.29 | 2 096.89 |
| 1997 | 2 401.21 | 2 882.54 | 2 633.73 | 103.38 | 98.87 | 101.20 | 2 122.79 | 1 967.25 | 2 047.65 |
| 1998 | 2 441.64 | 2 907.81 | 2 667.03 | 102.94 | 95.77 | 99.47 | 2 103.08 | 1 909.73 | 2 009.60 |
| 1999 | 2 484.93 | 2 933.72 | 2 702.14 | 102.71 | 95.45 | 99.20 | 2 091.82 | 1 894.37 | 1 996.25 |
| 2000 | 2 523.99 | 2 958.72 | 2 734.63 | 103.28 | 95.12 | 99.33 | 2 097.41 | 1 876.95 | 1 990.59 |
| 2001 | 2 562.02 | 2 987.09 | 2 768.22 | 102.25 | 92.74 | 97.64 | 2 065.48 | 1 829.58 | 1 951.05 |
| 2002 | 2 593.82 | 3 010.99 | 2 796.41 | 101.07 | 91.32 | 96.33 | 2 036.33 | 1 804.99 | 1 923.99 |
| 2003 | 2 619.92 | 3 031.32 | 2 819.89 | 99.54 | 90.01 | 94.90 | 2 003.20 | 1 781.53 | 1 895.45 |
| 2004 | 2 645.39 | 3 049.97 | 2 842.22 | 99.69 | 88.46 | 94.23 | 1 994.70 | 1 747.64 | 1 874.51 |
| 2005 | 2 665.43 | 3 064.01 | 2 859.48 | 97.60 | 84.97 | 91.46 | 1 811.85 | 1 938.76 | 1 678.11 |
| 2006 | 2 682.11 | 3 066.22 | 2 869.24 | 91.62 | 80.05 | 85.98 | 1 822.25 | 1 589.21 | 1 708.72 |
| 2007 | 2 688.32 | 3 049.42 | 2 864.34 | 88.50 | 76.28 | 82.54 | 1 752.14 | 1 516.16 | 1 637.11 |
| 2008 | 2 686.63 | 3 028.75 | 2 853.48 | 88.01 | 74.19 | 81.27 | 1 726.05 | 1 466.42 | 1 599.43 |
| 2009 | 2 687.15 | 3 022.96 | 2 851.01 | 88.17 | 72.82 | 80.68 | 1 708.05 | 1 429.76 | 1 572.25 |
| 2010 | 2 690.39 | 3 047.51 | 2 864.75 | 88.12 | 71.29 | 79.90 | 1 689.60 | 1 395.42 | 1 545.97 |
| 2011 | 2 703.01 | 3 111.97 | 2 902.79 | 86.26 | 69.03 | 77.84 | 1 650.52 | 1 358.96 | 1 508.09 |
| 2012 | 2 713.18 | 3 196.18 | 2 949.25 | 84.46 | 65.46 | 75.18 | 1 614.66 | 1 309.26 | 1 465.39 |
| 2013 | 2 719.78 | 3 291.78 | 2 999.51 | 82.37 | 63.22 | 73.01 | 1 571.04 | 1 276.73 | 1 427.11 |
| 2014 | 2 729.63 | 3 390.67 | 3 053.09 | 80.95 | 61.76 | 71.56 | 1 539.28 | 1 256.75 | 1 401.04 |
| 2015 | 2 727.91 | 3 469.86 | 3 091.15 | 80.03 | 60.17 | 70.30 | 1 514.74 | 1 236.33 | 1 378.44 |
| 2016 | 2 672.59 | 3 430.31 | 3 043.71 | 80.41 | 60.28 | 70.56 | 1 507.87 | 1 228.31 | 1 370.94 |
| 2017 | 2 639.44 | 3 390.06 | 3 007.24 | 79.80 | 60.42 | 70.31 | 1 490.14 | 1 220.84 | 1 358.18 |
| 2018 | 2 691.60 | 3 478.29 | 3 077.23 | 80.17 | 61.57 | 71.05 | 1 494.11 | 1 240.29 | 1 369.69 |
| 2019 | 2 768.81 | 3 597.85 | 3 175.37 | 82.25 | 63.27 | 72.94 | 1 523.84 | 1 272.75 | 1 400.71 |
| 变化率(%) | 30.89 | 39.01 | 35.45 | -20.42 | -40.84 | -30.59 | -32.00 | -41.35 | -36.52 |
| AAPC(95%CI)(%) | 0.92(0.85,0.98)a | 1.13(1.06,1.19)a | 1.04(0.97,1.11)a | -0.83(-1.41,0.51)a | -1.83(-2.17,-1.50)a | -1.29(-1.67,-0.97)a | -1.37(-1.63,-1.11)a | -1.86(-2.11,-1.62)a | -1.56(-1.86,-1.26)a |
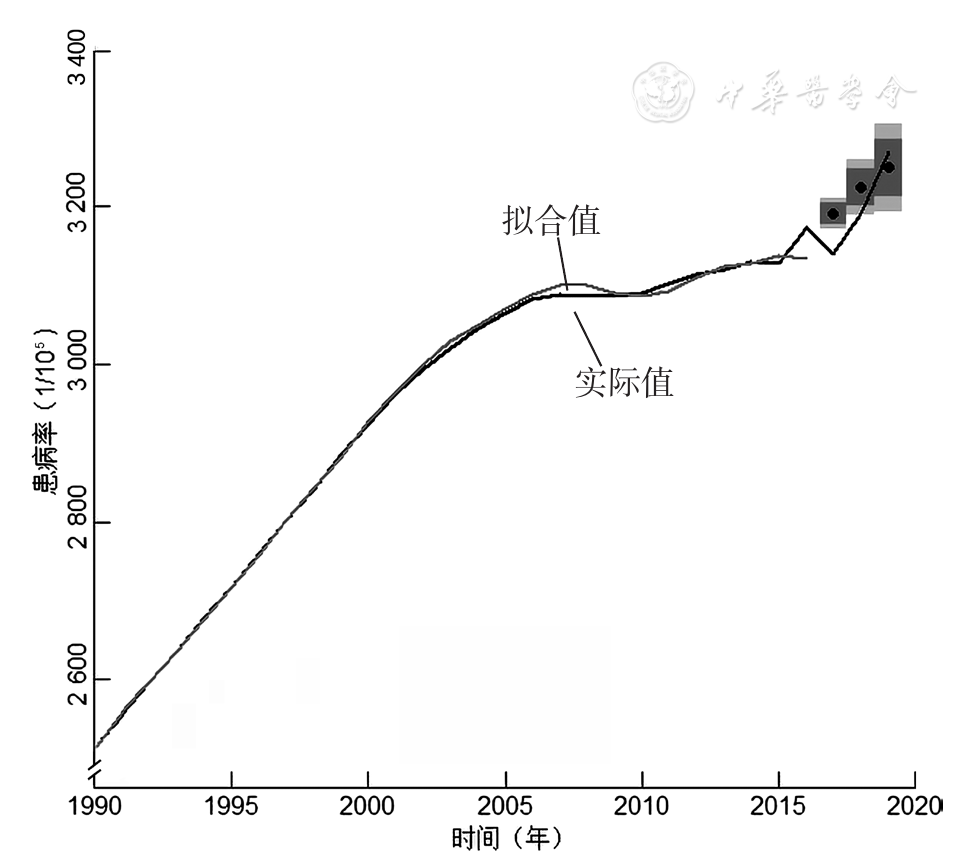
Figure 1 Goodness of fit and prediction performance of the ARIMA(1,2,0)COPD prevalence prediction model
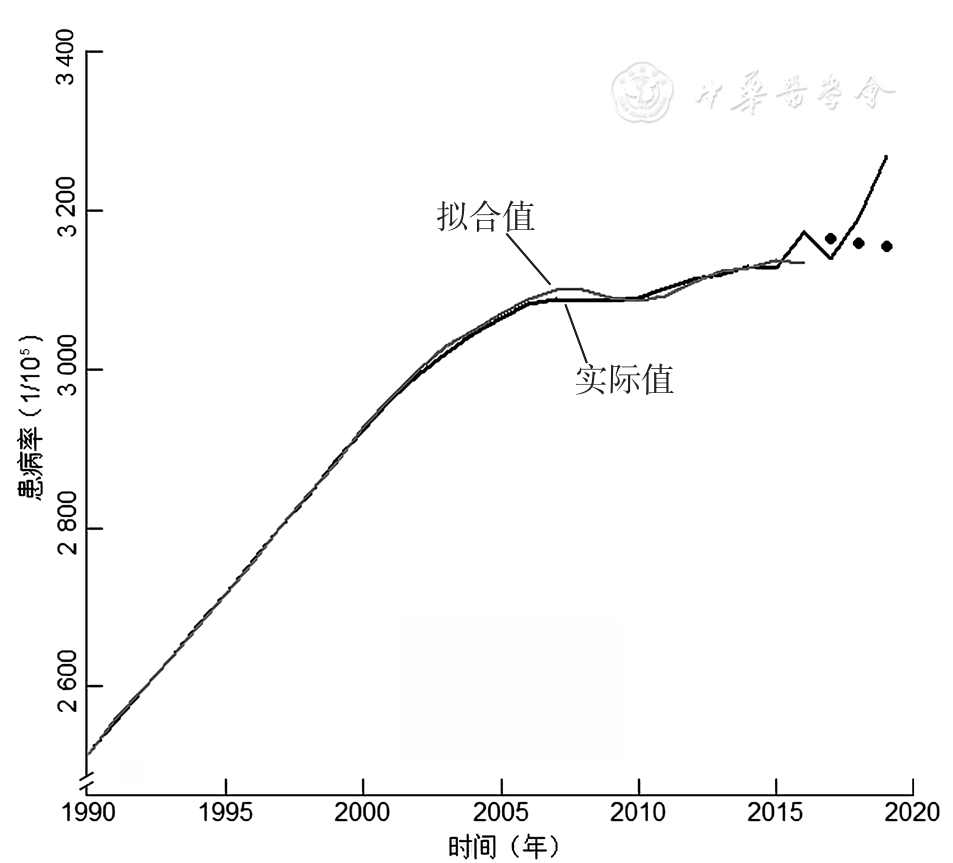
Figure 2 Goodness of fit and prediction performance of the NNAR(1,1)COPD prevalence prediction model
| 模型 | 训练集 | 测试集 | |||||
|---|---|---|---|---|---|---|---|
| MAPE(%) | MAE | RMSE | MAPE(%) | MAE | RMSE | ||
| 患病率 | |||||||
| ARIMA | 0.284 | 8.048 | 13.399 | 0.334 | 9.699 | 17.074 | |
| NNAR | 0.506 | 14.621 | 19.841 | 0.553 | 19.753 | 27.949 | |
| 死亡率 | |||||||
| ARIMA | 0.810 | 0.730 | 0.965 | 0.872 | 0.748 | 1.009 | |
| NNAR | 1.033 | 0.921 | 1.107 | 1.088 | 0.943 | 1.126 | |
| DALYs率 | |||||||
| ARIMA | 0.622 | 11.305 | 15.321 | 0.726 | 12.528 | 17.003 | |
| NNAR | 0.823 | 14.982 | 18.240 | 0.914 | 15.886 | 18.581 | |
Table 2 Comparison of the goodness of fit and performance in predicting the burden of COPD in China between ARIMA and NNAR-based models
| 模型 | 训练集 | 测试集 | |||||
|---|---|---|---|---|---|---|---|
| MAPE(%) | MAE | RMSE | MAPE(%) | MAE | RMSE | ||
| 患病率 | |||||||
| ARIMA | 0.284 | 8.048 | 13.399 | 0.334 | 9.699 | 17.074 | |
| NNAR | 0.506 | 14.621 | 19.841 | 0.553 | 19.753 | 27.949 | |
| 死亡率 | |||||||
| ARIMA | 0.810 | 0.730 | 0.965 | 0.872 | 0.748 | 1.009 | |
| NNAR | 1.033 | 0.921 | 1.107 | 1.088 | 0.943 | 1.126 | |
| DALYs率 | |||||||
| ARIMA | 0.622 | 11.305 | 15.321 | 0.726 | 12.528 | 17.003 | |
| NNAR | 0.823 | 14.982 | 18.240 | 0.914 | 15.886 | 18.581 | |
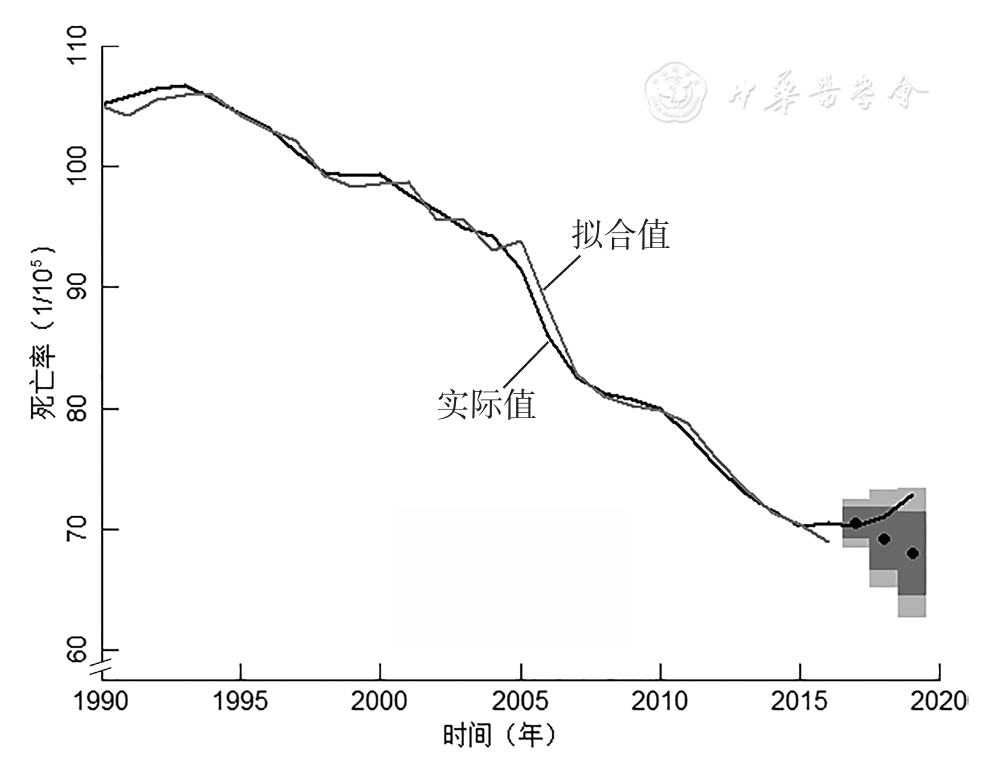
Figure 3 Goodness of fit and prediction performance of the ARIMA(0,1,1)COPD mortality prediction model
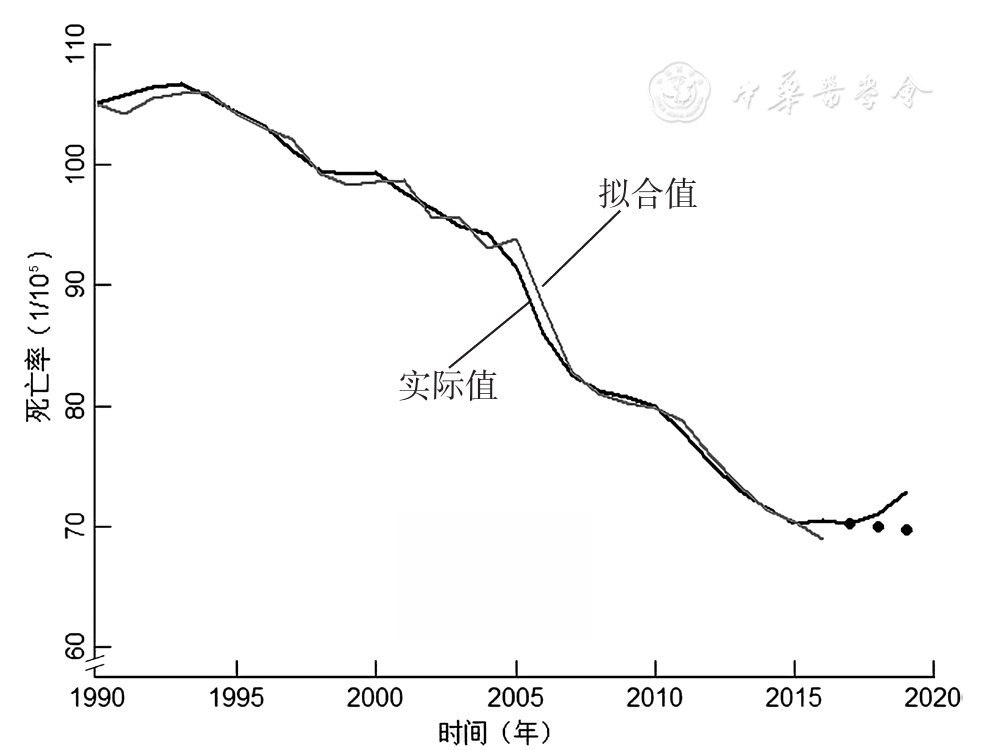
Figure 4 Goodness of fit and prediction performance of the NNAR(1,1)COPD mortality prediction model
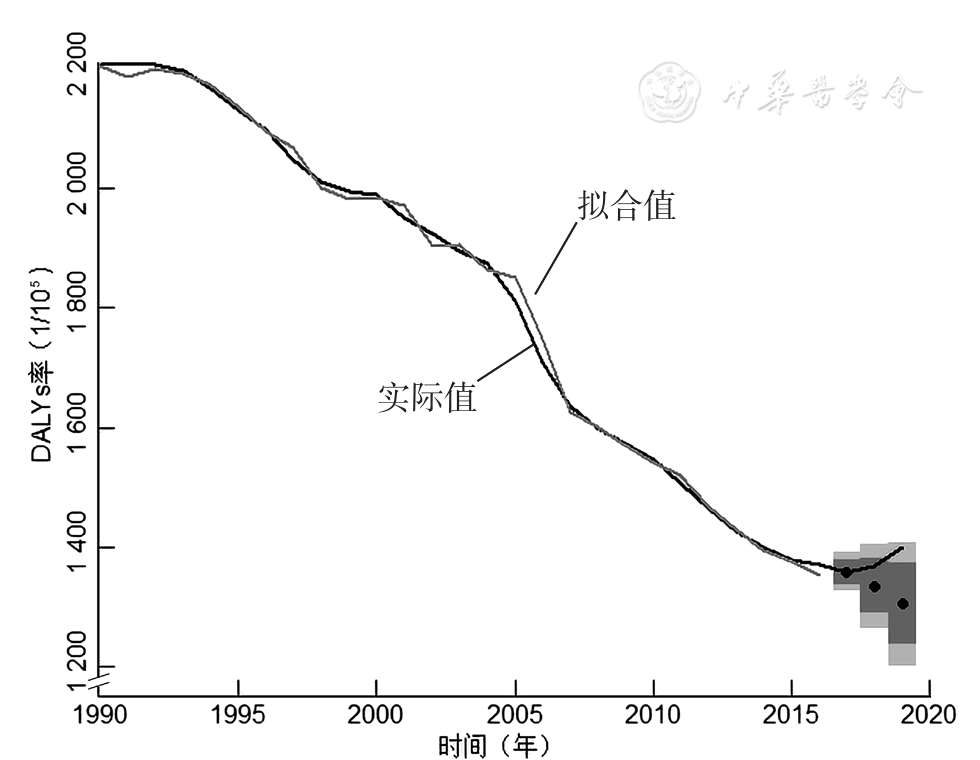
Figure 5 Goodness of fit and prediction performance of ARIMA(0,1,2)DALYs rate prediction model for COPD
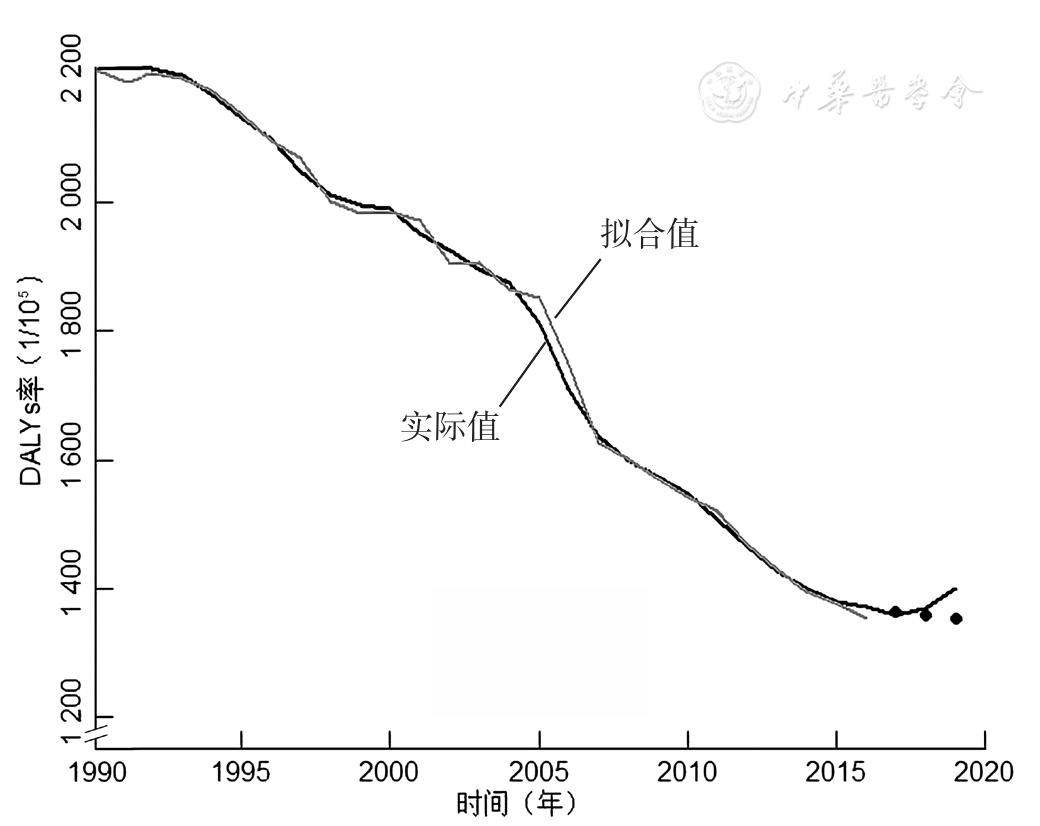
Figure 6 Goodness of fit and prediction performance of NNAR(1,1)DALYs rate prediction model for COPD
| 年份(年) | 患病率(95%CI) | 死亡率(95%CI) | DALYs率(95%CI) |
|---|---|---|---|
| 2020 | 3 229.77(3 193.82,3 265.72) | 74.50(72.41,76.58) | 1 429.56(1 394.42,1 464.68) |
| 2021 | 3 262.44(3 169.88,3 355.01) | 75.49(70.62,80.34) | 1 452.07(1 368.84,1 535.28) |
| 2022 | 3 292.38(3 152.05,3 432.70) | 76.11(68.50,83.70) | 1 469.64(1 334.16,1 605.11) |
| 2023 | 3 322.31(3 146.77,3 497.85) | 76.50(66.32,86.67) | 1 483.35(1 294.57,1 672.12) |
| 2024 | 3 352.25(3 147.45,3 557.03) | 76.75(64.19,89.29) | 1 494.05(1 252.54,1 735.55) |
Table 3 ARIMA model-based prediction of COPD burden in China from 2020 to 2025
| 年份(年) | 患病率(95%CI) | 死亡率(95%CI) | DALYs率(95%CI) |
|---|---|---|---|
| 2020 | 3 229.77(3 193.82,3 265.72) | 74.50(72.41,76.58) | 1 429.56(1 394.42,1 464.68) |
| 2021 | 3 262.44(3 169.88,3 355.01) | 75.49(70.62,80.34) | 1 452.07(1 368.84,1 535.28) |
| 2022 | 3 292.38(3 152.05,3 432.70) | 76.11(68.50,83.70) | 1 469.64(1 334.16,1 605.11) |
| 2023 | 3 322.31(3 146.77,3 497.85) | 76.50(66.32,86.67) | 1 483.35(1 294.57,1 672.12) |
| 2024 | 3 352.25(3 147.45,3 557.03) | 76.75(64.19,89.29) | 1 494.05(1 252.54,1 735.55) |
| [1] |
李凡,孙惠芬,段静,等. 从GOLD指南的演变看慢性阻塞性肺疾病的防治[J]. 中国全科医学,2019,22(27):3275-3280. DOI:10.12114/j.issn.1007-9572.2019.00.383.
|
| [2] |
|
| [3] |
易方莲,易松涛. 慢性阻塞性肺疾病流行病学调查和防控措施研究[J]. 解放军预防医学杂志,2018,36(2):171-173.
|
| [4] |
|
| [5] |
王晓娟,方向阳. 慢性阻塞性肺疾病全球倡议2019:慢性阻塞性肺疾病诊断、治疗与预防全球策略解读[J]. 中国全科医学,2019,22(18):2141-2149. DOI:10.12114/j.issn.1007-9572.2019.00.064.
|
| [6] |
俞浩,武鸣,罗鹏飞,等. 1990—2017年江苏省居民慢性阻塞性肺疾病的疾病负担分析[J]. 疾病监测,2020,35(6):478-482.
|
| [7] |
|
| [8] |
陶凤然,樊娜,蒋云雯,等. 1997—2017年中国人群慢性阻塞性肺病疾病负担趋势分析[J]. 中国慢性病预防与控制,2020,28(1):3-9. DOI:10.16386/j.cjpccd.issn.1004-6194.2020.01.002.
|
| [9] |
孙娜,许小珊,冯佳宁,等. ARIMA与GM(1,1)模型对我国肺结核年发病人数预测情况的比较[J]. 中国卫生统计,2019,36(1):71-74.
|
| [10] |
张欣,刘振球,袁黄波,等. 神经网络自回归模型在丙肝发病趋势和预测研究中的应用[J]. 中国卫生统计,2020,37(4):524-526.
|
| [11] |
马倩倩,何贤英,崔芳芳,等. 基于ARIMA与NNAR模型的中国食管癌疾病负担预测[J]. 中华疾病控制杂志,2021,25(9):1048-1053. DOI:10.16462/j.cnki.zhjbkz.2021.09.010.
|
| [12] |
GBD 2019 Demographics Collaborators. Global age-sex-specific fertility,mortality,healthy life expectancy(HALE),and population estimates in 204 countries and territories,1950—2019:a comprehensive demographic analysis for the Global Burden of Disease Study 2019[J]. Lancet,2020,396(10258):1160-1203. DOI:10.1016/S0140-6736(20)30977-6.
|
| [13] |
GBD 2019 Universal Health Coverage Collaborators. Measuring universal health coverage based on an index of effective coverage of health services in 204 countries and territories,1990—2019:a systematic analysis for the Global Burden of Disease Study 2019[J]. Lancet,2020,396(10258):1250-1284. DOI:10.1016/S0140-6736(20)30750-9.
|
| [14] |
|
| [15] |
GBD 2017 Risk Factor Collaborators. Global,regional,and national comparative risk assessment of 84 behavioral,environmental and occupational,and metabolic risks or clusters of risks for 195 countries and territories,1990—2017:a systematic analysis for the Global Burden of Disease Study 2017[J]. Lancet,2018,392(10159):1923-1994. DOI:10.1016/S0140-6736(18)32225-6.
|
| [16] |
GBD 2019 Diseases and Injuries Collaborators. Global burden of 369 diseases and injuries in 204 countries and territories,1990—2019:a systematic analysis for the Global Burden of Disease Study 2019[J]. Lancet,2020,396(10258):1204-1222. DOI:10.1016/S0140-6736(20)30925-9.
|
| [17] |
秦国双,温昊于,宇传华. 中国COPD的患病发病及YLD现状及趋势[J]. 公共卫生与预防医学,2019,30(2):4-8.DOI:10.3969/j.issn.1006-2483.2019.02.002.
|
| [18] |
|
| [19] |
|
| [20] |
徐杰茹,陈磊,王冕,等. 1990—2019年中国女性卵巢癌发病趋势分析与预测[J]. 现代预防医学,2021,48(19):3457-3460.
|
| [21] |
周杰,任光辉,贺宏斌,等. 指数平滑模型与ARIMA模型在湖南省血吸虫病流行趋势预测中的应用[J]. 中国血吸虫病防治杂志,2020,32(3):236-241. DOI:10.16250/j.32.1374.2020021.
|
| [22] |
梁达,商越,王兆芬,等. 青海省肺结核发病与气象因素的时间序列分析[J]. 中华疾病控制杂志,2021,25(10):1186-1193. DOI:10.16462/j.cnki.zhjbkz.2021.10.013.
|
| [23] |
吴伟,安淑一,郭军巧,等. 非线性自回归神经网络在肾综合征出血热流行趋势预测中的应用[J]. 中华流行病学杂志,2015,36(12):1394-1396.
|
| [24] |
李环,孙素芬,罗长寿. 基于NARX神经网络的粮食产量预测模型[J]. 江苏农业科学,2020,48(22):228-232. DOI:10.15889/j.issn.1002-1302.2020.22.043.
|
| [1] | JIA Gaopeng, CHEN Qiuyu. Construction and Validation of a Risk Prediction Model for Recurrent Angina after Percutaneous Coronary Intervention in Elderly Patients with Acute ST-segment Elevation Myocardial Infarction: Based on CYP2C19-related Genetic Testing [J]. Chinese General Practice, 2025, 28(30): 3779-3786. |
| [2] | LI Ling, LI Yaping, QIAN Shixing, NIE Jing, LU Chunhua, LI Xia. Research on Influencing Factors and Risk Prediction of Cognitive Function in Community-dwelling Middle-aged and Elderly People [J]. Chinese General Practice, 2025, 28(30): 3773-3778. |
| [3] | JIANG Qixia, ZHU Yuling, ZHU Wenjun, LI Xiuyun, XIE Haoting, WANG Huajun, YUAN Siming. Accuracy and Cut-off Values of "Five Points" Flap Temperature and "Single Point" Flap Temperature in Predicting Vascular Crisis [J]. Chinese General Practice, 2025, 28(24): 3013-3018. |
| [4] | LIU Yinyin, SUI Hongping, LI Tingting, JIANG Tongtong, SHI Tieying, XIA Yunlong. Advances in Risk Prediction Models for Cardiotoxicity Associated with Breast Cancer Treatment [J]. Chinese General Practice, 2025, 28(24): 3072-3078. |
| [5] | WANG Rupeng, NAN Jing, HU Yiran, YANG Shenghua, JIN Zening. Predictive Value of the Triglyceride-Glucose Body Mass Index for Slow Flow/No-reflow Phenomenon in Patients with Type 2 Diabetes Mellitus and Acute Myocardial Infarction Undergoing Emergency Percutaneous Coronary Intervention [J]. Chinese General Practice, 2025, 28(24): 2985-2992. |
| [6] | ZHOU Qian, WU Xiaomin, WANG Baohua, YAN Ruohan, YU Miao, WU Jing. Study on Nomogram Prediction Model for Risk of Gastric Cancer [J]. Chinese General Practice, 2025, 28(23): 2870-2877. |
| [7] | ZHAO Xiaoqing, GUO Tongtong, ZHANG Xinyi, LI Linhong, ZHANG Ya, JI Lihong, DONG Zhiwei, GAO Qianqian, CAI Weiqing, ZHENG Wengui, JING Qi. Construction and Validation of a Risk Prediction Model for Cognitive Impairment in Community-dwelling Older Adults [J]. Chinese General Practice, 2025, 28(22): 2776-2783. |
| [8] | ZHANG Bingqing, WANG Zhongkai, WU Changyong, SUN Huang, LI Ruijie, LIU Wenjie, LUO Yihua, ZHENG Lihui, PENG Yunzhu. Changes and Trend Prediction in the Global Burden of Congenital Heart Defects, 1990-2021 [J]. Chinese General Practice, 2025, 28(18): 2253-2261. |
| [9] | LIU Feiran, CHEN Minghuang, ZHAO Shuaihong, BAI Wenpei. Application of Random Forest Algorithm in Pregnancy Prediction after Fallopian Tube Recanalization [J]. Chinese General Practice, 2025, 28(11): 1361-1366. |
| [10] | CHEN Shenglan, ZHENG Yongtao, HU Wangcheng, NI Zuowei, XIA Bing, YE Chunmei, DU Chixin, CHEN Xiaodan. Risk Prediction Model for High Myopia in Primary and Secondary School Students: Based on Nested Case-control Study [J]. Chinese General Practice, 2025, 28(09): 1115-1121. |
| [11] | WANG Shihong, DENG Xingyu, CAO Rudai, LING Yao, HUANG Cuiyi, OUYANG Dong, DING Yuanlin, YU Haibing. The Trend Prediction of Five Subtypes of Chronic Kidney Disease in China from 2020 to 2040 [J]. Chinese General Practice, 2025, 28(07): 814-823. |
| [12] | SHI Xiaotian, WANG Shan, YANG Huayu, YANG Yifan, LI Xu, DOU Guoze, MA Qing. A Predictive Nomogram for the Risk of Frailty/Pre-frailty on Inflammatory Biomarkers in the Elderly [J]. Chinese General Practice, 2025, 28(05): 587-593. |
| [13] | DU Huijie, LIU Xingyu, XU Minghuan, YANG Xuezhi, ZHANG Huiqin, MO Jiali, LU Yi, KUANG Jie. Advances in the Prognostic Prediction of Acute Ischemic Stroke: Using Machine Learning Predictive Models as an Example [J]. Chinese General Practice, 2025, 28(05): 554-560. |
| [14] | YUE Haitao, HE Chanchan, CHENG Yuyou, ZHANG Sencheng, WU You, MA Jing. Coronary Heart Disease Risk Prediction Model Based on Machine Learning [J]. Chinese General Practice, 2025, 28(04): 499-509. |
| [15] | LAI Fengxia, WANG Shihong, ZHAO Le, HUANG Ruixian, YANG Zihua, ZHANG Zhiyi, KONG Danli, DING Yuanlin. Analysis and Prediction of Incidence and Mortality Trends of Three Enteric Infectious Diseases in China from 1990 to 2019 [J]. Chinese General Practice, 2025, 28(03): 313-319. |
| Viewed | ||||||
|
Full text |
|
|||||
|
Abstract |
|
|||||