
Chinese General Practice ›› 2022, Vol. 25 ›› Issue (06): 675-681.DOI: 10.12114/j.issn.1007-9572.2021.02.118
Special Issue: 内分泌代谢性疾病最新文章合辑
• Article • Previous Articles Next Articles
A Predictive Nomogram for the Risk of Peripheral Neuropathy in Type 2 Diabetes
1.School of Public Health,Xinjiang Medical University,Urumqi 830011,China
2.Department of Medical Engineering and Technology,Xinjiang Medical University,Urumqi 830011,China
3.The First Affiliated Hospital of Xinjiang Medical University,Urumqi 830054,China
4.School of Continuing Education,Xinjiang Medical University,Urumqi 830011,China
*Corresponding author:WANG Kai,Professor;E-mail:wangkaimath@sina.com
Received:2021-08-20
Revised:2021-11-10
Published:2022-02-20
Online:2021-12-31
通讯作者:
王凯
基金资助:CLC Number:
LI Yongsheng, ZHANG Xueliang, LI Cheng, FENG Zhiwei, WANG Kai.
A Predictive Nomogram for the Risk of Peripheral Neuropathy in Type 2 Diabetes [J]. Chinese General Practice, 2022, 25(06): 675-681.
Add to citation manager EndNote|Ris|BibTeX
URL: https://www.chinagp.net/EN/10.12114/j.issn.1007-9572.2021.02.118
| 一般资料 | 无DPN(n=8 887) | DPN(n=6 133) | χ2(t)值 | P值 | |
|---|---|---|---|---|---|
| 性别〔n(%)〕 | 140.68a | <0.001 | |||
| 男 | 5 886(66.2) | 3 476(56.7) | |||
| 女 | 3 001(33.8) | 2 657(43.3) | |||
年龄( ±s,岁) ±s,岁) | 54.1±12.6 | 60.3±10.9 | 32.39 | <0.001 | |
| DR〔n(%)〕 | 4 633.00a | <0.001 | |||
| 无 | 7 415(83.4) | 1 735(28.3) | |||
| 有 | 1 472(16.6) | 4 398(71.7) | |||
糖尿病病程( ±s,年) ±s,年) | 5.80±6.04 | 10.88±7.10 | 46.18 | <0.001 | |
WBC( ±s,×109/L) ±s,×109/L) | 7.30±3.23 | 6.83±2.55 | -9.81 | <0.001 | |
嗜酸粒细胞分数( ±s) ±s) | 0.163±0.221 | 0.166±0.149 | 0.95 | 0.375 | |
淋巴细胞计数( ±s,×109/L) ±s,×109/L) | 2.21±0.80 | 2.17±0.87 | -2.68 | 0.006 | |
HbA1c( ±s,%) ±s,%) | 8.42±2.13 | 9.13±2.14 | 20.04 | <0.001 | |
GSP( ±s,mmol/L) ±s,mmol/L) | 2.80±0.83 | 2.97±0.82 | 12.62 | <0.001 | |
TC( ±s,mmol/L) ±s,mmol/L) | 4.45±1.21 | 4.42±1.23 | -1.58 | 0.113 | |
TG( ±s,mmol/L) ±s,mmol/L) | 2.51±2.53 | 2.20±2.12 | -8.12 | <0.001 | |
HDL( ±s,mmol/L) ±s,mmol/L) | 1.10±0.35 | 1.01±0.32 | 10.36 | <0.001 | |
LDL( ±s,mmol/L) ±s,mmol/L) | 2.76±0.90 | 2.78±0.90 | 1.33 | 0.182 | |
ApoA1( ±s,g/L) ±s,g/L) | 1.17±0.26 | 1.21±0.25 | 10.17 | <0.001 | |
ApoB( ±s,g/L) ±s,g/L) | 0.94±0.29 | 0.93±0.28 | -2.07 | 0.039 | |
Table 1 Comparison of general information between the non-DPN and DPN patients
| 一般资料 | 无DPN(n=8 887) | DPN(n=6 133) | χ2(t)值 | P值 | |
|---|---|---|---|---|---|
| 性别〔n(%)〕 | 140.68a | <0.001 | |||
| 男 | 5 886(66.2) | 3 476(56.7) | |||
| 女 | 3 001(33.8) | 2 657(43.3) | |||
| 年龄(±s,岁) | 54.1±12.6 | 60.3±10.9 | 32.39 | <0.001 | |
| DR〔n(%)〕 | 4 633.00a | <0.001 | |||
| 无 | 7 415(83.4) | 1 735(28.3) | |||
| 有 | 1 472(16.6) | 4 398(71.7) | |||
| 糖尿病病程(±s,年) | 5.80±6.04 | 10.88±7.10 | 46.18 | <0.001 | |
| WBC(±s,×109/L) | 7.30±3.23 | 6.83±2.55 | -9.81 | <0.001 | |
| 嗜酸粒细胞分数(±s) | 0.163±0.221 | 0.166±0.149 | 0.95 | 0.375 | |
| 淋巴细胞计数(±s,×109/L) | 2.21±0.80 | 2.17±0.87 | -2.68 | 0.006 | |
| HbA1c(±s,%) | 8.42±2.13 | 9.13±2.14 | 20.04 | <0.001 | |
| GSP(±s,mmol/L) | 2.80±0.83 | 2.97±0.82 | 12.62 | <0.001 | |
| TC(±s,mmol/L) | 4.45±1.21 | 4.42±1.23 | -1.58 | 0.113 | |
| TG(±s,mmol/L) | 2.51±2.53 | 2.20±2.12 | -8.12 | <0.001 | |
| HDL(±s,mmol/L) | 1.10±0.35 | 1.01±0.32 | 10.36 | <0.001 | |
| LDL(±s,mmol/L) | 2.76±0.90 | 2.78±0.90 | 1.33 | 0.182 | |
| ApoA1(±s,g/L) | 1.17±0.26 | 1.21±0.25 | 10.17 | <0.001 | |
| ApoB(±s,g/L) | 0.94±0.29 | 0.93±0.28 | -2.07 | 0.039 | |
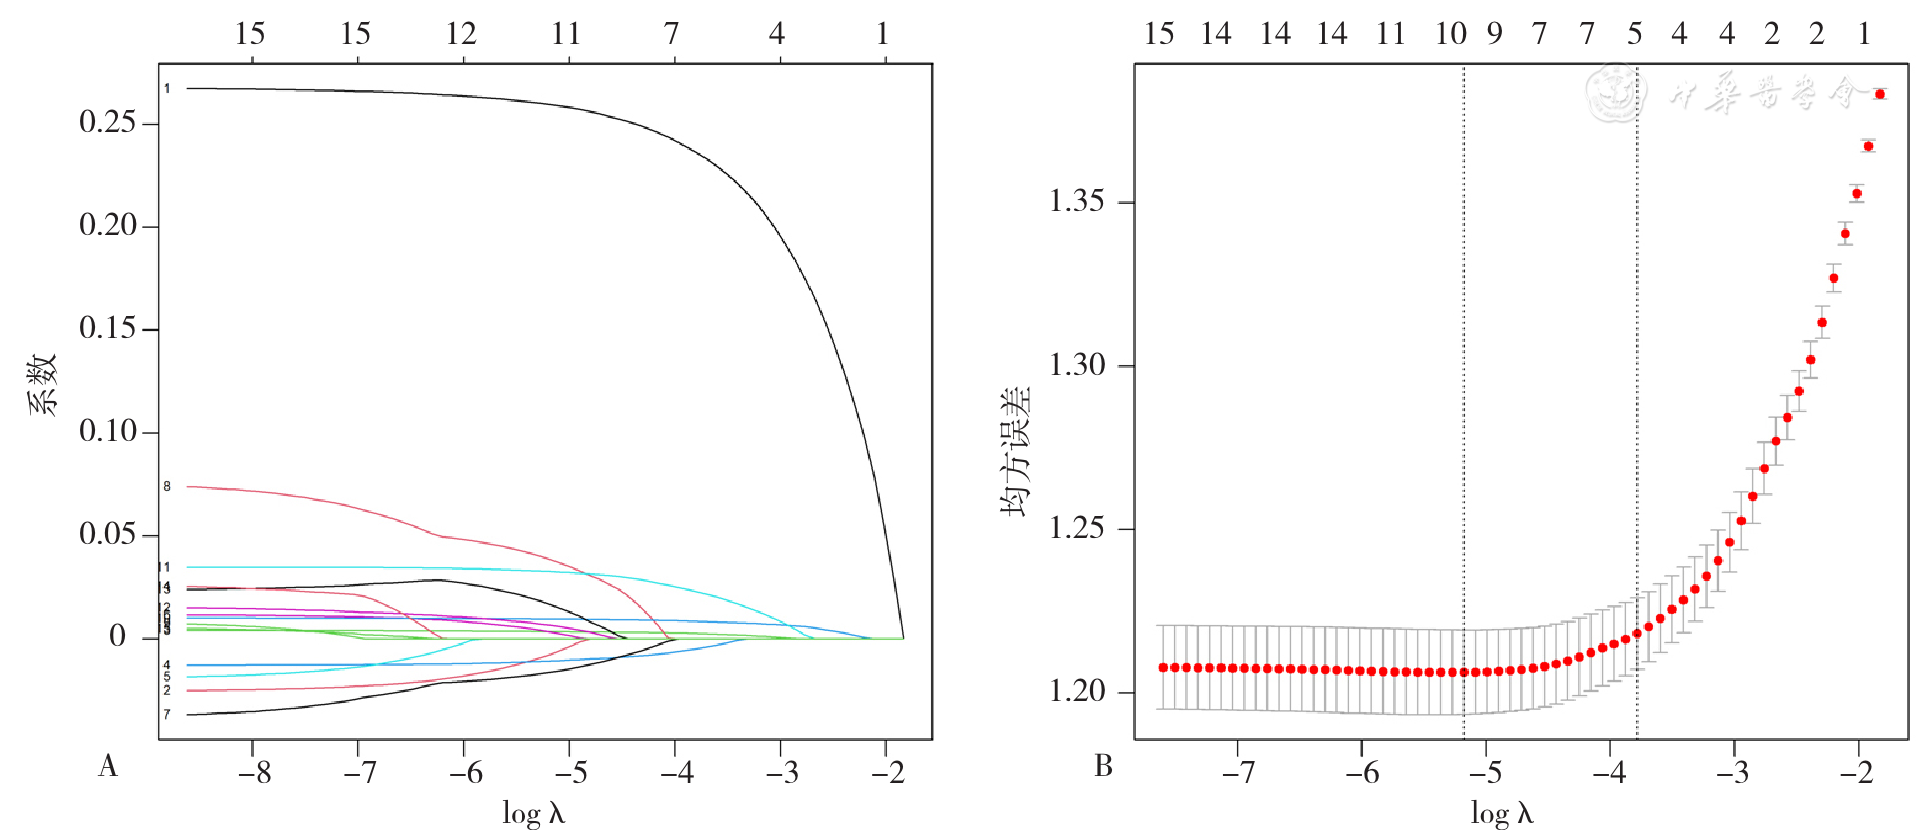
Figure 1 Selection of potential predictors of diabetic peripheral neuropathy in type 2 diabetics by the least absolute shrinkage and selection operator(Lasso) regression
| 项目 | β | SE | Wald χ2值 | P值 | OR值 | 95%CI |
|---|---|---|---|---|---|---|
| 常量 | -6.552 | 0.199 | -32.853 | <0.001 | - | - |
| 年龄 | 0.034 | 0.002 | 14.694 | <0.001 | 1.034 | (1.031,1.039) |
| DR | 2.475 | 0.051 | 48.545 | <0.001 | 11.881 | (10.756,13.135) |
| 糖尿病病程 | 0.067 | 0.004 | 16.818 | <0.001 | 1.070 | (1.061,1.078) |
| HbA1c | 0.213 | 0.012 | 18.316 | <0.001 | 1.237 | (1.209,1.266) |
| HDL | -0.073 | 0.075 | -9.669 | <0.001 | 0.894 | (0.877,0.901) |
Table 2 Multivariate Logistic regression analysis of influencing factors of diabetic peripheral neuropathy in type 2 diabetics
| 项目 | β | SE | Wald χ2值 | P值 | OR值 | 95%CI |
|---|---|---|---|---|---|---|
| 常量 | -6.552 | 0.199 | -32.853 | <0.001 | - | - |
| 年龄 | 0.034 | 0.002 | 14.694 | <0.001 | 1.034 | (1.031,1.039) |
| DR | 2.475 | 0.051 | 48.545 | <0.001 | 11.881 | (10.756,13.135) |
| 糖尿病病程 | 0.067 | 0.004 | 16.818 | <0.001 | 1.070 | (1.061,1.078) |
| HbA1c | 0.213 | 0.012 | 18.316 | <0.001 | 1.237 | (1.209,1.266) |
| HDL | -0.073 | 0.075 | -9.669 | <0.001 | 0.894 | (0.877,0.901) |
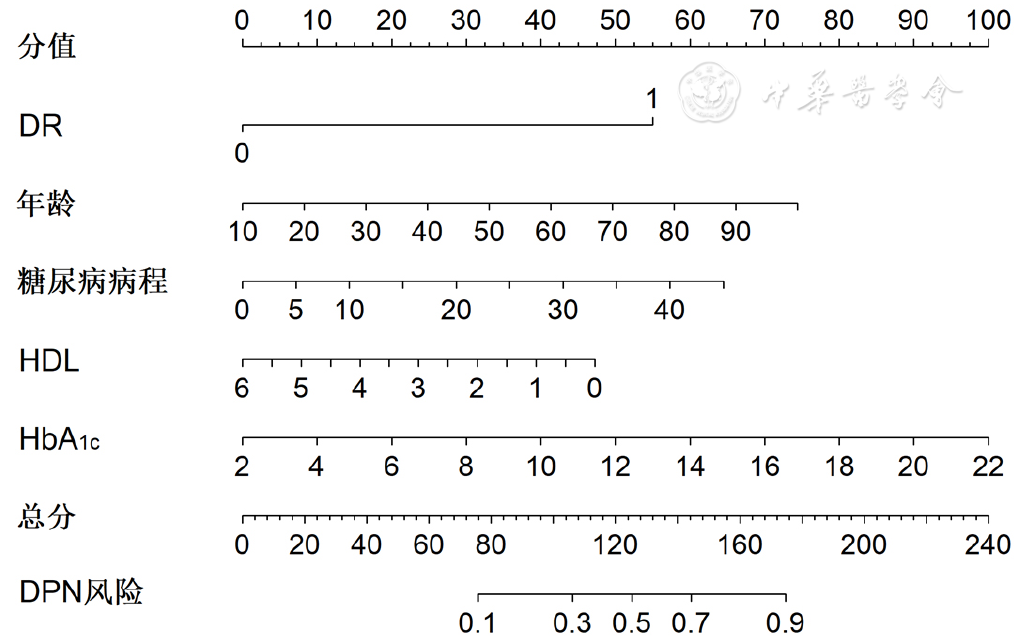
Figure 2 Nomogram predicting diabetic peripheral neuropathy in type 2 diabetics
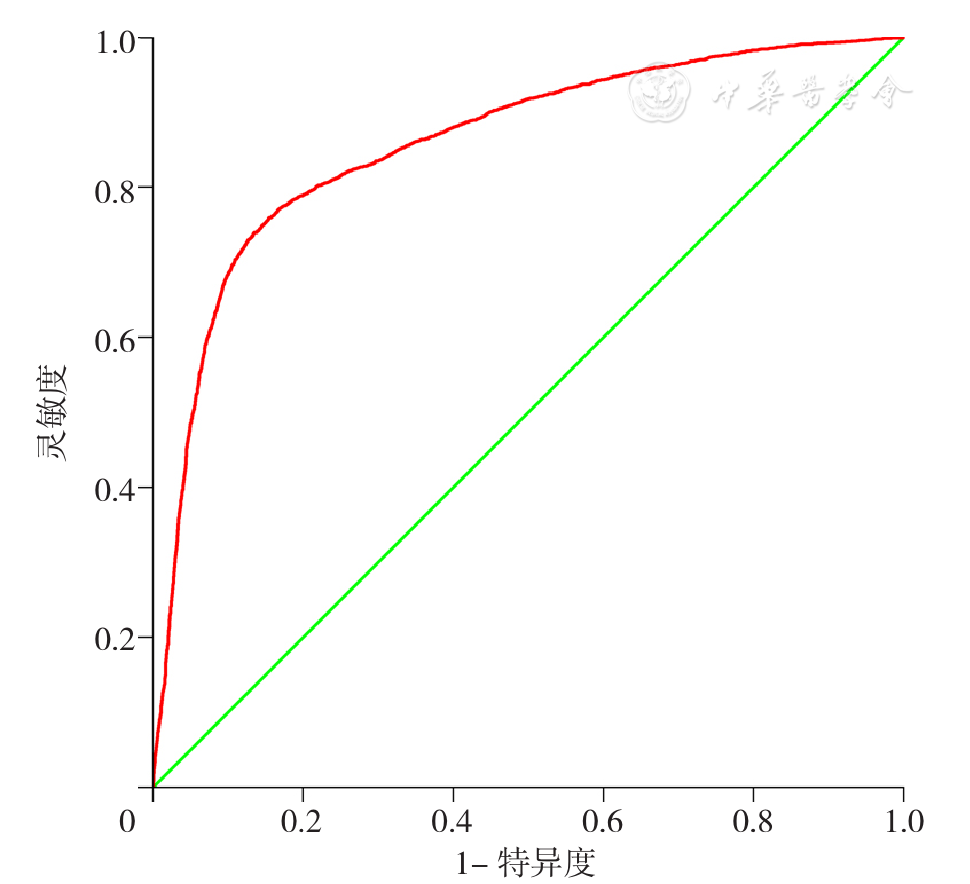
Figure 3 ROC curve of the predictive nomogram for the risk of diabetic peripheral neuropathy in type 2 diabetics of training group
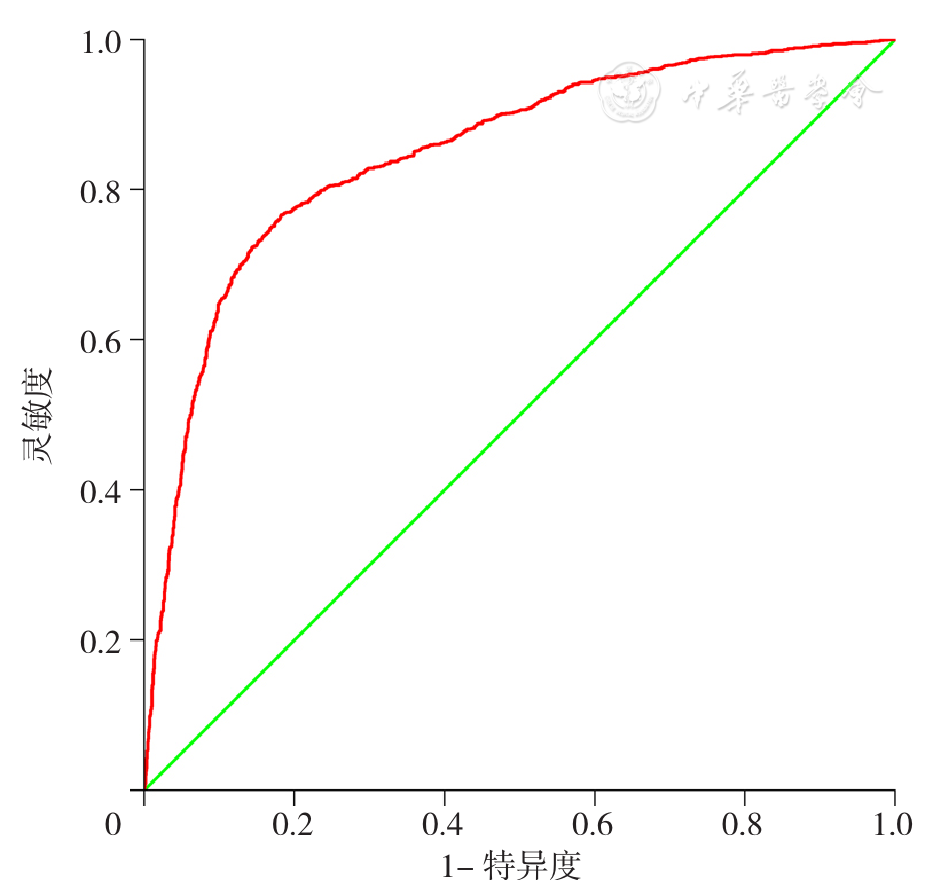
Figure 4 ROC curve of the predictive nomogram for the risk of diabetic peripheral neuropathy in type 2 diabetics of verification group
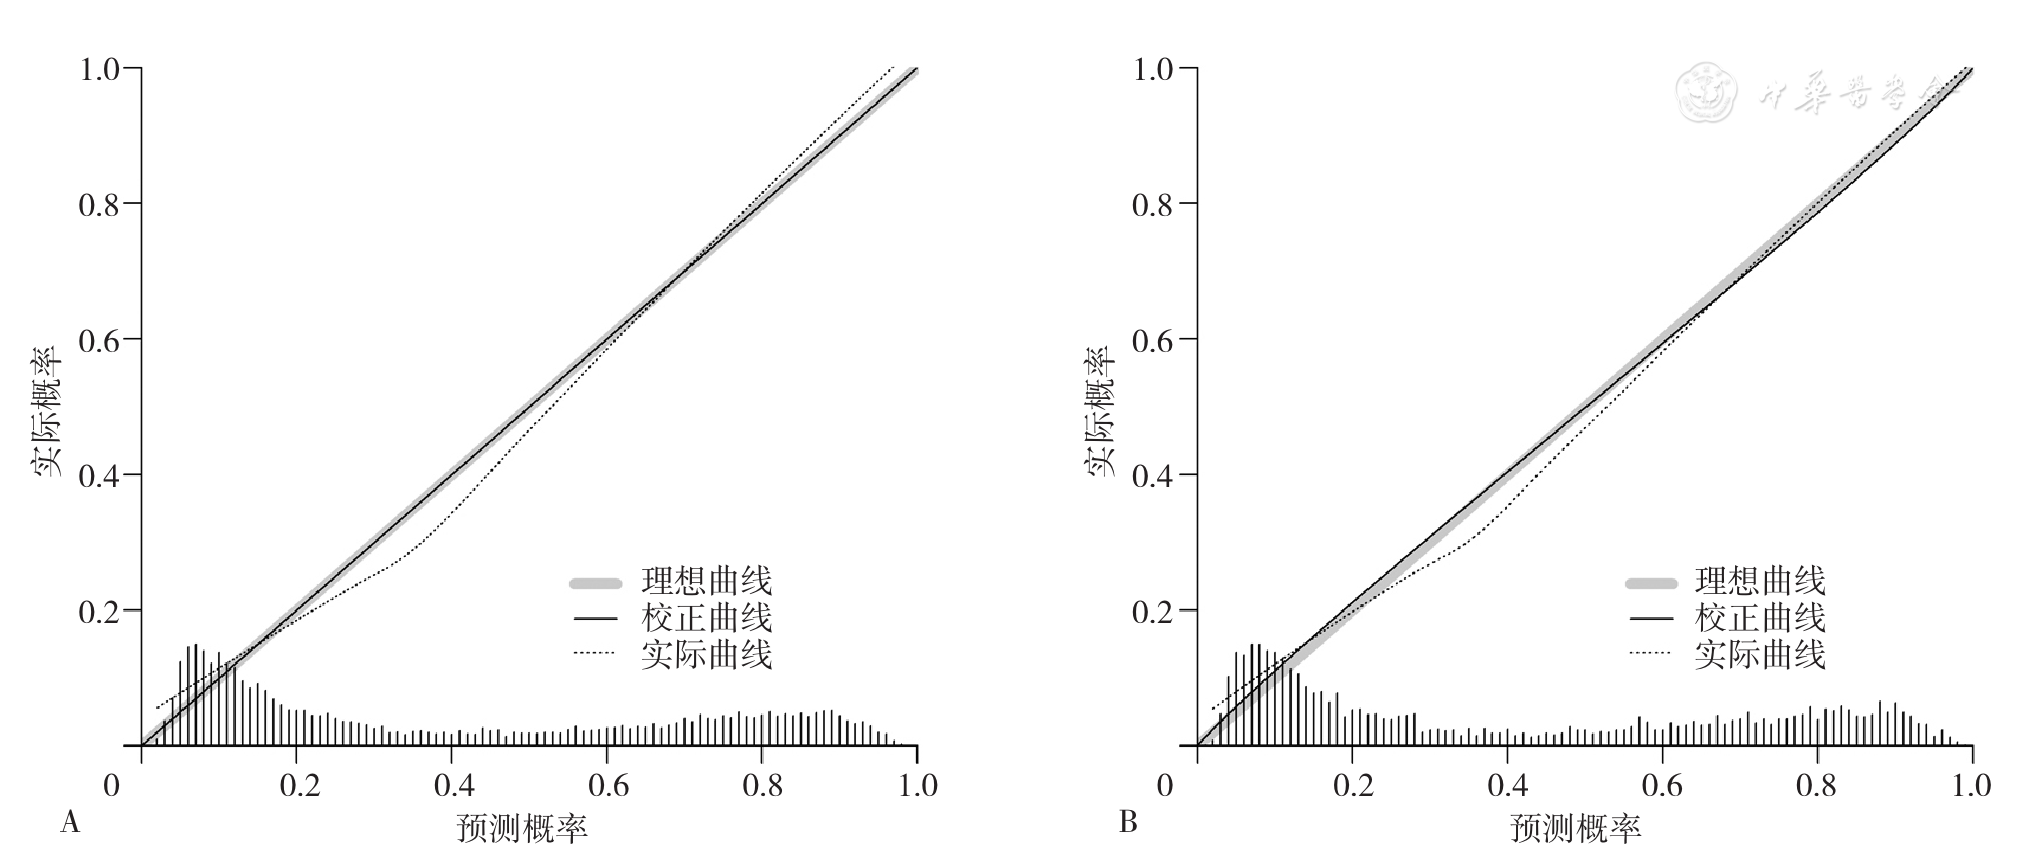
Figure 5 Calibration curve for predicting the risk of diabetic peripheral neuropathy in type 2 diabetics by the predictive nomogram
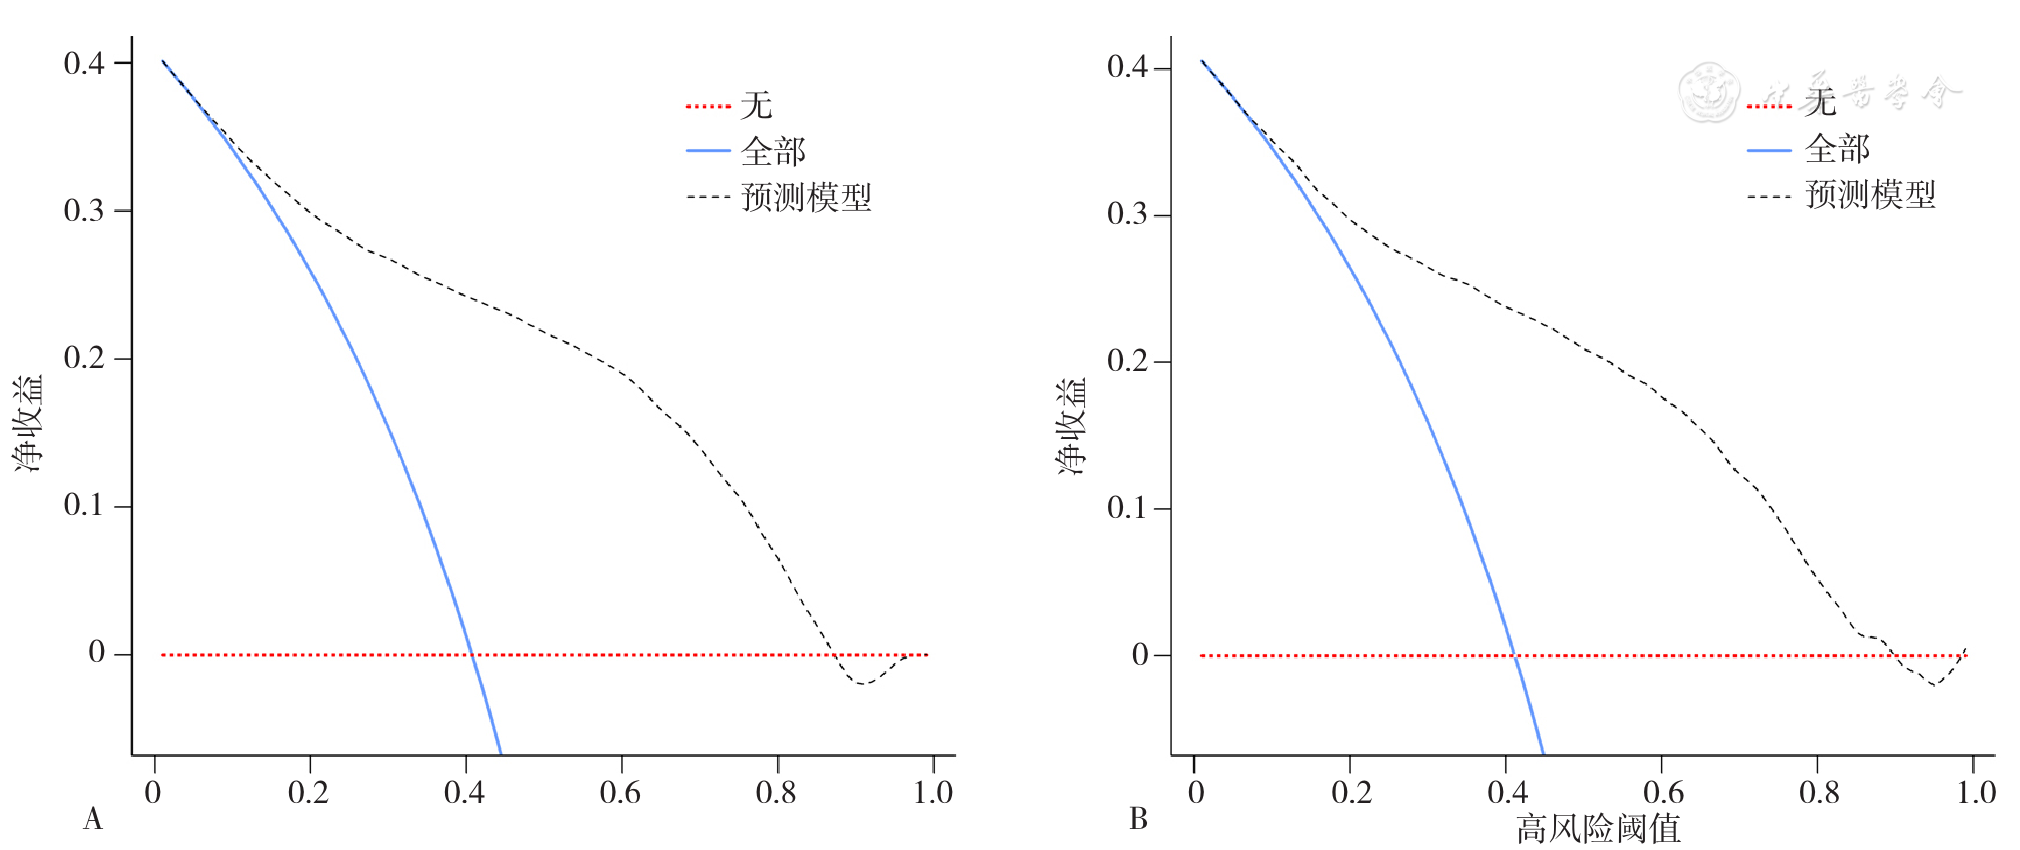
Figure 6 Decision curve analysis for predicting the risk of diabetic peripheral neuropathy in type 2 diabetics by the predictive nomogram
| [1] | IDF Congress 2019:Shaping the future of diabetes[J]. Diabetes Res Clin Pract,2019,158:107954. DOI:10.1016/j.diabres.2019.107954. |
| [2] | ZHU Y T, HU P, CHEN J,et al. Analysis of related factors of diabetic peripheral neuropathy[J]. Nerve Injury and Functional Reconstruction,2019,14(12):622-625. |
| [3] | PAN Q, LI Q, DENG W,et al. Prevalence of and risk factors for peripheral neuropathy in Chinese patients with diabetes:a multicenter cross-sectional study[J]. Front Endocrinol:Lausanne,2018,9:617. DOI:10.3389/fendo.2018.00617. |
| [4] | WIN M M T M, FUKAI K, NYUNT H H,et al. Prevalence of peripheral neuropathy and its impact on activities of daily living in people with type 2 diabetes mellitus[J]. Nurs Health Sci,2019,21(4):445-453. DOI:10.1111/nhs.12618. |
| [5] | BANSAL D, GUDALA K, MUTHYALA H,et al. Prevalence and risk factors of development of peripheral diabetic neuropathy in type 2 diabetes mellitus in a tertiary care setting[J]. J Diabetes Investig,2014,5(6):714-721. DOI:10.1111/jdi.12223. |
| [6] | Al WASHALI A Y, AZUHAIRI A A, HEJAR A R,et al. Prevalence and associated risk factors of diabetic peripheral neuropathy among diabetic patients innational center of diabetes in Yemen[J]. Int J Public Health Clin Sci,2014,1(1):141-150. |
| [7] | KHAWAJA N, ABU-SHENNAR J, SALEH M,et al. The prevalence and risk factors of peripheral neuropathy among patients with type 2 diabetes mellitus;the case of Jordan[J]. Diabetol Metab Syndr,2018,10:8. DOI:10.1186/s13098-018-0309-6. |
| [8] | SOBHANI S, ASAYESH H, SHARIFI F,et al. Prevalence of diabetic peripheral neuropathy in Iran:a systematic review and meta-analysis[J]. J Diabetes Metab Disord,2014,13(1):97. DOI:10.1186/s40200-014-0097-y. |
| [9] | JAISWAL M, DIVERS J, DABELEA D,et al. Prevalence of and risk factors for diabetic peripheral neuropathy in youth with type 1 and type 2 diabetes:SEARCH for diabetes in youth study[J]. Diabetes Care,2017,40(9):1226-1232. DOI:10.2337/dc17-0179. |
| [10] | LIU R, SANTANA T, SCHILLINGER D,et al. "It gave me hope" experiences of diverse safety net patients in a group acupuncture intervention for painful diabetic neuropathy[J]. Heal Equity,2020,4(1):225-231. DOI:10.1089/heq.2020.0004. |
| [11] | SELVARAJAH D, KAR D, KHUNTI K,et al. Diabetic peripheral neuropathy:advances in diagnosis and strategies for screening and early intervention[J]. Lancet Diabetes Endocrinol,2019,7(12):938-948. DOI:10.1016/s2213-8587(19)30081-6. |
| [12] | ALEIDAN F A S, AHMAD B A, ALOTAIBI F A,et al. Prevalence and risk factors for diabetic peripheral neuropathy among Saudi hospitalized diabetic patients:a nested case-control study[J]. Int J Gen Med,2020,13:881-889. DOI:10.2147/IJGM.S273807. |
| [13] | BANSAL D, GUDALA K, MUTHYALA H,et al. Prevalence and risk factors of development of peripheral diabetic neuropathy in type 2 diabetes mellitus in a tertiary care setting[J]. J Diabetes Investig,2014,5(6):714-721. DOI:10.1111/jdi.12223. |
| [14] | SANTOS T R M, MELO J V, LEITE N C,et al. Usefulness of the vibration perception thresholds measurement as a diagnostic method for diabetic peripheral neuropathy:results from the Rio de Janeiro type 2 diabetes cohort study[J]. J Diabetes Complicat,2018,32(8):770-776. DOI:10.1016/j.jdiacomp.2018.05.010. |
| [15] | 潘琦,王晓霞,王忆力,等. 北京地区老年糖尿病患者周围神经病变现况调查[J]. 中华老年医学杂志,2018,37(9):1036-1041. DOI:10.3760/cma.j.issn.0254-9026.2018.09.020. |
| [16] | 宁改君,史丽,邓文娟,等. 个体化预测2型糖尿病患者并发周围神经病变风险的列线图模型的建立[J]. 现代预防医学,2019,46(5):798-803. |
| [17] | 中华医学会糖尿病学分会. 中国2型糖尿病防治指南(2010年版)[J]. 中国医学前沿杂志:电子版,2011,3(6):54-109. |
| [18] | MUELLER-USING S, FELDT T, SARFO F S,et al. Factors associated with performing tuberculosis screening of HIV-positive patients in Ghana:LASSO-based predictor selection in a large public health data set[J]. BMC Public Heal,2016,16(1):1-8. DOI:10.1186/s12889-016-3239-y. |
| [19] | KIDD A C, MCGETTRICK M, TSIM S,et al. Survival prediction in mesothelioma using a scalable Lasso regression model:instructions for use and initial performance using clinical predictors[J]. BMJ Open Respir Res,2018,5(1):e000240. DOI:10.1136/bmjresp-2017-000240. |
| [20] | HARRELL F E.Evaluating the yield of medical tests[J]. JAMA,1982,247(18):2543-2546. DOI:10.1001/jama.247.18.2543. |
| [21] | CARVALHO G M C, LEITE T T, LIBÓRIO A B. Prediction of 60-day case fatality in critically ill patients receiving renal replacement therapy:external validation of a prediction model[J]. Shock,2018,50(2):156-161. DOI:10.1097/shk.0000000000001054. |
| [22] | VICKERS A J, CRONIN A M, ELKIN E B,et al. Extensions to decision curve analysis,a novel method for evaluating diagnostic tests,prediction models and molecular markers[J]. BMC Med Informatics Decis Mak,2008,8:53. DOI:10.1186/1472-6947-8-53. |
| [23] | FITZGERALD M, SAVILLE B R, LEWIS R J. Decision curve analysis[J]. JAMA,2015,313(4):409. DOI:10.1001/jama.2015.37. |
| [24] | 邱丽君,高方,邹梦晨,等. 2型糖尿病患者周围神经病变与糖尿病视网膜病变的关系[J]. 山东医药,2019,59(3):54-56. |
| [25] | 常琦. 710例住院2型糖尿病患者周围神经病变相关危险因素分析[D]. 合肥:安徽医科大学,2016. |
| [26] | ROMÁN-PINTOS L M, VILLEGAS-RIVERA G, RODRÍGUEZ-CARRIZALEZ A D,et al. Diabetic polyneuropathy in type 2 diabetes mellitus:inflammation,oxidative stress,and mitochondrial function[J]. J Diabetes Res,2016,2016:3425617. DOI:10.1155/2016/3425617. |
| [27] | CORRIERE M, ROOPARINESINGH N, KALYANI R R. Epidemiology of diabetes and diabetes complications in the elderly:an emerging public health burden[J]. Curr Diab Rep,2013,13(6):805-813. DOI:10.1007/s11892-013-0425-5. |
| [28] | BANSAL D, GUDALA K, ESAM H P,et al. Microvascular complications and their associated risk factors in newly diagnosed type 2 diabetes mellitus patients[J]. Int J Chronic Dis,2014,2014:1-7. DOI:10.1155/2014/201423. |
| [29] | LI L, CHEN J L, WANG J,et al. Prevalence and risk factors of diabetic peripheral neuropathy in type 2 diabetes mellitus patients with overweight/obese in Guangdong Province,China[J]. Prim Care Diabetes,2015,9(3):191-195. DOI:10.1016/j.pcd.2014.07.006. |
| [30] | SALVOTELLI L, STOICO V, PERRONE F,et al. Prevalence of neuropathy in type 2 diabetic patients and its association with other diabetes complications:the Verona Diabetic Foot Screening Program[J]. J Diabetes Complications,2015,29(8):1066-1070. DOI:10.1016/j.jdiacomp.2015.06.014. |
| [31] | KHANDOKER A H, AL-ANGARI H M, KHALAF K,et al. Association of diabetes related complications with heart rate variability among a diabetic population in the UAE[J]. PLoS One,2017,12(1):e0168584. DOI:10.1371/journal.pone.0168584. |
| [32] | MAO F, ZHU X, LIU S,et al. Age as an independent risk factor for diabetic peripheral neuropathy in Chinese patients with type 2 diabetes[J]. Aging Dis,2019,10(3):592-600. DOI:10.14336/ad.2018.0618. |
| [33] | POPESCU S, TIMAR B, BADERCA F,et al. Age as an independent factor for the development of neuropathy in diabetic patients[J]. Clin Interv Aging,2016,11:313-318. DOI:10.2147/cia.s97295. |
| [34] | SHUN C T, CHANG Y C, WU H P,et al. Skin denervation in type 2 diabetes:correlations with diabetic duration and functional impairments[J]. Brain,2004,127(pt 7):1593-1605. DOI:10.1093/brain/awh180. |
| [35] | ZHANG Y, JIANG Y, SHEN X,et al. Can both normal and mildly abnormal albuminuria and glomerular filtration rate be a danger signal for diabetic peripheral neuropathy in type 2 diabetes mellitus?[J]. Neurol Sci,2017,38(8):1381-1390. DOI:10.1007/s10072-017-2946-1 |
| [36] | 杨辉,施榕,朱静芬,等. 上海市社区2型糖尿病患者糖尿病周围神经病变现况调查[J]. 中国全科医学,2017,20(5):579-585. DOI:10.3969/j.issn.1007-9572.2017.05.015. |
| [37] | 贺阳. 糖尿病周围神经病变的相关因素分析[D]. 苏州:苏州大学,2016. |
| [38] | 李美. 糖尿病周围神经病变高危因素分析[J]. 交通医学,2018,32(6):580-581,584. |
| [39] | 黄开梅,刘兵,赵中. 114例糖尿病患者神经电生理特征与相关因素分析[J]. 中国实用神经疾病杂志,2016,19(3):17-18. |
| [40] | 韩兴发,张弘弘,胡吉. 慢性炎症与糖尿病神经病变的关系[J]. 医学综述,2016,22(23):4585-4589. |
| [41] | 王靖清,刘艳,于世家. 芪丹通络颗粒对糖尿病周围神经病变患者神经传导速度及MDA、SOD、TAOC的影响[J]. 中国生化药物杂志,2016,36(3):93-95. DOI:10.3969/j.issn.1005-1678.2016.03.29. |
| [42] | JIANG S M, FANG J Y, YU T,et al. Novel model predicts diabetic nephropathy in type 2 diabetes[J]. Am J Nephrol,2020,51(2):130-138. DOI:10.1159/000505145. |
| [1] | JIA Gaopeng, CHEN Qiuyu. Construction and Validation of a Risk Prediction Model for Recurrent Angina after Percutaneous Coronary Intervention in Elderly Patients with Acute ST-segment Elevation Myocardial Infarction: Based on CYP2C19-related Genetic Testing [J]. Chinese General Practice, 2025, 28(30): 3779-3786. |
| [2] | XU Baichuan, WANG Yan, ZHANG Peng, LI Yiting, LIU Feilai, XIE Yang. Research and Analysis of Screening Tools for Chronic Obstructive Pulmonary Disease Comorbidity Lung Cancer [J]. Chinese General Practice, 2025, 28(30): 3847-3852. |
| [3] | LI Ling, LI Yaping, QIAN Shixing, NIE Jing, LU Chunhua, LI Xia. Research on Influencing Factors and Risk Prediction of Cognitive Function in Community-dwelling Middle-aged and Elderly People [J]. Chinese General Practice, 2025, 28(30): 3773-3778. |
| [4] | SHAO Xiaoying, SHAO Jie, ZHU Yan, SHAO Jinling, SHANG Ling, WU Zhenlian, ZHAO Yu, ZHANG Jiacai. Analysis of the Current Status of Iron Deficiency and Factors Affecting Iron Deficiency Anemia among Children Aged 6-36 Months in Guizhou Province [J]. Chinese General Practice, 2025, 28(27): 3368-3374. |
| [5] | LIU Yinyin, SUI Hongping, LI Tingting, JIANG Tongtong, SHI Tieying, XIA Yunlong. Advances in Risk Prediction Models for Cardiotoxicity Associated with Breast Cancer Treatment [J]. Chinese General Practice, 2025, 28(24): 3072-3078. |
| [6] | ZHOU Qian, WU Xiaomin, WANG Baohua, YAN Ruohan, YU Miao, WU Jing. Study on Nomogram Prediction Model for Risk of Gastric Cancer [J]. Chinese General Practice, 2025, 28(23): 2870-2877. |
| [7] | ZHAO Xiaoqing, GUO Tongtong, ZHANG Xinyi, LI Linhong, ZHANG Ya, JI Lihong, DONG Zhiwei, GAO Qianqian, CAI Weiqing, ZHENG Wengui, JING Qi. Construction and Validation of a Risk Prediction Model for Cognitive Impairment in Community-dwelling Older Adults [J]. Chinese General Practice, 2025, 28(22): 2776-2783. |
| [8] | GUO Shengteng, ZHANG Fenfen, WAN Di, YU Dongmei, WANG Qinghua. Risk Factors for Severe Acute Pancreatitis Complicated with Acute Lung Injury: a Meta-analysis [J]. Chinese General Practice, 2025, 28(20): 2546-2554. |
| [9] | ZHANG Bingqing, WANG Zhongkai, WU Changyong, SUN Huang, LI Ruijie, LIU Wenjie, LUO Yihua, ZHENG Lihui, PENG Yunzhu. Changes and Trend Prediction in the Global Burden of Congenital Heart Defects, 1990-2021 [J]. Chinese General Practice, 2025, 28(18): 2253-2261. |
| [10] | WANG Xiaoyu, FENG Zhenzhen, WANG Jun, GUO Xiaochuan, LI Jiansheng. Risk Factors for Acute Kidney Injury in Acute Respiratory Distress Syndrome: a Systematic Review [J]. Chinese General Practice, 2025, 28(12): 1527-1537. |
| [11] | CHEN Shenglan, ZHENG Yongtao, HU Wangcheng, NI Zuowei, XIA Bing, YE Chunmei, DU Chixin, CHEN Xiaodan. Risk Prediction Model for High Myopia in Primary and Secondary School Students: Based on Nested Case-control Study [J]. Chinese General Practice, 2025, 28(09): 1115-1121. |
| [12] | LIAO Xingyu, TIAN Siyu, CHEN Min. The Disease Burden, Risk Factors and Predictive Analysis of Early-onset Colorectal Cancer of Different Genders between China and the World from 1990 to 2021 [J]. Chinese General Practice, 2025, 28(08): 1004-1011. |
| [13] | ZOU Songyan, ZHANG Riyi, LI Xiaodong, MU Yinyu. Analysis of Clinical Characteristics and Risk Factors of Systemic Sclerosis Combined with Sjögren's Syndrome [J]. Chinese General Practice, 2025, 28(06): 737-741. |
| [14] | SHI Xiaotian, WANG Shan, YANG Huayu, YANG Yifan, LI Xu, DOU Guoze, MA Qing. A Predictive Nomogram for the Risk of Frailty/Pre-frailty on Inflammatory Biomarkers in the Elderly [J]. Chinese General Practice, 2025, 28(05): 587-593. |
| [15] | DU Huijie, LIU Xingyu, XU Minghuan, YANG Xuezhi, ZHANG Huiqin, MO Jiali, LU Yi, KUANG Jie. Advances in the Prognostic Prediction of Acute Ischemic Stroke: Using Machine Learning Predictive Models as an Example [J]. Chinese General Practice, 2025, 28(05): 554-560. |
| Viewed | ||||||
|
Full text |
|
|||||
|
Abstract |
|
|||||