
Chinese General Practice ›› 2024, Vol. 27 ›› Issue (09): 1126-1133.DOI: 10.12114/j.issn.1007-9572.2023.0504
Special Issue: 内分泌代谢性疾病最新文章合辑
• Original Research • Previous Articles Next Articles
Received:2023-08-10
Revised:2023-10-20
Published:2024-03-20
Online:2023-12-19
Contact:
LIN Kaicheng
通讯作者:
林凯程
作者简介:基金资助:
Add to citation manager EndNote|Ris|BibTeX
URL: https://www.chinagp.net/EN/10.12114/j.issn.1007-9572.2023.0504
| 人群 | DALYs | 标化DALYs率 | 死亡 | 标化死亡率 | ||||||||
|---|---|---|---|---|---|---|---|---|---|---|---|---|
| 1990年(人年) | 2019年(人年) | 变化率(%) | 1990年(1/10万) | 2019年(1/10万) | 变化率(%) | 1990年 | 2019年 | 变化率(%) | 1990年(1/10万) | 2019年(1/10万) | 变化率(%) | |
| 全人群 | 77.18万 | 373.76万 | 384 | 80.21 | 181.54 | 126 | 1.05万 | 4.75万 | 352 | 1.25 | 2.39 | 91 |
| 男 | 35.47万 | 196.65万 | 454 | 71.48 | 195.12 | 173 | 0.40万 | 2.28万 | 467 | 1.00 | 2.47 | 146 |
| 女 | 41.71万 | 177.11万 | 325 | 88.84 | 167.70 | 89 | 0.65万 | 2.47万 | 281 | 1.49 | 2.35 | 58 |
Table 1 Disease burden of type 2 diabetes attributable to high BMI in China,1990—2019
| 人群 | DALYs | 标化DALYs率 | 死亡 | 标化死亡率 | ||||||||
|---|---|---|---|---|---|---|---|---|---|---|---|---|
| 1990年(人年) | 2019年(人年) | 变化率(%) | 1990年(1/10万) | 2019年(1/10万) | 变化率(%) | 1990年 | 2019年 | 变化率(%) | 1990年(1/10万) | 2019年(1/10万) | 变化率(%) | |
| 全人群 | 77.18万 | 373.76万 | 384 | 80.21 | 181.54 | 126 | 1.05万 | 4.75万 | 352 | 1.25 | 2.39 | 91 |
| 男 | 35.47万 | 196.65万 | 454 | 71.48 | 195.12 | 173 | 0.40万 | 2.28万 | 467 | 1.00 | 2.47 | 146 |
| 女 | 41.71万 | 177.11万 | 325 | 88.84 | 167.70 | 89 | 0.65万 | 2.47万 | 281 | 1.49 | 2.35 | 58 |
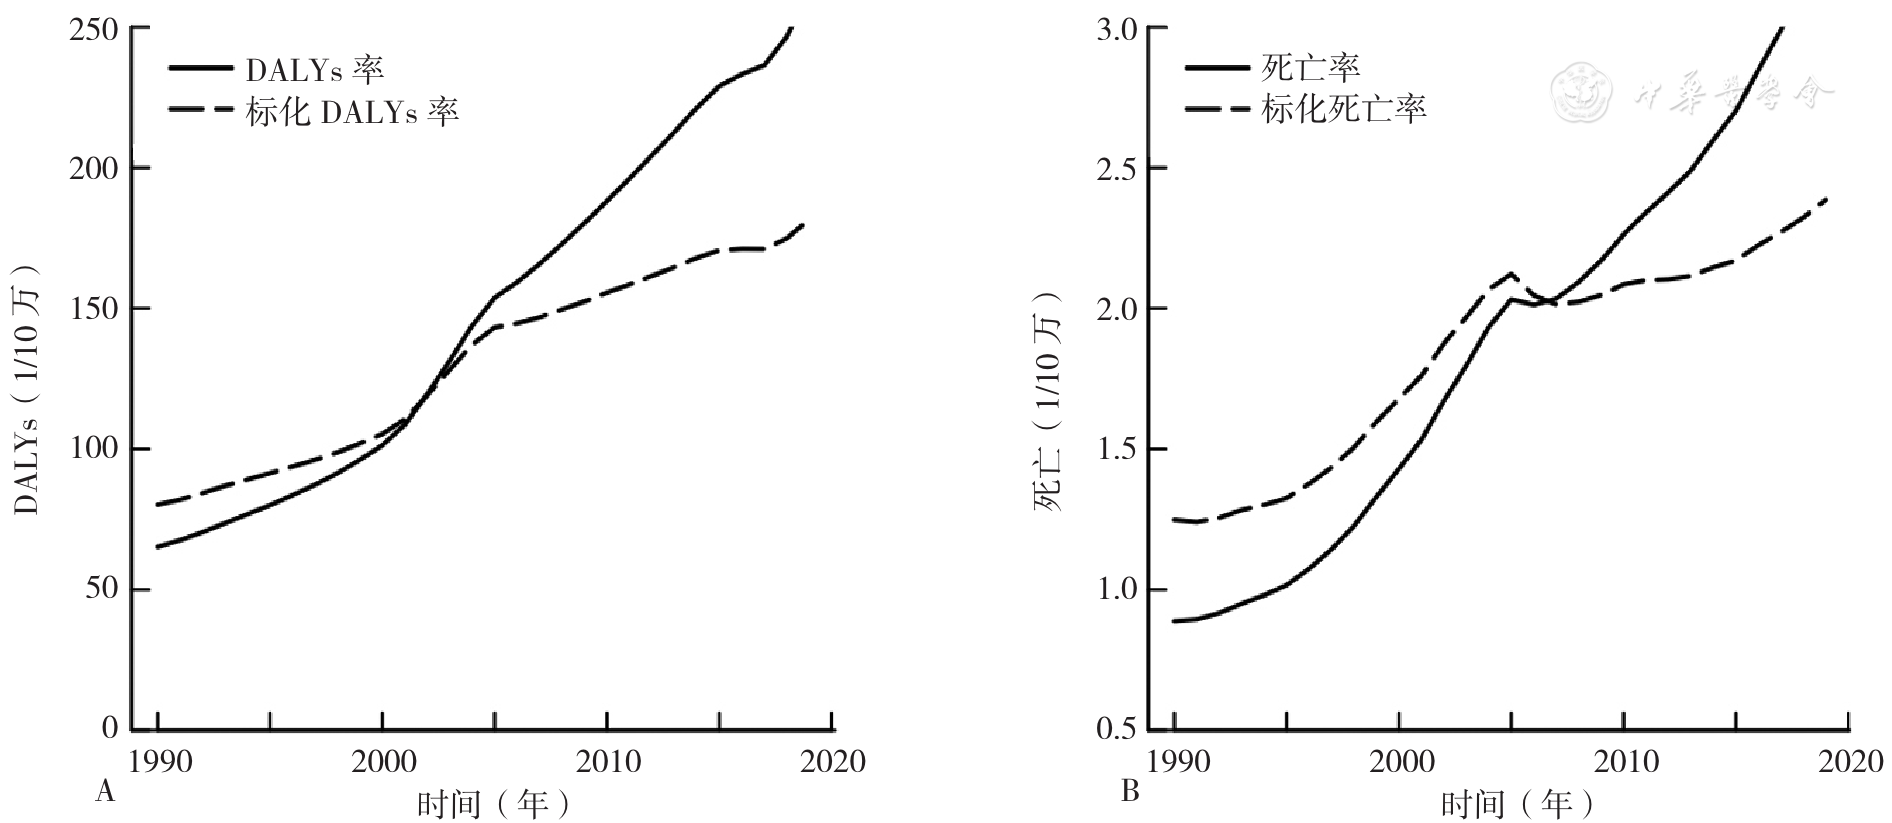
Figure 1 Trends in disease burden of type 2 diabetes attributable to high BMI in China,1990-2019
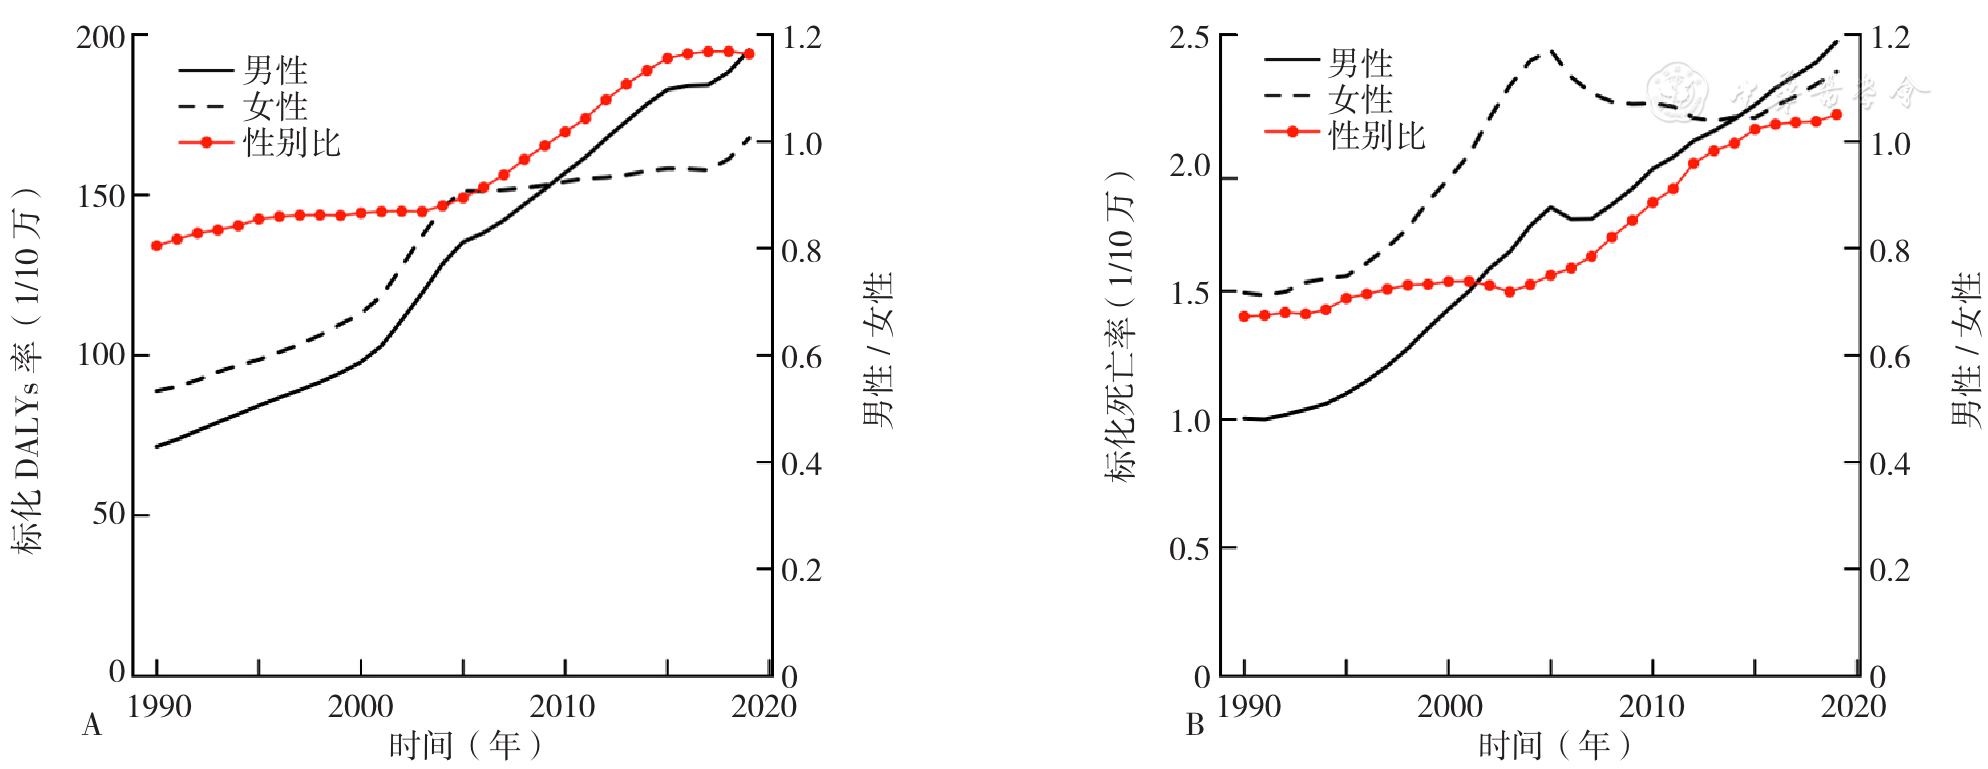
Figure 2 Trends in disease burden of type 2 diabetes attributed to high BMI by gender,1990-2019
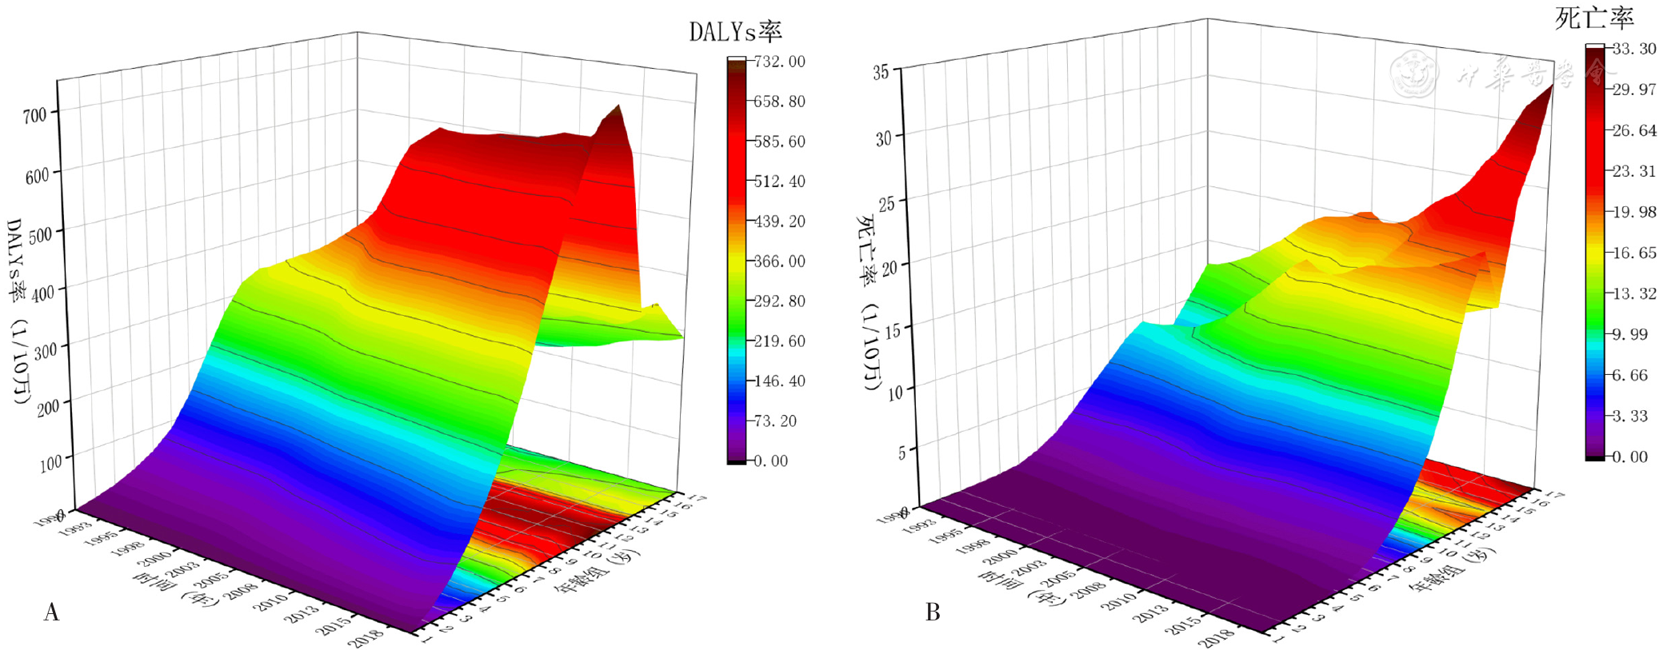
Figure 3 Trends in disease burden of type 2 diabetes attributable to high BMI by age group,1990—2019
| 变量 | 地区 | 指标 | 时间(年) | 变化值(95%CI)(%) |
|---|---|---|---|---|
| 标化DALYs率 | 中国 | APCa | 1990—2000 | 2.66(2.53~2.78) |
| 2000—2004 | 7.33(7.07~7.58) | |||
| 2004—2014 | 1.99(1.90~2.12) | |||
| 2014—2017 | 0.59(0.29~1.07) | |||
| 2017—2019 | 2.76(2.08~3.35) | |||
| AAPCa | 1990—2019 | 2.85(2.81~2.89) | ||
| 全球 | 1990—2001 | 2.11(2.01~2.17) | ||
| 2001—2004 | 2.90(2.48~3.06) | |||
| 2004—2019 | 1.93(1.89~1.96) | |||
| AAPC | 1990—2019 | 2.10(2.08~2.12) | ||
| 标化死亡率(1/10万) | 中国 | APCa | 1990—1996 | 1.66(1.13~2.18) |
| 1996—2004 | 5.57(5.31~5.85) | |||
| 2004—2007 | -1.11(-1.56~0.34) | |||
| 2007—2015 | 0.87(0.62~1.14) | |||
| 2015—2019 | 2.44(1.93~3.45) | |||
| AAPCa | 1990—2019 | 2.32(2.25~2.39) | ||
| 全球 | 1990—1994 | 2.41(2.14~2.90) | ||
| 1994—2004 | 1.78(1.61~1.86) | |||
| 2004—2011 | 0.53(0.34~1.83) | |||
| 2011—2016 | 1.64(0.46~2.04) | |||
| 2016—2019 | 1.12(0.65~1.47) | |||
| AAPCa | 1990—2019 | 1.47(1.44~1.51) |
Table 2 Joinpoint regression analysis of changes in disease burden of type 2 diabetes attributable to high BMI in China and globally
| 变量 | 地区 | 指标 | 时间(年) | 变化值(95%CI)(%) |
|---|---|---|---|---|
| 标化DALYs率 | 中国 | APCa | 1990—2000 | 2.66(2.53~2.78) |
| 2000—2004 | 7.33(7.07~7.58) | |||
| 2004—2014 | 1.99(1.90~2.12) | |||
| 2014—2017 | 0.59(0.29~1.07) | |||
| 2017—2019 | 2.76(2.08~3.35) | |||
| AAPCa | 1990—2019 | 2.85(2.81~2.89) | ||
| 全球 | 1990—2001 | 2.11(2.01~2.17) | ||
| 2001—2004 | 2.90(2.48~3.06) | |||
| 2004—2019 | 1.93(1.89~1.96) | |||
| AAPC | 1990—2019 | 2.10(2.08~2.12) | ||
| 标化死亡率(1/10万) | 中国 | APCa | 1990—1996 | 1.66(1.13~2.18) |
| 1996—2004 | 5.57(5.31~5.85) | |||
| 2004—2007 | -1.11(-1.56~0.34) | |||
| 2007—2015 | 0.87(0.62~1.14) | |||
| 2015—2019 | 2.44(1.93~3.45) | |||
| AAPCa | 1990—2019 | 2.32(2.25~2.39) | ||
| 全球 | 1990—1994 | 2.41(2.14~2.90) | ||
| 1994—2004 | 1.78(1.61~1.86) | |||
| 2004—2011 | 0.53(0.34~1.83) | |||
| 2011—2016 | 1.64(0.46~2.04) | |||
| 2016—2019 | 1.12(0.65~1.47) | |||
| AAPCa | 1990—2019 | 1.47(1.44~1.51) |
| 年份(年) | 标化DALYs率 | 标化死亡率 | ||||
|---|---|---|---|---|---|---|
| 预测值(1/10万) | 实际值(1/10万) | 相对误差(%) | 预测值(1/10万) | 实际值(1/10万) | 相对误差(%) | |
| 2017 | 171.354 | 171.083 | 0.16 | 2.289 | 2.271 | 0.78 |
| 2018 | 172.298 | 174.845 | 1.46 | 2.330 | 2.322 | 0.35 |
| 2019 | 174.347 | 181.537 | 3.96 | 2.369 | 2.386 | 0.73 |
Table 3 Predicted values and actual values of standardized DALYs rate and standardized mortality of type 2 diabetes attributable to high BMI in China
| 年份(年) | 标化DALYs率 | 标化死亡率 | ||||
|---|---|---|---|---|---|---|
| 预测值(1/10万) | 实际值(1/10万) | 相对误差(%) | 预测值(1/10万) | 实际值(1/10万) | 相对误差(%) | |
| 2017 | 171.354 | 171.083 | 0.16 | 2.289 | 2.271 | 0.78 |
| 2018 | 172.298 | 174.845 | 1.46 | 2.330 | 2.322 | 0.35 |
| 2019 | 174.347 | 181.537 | 3.96 | 2.369 | 2.386 | 0.73 |
| 指标 | 模型 | 训练集 | |||
|---|---|---|---|---|---|
| MAPE(%) | MAE | MASE | RMSE | ||
| 标化DALYs率 | ARIMA(2,1,0) | 0.564 | 0.722 | 0.206 | 1.103 |
| 标化死亡率 | ARIMA(1,1,1) | 1.135 | 0.021 | 0.448 | 0.028 |
Table 4 Fitting precision of ARIMA prediction model for standardized DALYs and standardized mortality of type 2 diabetes attributable to high BMI in China
| 指标 | 模型 | 训练集 | |||
|---|---|---|---|---|---|
| MAPE(%) | MAE | MASE | RMSE | ||
| 标化DALYs率 | ARIMA(2,1,0) | 0.564 | 0.722 | 0.206 | 1.103 |
| 标化死亡率 | ARIMA(1,1,1) | 1.135 | 0.021 | 0.448 | 0.028 |
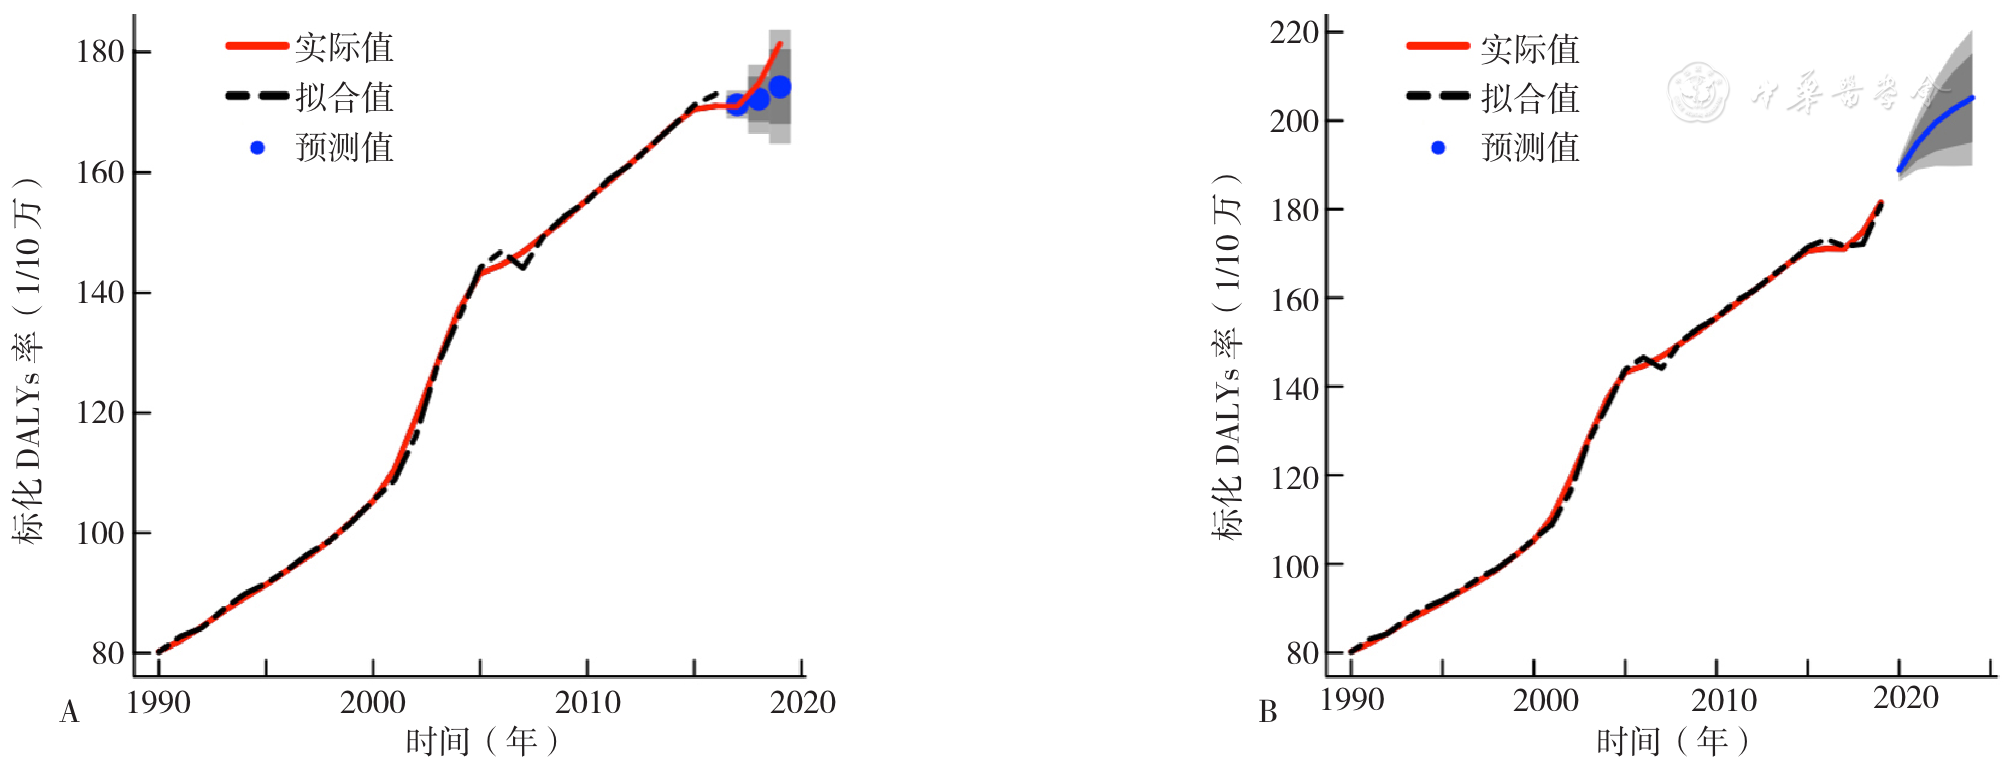
Figure 4 Fitting and predictive performance of ARIMA(2,1,0) DALYs prediction model
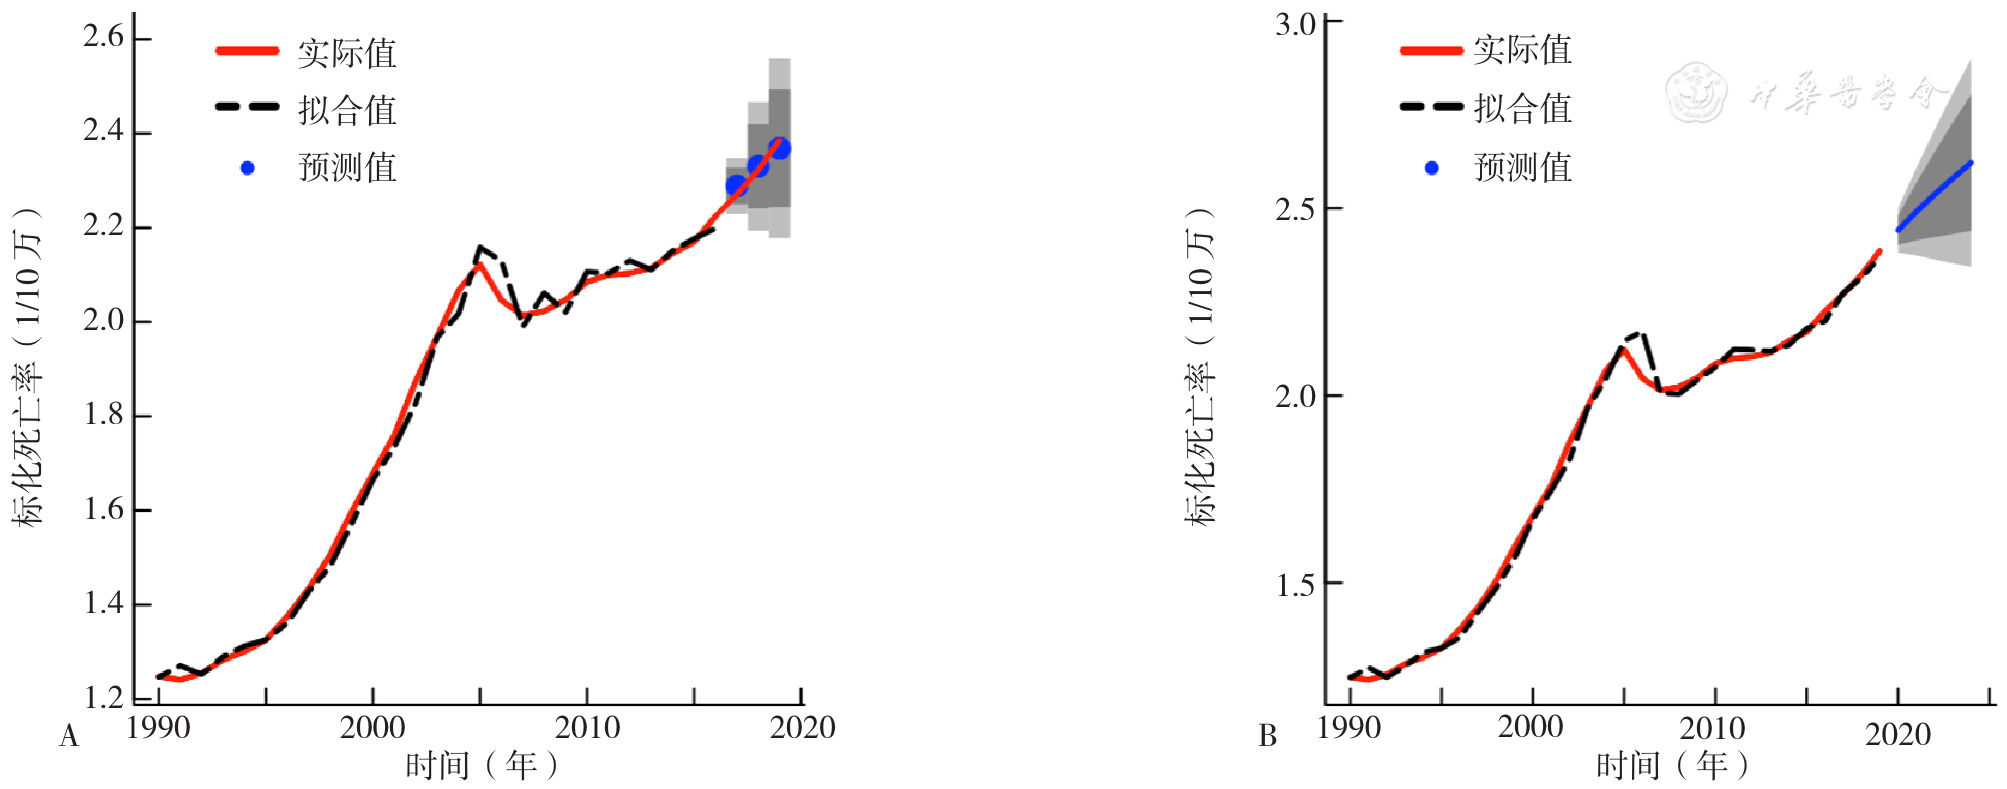
Figure 5 Fitting and predictive performance of ARIMA(1,1,1)and ARIMA(1,1,0)mortality prediction model
| 时间(年) | 标化DALYs率 | 标化死亡率 | ||
|---|---|---|---|---|
| 预测值 | 95%CI | 预测值 | 95%CI | |
| 2020 | 188.826 | 186.329~191.324 | 2.441 | 2.381~2.501 |
| 2021 | 195.036 | 188.951~201.122 | 2.491 | 2.374~2.608 |
| 2022 | 199.558 | 189.712~209.404 | 2.537 | 2.363~2.711 |
| 2023 | 202.683 | 189.655~215.711 | 2.580 | 2.352~2.808 |
| 2024 | 205.142 | 189.775~220.508 | 2.621 | 2.343~2.900 |
Table 5 Prediction of type 2 diabetes disease burden attributable to high BMI in China based on ARIMA model,2020—2024
| 时间(年) | 标化DALYs率 | 标化死亡率 | ||
|---|---|---|---|---|
| 预测值 | 95%CI | 预测值 | 95%CI | |
| 2020 | 188.826 | 186.329~191.324 | 2.441 | 2.381~2.501 |
| 2021 | 195.036 | 188.951~201.122 | 2.491 | 2.374~2.608 |
| 2022 | 199.558 | 189.712~209.404 | 2.537 | 2.363~2.711 |
| 2023 | 202.683 | 189.655~215.711 | 2.580 | 2.352~2.808 |
| 2024 | 205.142 | 189.775~220.508 | 2.621 | 2.343~2.900 |
| [1] | |
| [2] |
International Diabetes Federation. IDF Diabetes Atlas 2021-10th edition[EB/OL]. [2023-07-06].
|
| [3] |
|
| [4] | |
| [5] |
Prospective Studies Collaboration. Body-mass index and cause-specific mortality in 900 000 adults:collaborative analyses of 57 prospective studies[J]. Lancet,2009,373(9669):1083-1096. DOI:10.1016/S0140-6736(09)60318-4.
|
| [6] |
|
| [7] |
|
| [8] |
官昊宇,俞浩,罗鹏飞,等. 1990—2019年江苏省居民2型糖尿病疾病负担及其变化趋势分析[J]. 中国慢性病预防与控制,2022,30(9):666-671. DOI:10.16386/j.cjpccd.issn.1004-6194.2022.09.006.
|
| [9] |
王海鹏. 我国诊断糖尿病疾病经济负担趋势预测研究[D]. 山东:山东大学,2013.
|
| [10] |
梁珊珊,周智华,李成程,等. 1990—2019年中国糖尿病疾病负担及发病预测分析[J]. 中国全科医学,2023,26(16):2013-2019. DOI:10.12114/j.issn.1007-9572.2023.0009.
|
| [11] |
GBD 2019 Diseases and Injuries Collaborators. Global burden of 369 diseases and injuries in 204 countries and territories,1990-2019:a systematic analysis for the Global Burden of Disease Study 2019[J]. Lancet,2020,396(10258):1204-1222. DOI:10.1016/S0140-6736(20)30925-9.
|
| [12] |
GBD 2019 Risk Factors Collaborators. Global burden of 87 risk factors in 204 countries and territories,1990-2019:a systematic analysis for the Global Burden of Disease Study 2019[J]. Lancet,2020,396(10258):1223-1249. DOI:10.1016/S0140-6736(20)30752-2.
|
| [13] |
GBD 2019 Viewpoint Collaborators. Five insights from the Global Burden of Disease Study 2019[J]. Lancet (London,England),2020,396(10258):1135-1159. DOI:10.1016/S0140-6736(20)31404-5.
|
| [14] |
GBD 2017 Disease and Injury Incidence and Prevalence Collaborators. Global,regional,and national incidence,prevalence,and years lived with disability for 354 diseases and injuries for 195 countries and territories,1990-2017:a systematic analysis for the Global Burden of Disease Study 2017[J]. Lancet,2018,392(10159):1789-1858. DOI:10.1016/S0140-6736(18)32279-7.
|
| [15] |
|
| [16] |
|
| [17] |
|
| [18] |
|
| [19] |
国务院新闻办就《中国居民营养与慢性病状况报告(2020年)》有关情况举行发布会[A/OL]. (2020-12-24)[2023-07-06].
|
| [20] | |
| [21] |
|
| [22] |
|
| [23] |
姜勇. 我国成人超重肥胖流行现状、变化趋势及健康危害研究[D]. 北京:中国疾病预防控制中心,2013.
|
| [24] |
丁贤彬,毛德强,焦艳,等. 重庆市糖尿病患病率、死亡率及伤残调整寿命年率分析[J]. 上海交通大学学报(医学版),2021,41(1):78-81. DOI:10.3969/j.issn.1674-8115.2021.01.014.
|
| [25] |
|
| [26] |
《中国老年2型糖尿病防治临床指南》编写组. 中国老年2型糖尿病防治临床指南(2022年版)[J]. 中国糖尿病杂志,2022,30(1):2-51. DOI:10.3969/j.issn.1006-6187.2022.01.002.
|
| [27] |
国务院办公厅关于印发中国防治慢性病中长期规划(2017—2025年)的通知[A/OL]. (2017-01-22)[2023-07-06].
|
| [28] |
健康中国行动推进委员会. 健康中国行动(2019—2030年):总体要求、重大行动及主要指标[J]. 中国循环杂志,2019,34(9):846-858. DOI:10.3969/j.issn.1000-3614.2019.09.003.
|
| [29] |
|
| [30] |
|
| [31] |
|
| [1] | TANG Lijuan, QI Qi, ZHANG Fan, GAO Yifu, CAO Yajing, YUE Fujuan, GAO Jinchai, LIU Xiaoli. Characterisation of the Prevalence of Overweight/Obesity among Residents Aged 18-44 Years in Hebei Province in 2013 and 2020 [J]. Chinese General Practice, 2026, 29(19): 2695-2704. |
| [2] | LI Jiali, LIU Fan, KE Lixin, LI Huijuan, WANG Haibo, ZHAO Xiaoxiao, ZHAO Xinke, LU Cuncun. Disease Burden of Obesity among Individuals Aged 60 and above Globally and in China from 1990 to 2021: Trend Analysis and Model-based Projection [J]. Chinese General Practice, 2026, 29(15): 2067-2076. |
| [3] | HE Zhiguang, QIU Shanjiao, CHEN Zhang, LI Anchun, HUANG Wenjing. Interpretation and Discussion of the RACGP Guidelines for Preventive Activities in General Practice: Screening for Weight Issues and Preventive Strategies [J]. Chinese General Practice, 2026, 29(12): 1505-1510. |
| [4] | SUN Xia, SHEN Wen, TANG Xiang, ZHONG Wei, WANG Kailin, DAI Zhiyin, ZHANG Chaopu, YUAN Wei, YUAN Guoyue. Analysis of Clinical Characteristics in Dilated Cardiomyopathy Patients with Different Weight Statuses and the Influence of Weight Management on the Prognosis [J]. Chinese General Practice, 2026, 29(11): 1448-1455. |
| [5] | ZHANG Sanhua, CHEN Xiaolong, ZHANG Yanfeng. BMI Percentile Reference Curves and Trends in Thinness, Overweight, and Obesity among Preschool Children in Macao [J]. Chinese General Practice, 2026, 29(09): 1146-1154. |
| [6] | ZHANG Zhiwei, HE Panpan, YANG Qianwen, JIN Xueyi, MAO Xueqian, HU Ying, JING Lipeng. The Relationship between Different Obesity Indicators and Frailty among the Elderly in Rural Regions [J]. Chinese General Practice, 2026, 29(06): 699-709. |
| [7] | ZHANG Yanjing, ZHOU Chunhua, LI Xiaodong, LIU Yan, WANG Jing, YU Jing. Study on the Clinical Value of a Risk Prediction Model for Venlafaxine Plasma Concentration Exceeding the Safety Threshold [J]. Chinese General Practice, 2026, 29(06): 777-782. |
| [8] | LEI Yingying, ZHENG Siying, WANG Wenxin, JIANG Hong. Prevalence Trend and Prediction of Hypertensive Heart Disease in the World and China from 1990 to 2021 [J]. Chinese General Practice, 2026, 29(05): 641-648. |
| [9] | ZHANG Ying, YANG Ziyu, LIU Lidi, LIAO Xiaoyang, JIA Yu, SHEN Can, YANG Rong. Interpretation of the Consensus Statement Physical by American College of Sports Medicine on Adults Activity and Excess Body Weight and Adiposity [J]. Chinese General Practice, 2026, 29(03): 293-298. |
| [10] | ZHANG Wei, JIA Yuexiao, TANG Hongwei, XUE Xin, LEI Ying, DU Na, WANG Yumeng, YUAN Jiyun, LIU Huan. Study on the Effect of Energy-limited Intermittent Diet Patterns on Weight Management in Overweight and Obese People [J]. Chinese General Practice, 2026, 29(03): 355-360. |
| [11] | CHEN Xueqin, WANG Shihong, LAI Fengxia, ZHANG Jingjing, CHEN Hao, KONG Danli, DING Yuanlin. Study on Trend Analysis and Forecast of Incidence, Disease and Mortality of Chronic Obstructive Pulmonary Disease in China, 1990-2021 [J]. Chinese General Practice, 2026, 29(02): 264-272. |
| [12] | LI Shunan, ZHANG Shiyan, DENG Yanan, HU Danqing, ZHENG Yuxin, LI Danyang, LI Candong. An Analysis of Trends and Prediction of Disease Burden for Type 2 Diabetic Nephropathy from 1990 to 2021 in China [J]. Chinese General Practice, 2025, 28(33): 4214-4226. |
| [13] | ZHANG Yongqing, LI Na, GAO Yili, QIN Jiawen, YU Haiping, SHI Hui. Analysis on the Trend of Disease Burden of Hearing Loss in Middle-aged and Elderly People in China from 1990 to 2021 [J]. Chinese General Practice, 2025, 28(33): 4227-4233. |
| [14] | YANG Jian, WU Chuan'an, ZHOU Hairong, TIAN Feng, CHI Chunhua. Diagnostic Value of the Triglyceride Glucose-body Mass Index for Type 2 Diabetes Mellitus Combined with Metabolic Dysfunction-associated Fatty Liver Disease [J]. Chinese General Practice, 2025, 28(32): 4075-4081. |
| [15] | ZHANG Peng, LIU Lidi, ZHANG Ying, YANG Ziyu, LIU Changming, TANG Yijun, LIAO Xiaoyang, JIA Yu. Interpretation and Clinical Implications of the 2024 Italian Guidelines for the Management of Adult Individuals with Overweight and Obesity and Metabolic Comorbidities That are Resistant to Behavioral Treatment [J]. Chinese General Practice, 2025, 28(30): 3747-3752. |
| Viewed | ||||||
|
Full text |
|
|||||
|
Abstract |
|
|||||