
Chinese General Practice ›› 2023, Vol. 26 ›› Issue (36): 4581-4586.DOI: 10.12114/j.issn.1007-9572.2023.0220
Special Issue: 消化系统疾病最新文章合辑
• Article • Previous Articles Next Articles
Received:2023-04-02
Revised:2023-06-10
Published:2023-12-20
Online:2023-07-19
Contact:
YU Xiaohui
通讯作者:
于晓辉
作者简介:基金资助:
Add to citation manager EndNote|Ris|BibTeX
URL: https://www.chinagp.net/EN/10.12114/j.issn.1007-9572.2023.0220
| 性别 | 年份 | 发病率 | 死亡率 | DALY率 | |||
|---|---|---|---|---|---|---|---|
| 粗率 | 标化率 | 粗率 | 标化率 | 粗率 | 标化率 | ||
| 男性 | 1990年 | 1.71 | 1.72 | 0.42 | 0.94 | 18.21 | 24.06 |
| 2019年 | 3.99 | 3.35 | 0.35 | 0.47 | 17.71 | 18.45 | |
| 变化率(%) | 133.33 | 94.76 | -16.67 | -50.00 | -2.75 | -23.32 | |
| 女性 | 1990年 | 1.19 | 1.21 | 0.52 | 0.84 | 21.47 | 25.50 |
| 2019年 | 3.24 | 2.66 | 0.31 | 0.30 | 14.92 | 14.78 | |
| 变化率(%) | 172.27 | 119.83 | -40.38 | -64.29 | -30.51 | -42.04 | |
| 总人群 | 1990年 | 1.45 | 1.47 | 0.47 | 0.86 | 19.79 | 24.47 |
| 2019年 | 3.62 | 3.01 | 0.33 | 0.35 | 16.34 | 16.31 | |
| 变化率(%) | 149.66 | 104.76 | -29.79 | -59.30 | -17.43 | -33.35 | |
Table 1 Disease burden of inflammatory bowel disease in China from 1990 to 2019
| 性别 | 年份 | 发病率 | 死亡率 | DALY率 | |||
|---|---|---|---|---|---|---|---|
| 粗率 | 标化率 | 粗率 | 标化率 | 粗率 | 标化率 | ||
| 男性 | 1990年 | 1.71 | 1.72 | 0.42 | 0.94 | 18.21 | 24.06 |
| 2019年 | 3.99 | 3.35 | 0.35 | 0.47 | 17.71 | 18.45 | |
| 变化率(%) | 133.33 | 94.76 | -16.67 | -50.00 | -2.75 | -23.32 | |
| 女性 | 1990年 | 1.19 | 1.21 | 0.52 | 0.84 | 21.47 | 25.50 |
| 2019年 | 3.24 | 2.66 | 0.31 | 0.30 | 14.92 | 14.78 | |
| 变化率(%) | 172.27 | 119.83 | -40.38 | -64.29 | -30.51 | -42.04 | |
| 总人群 | 1990年 | 1.45 | 1.47 | 0.47 | 0.86 | 19.79 | 24.47 |
| 2019年 | 3.62 | 3.01 | 0.33 | 0.35 | 16.34 | 16.31 | |
| 变化率(%) | 149.66 | 104.76 | -29.79 | -59.30 | -17.43 | -33.35 | |
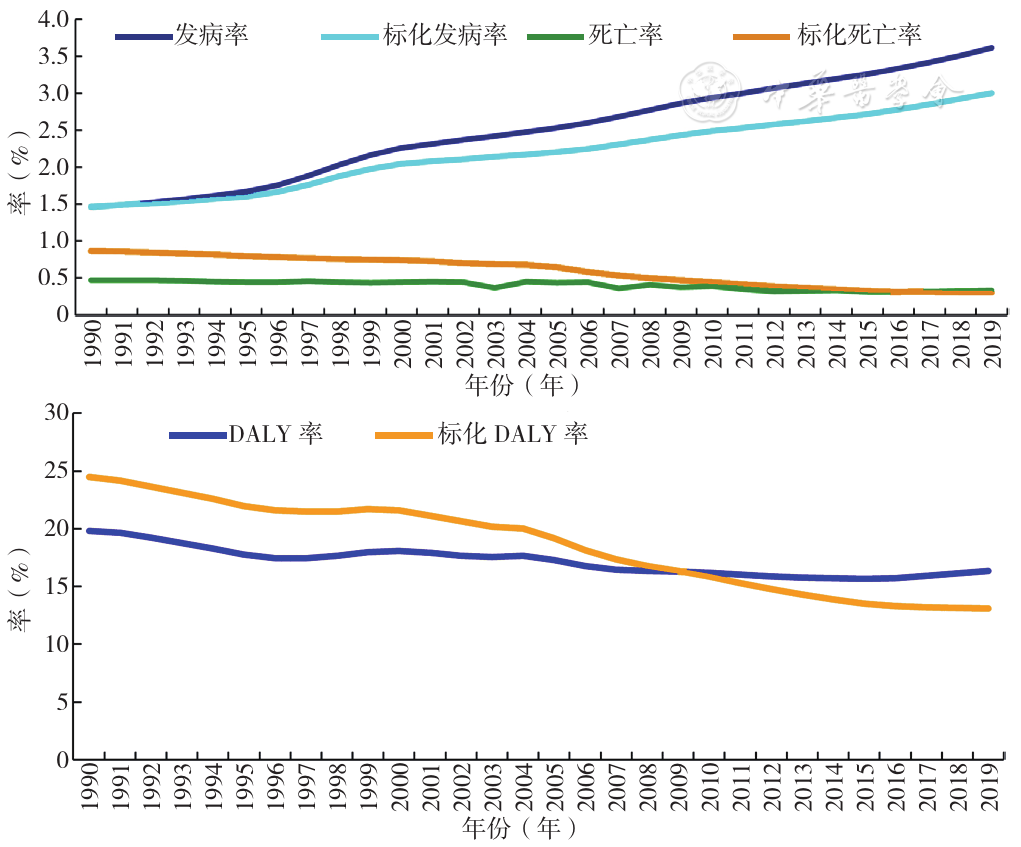
Figure 1 Disease burden of inflammatory bowel disease in China from 1990 to 2019
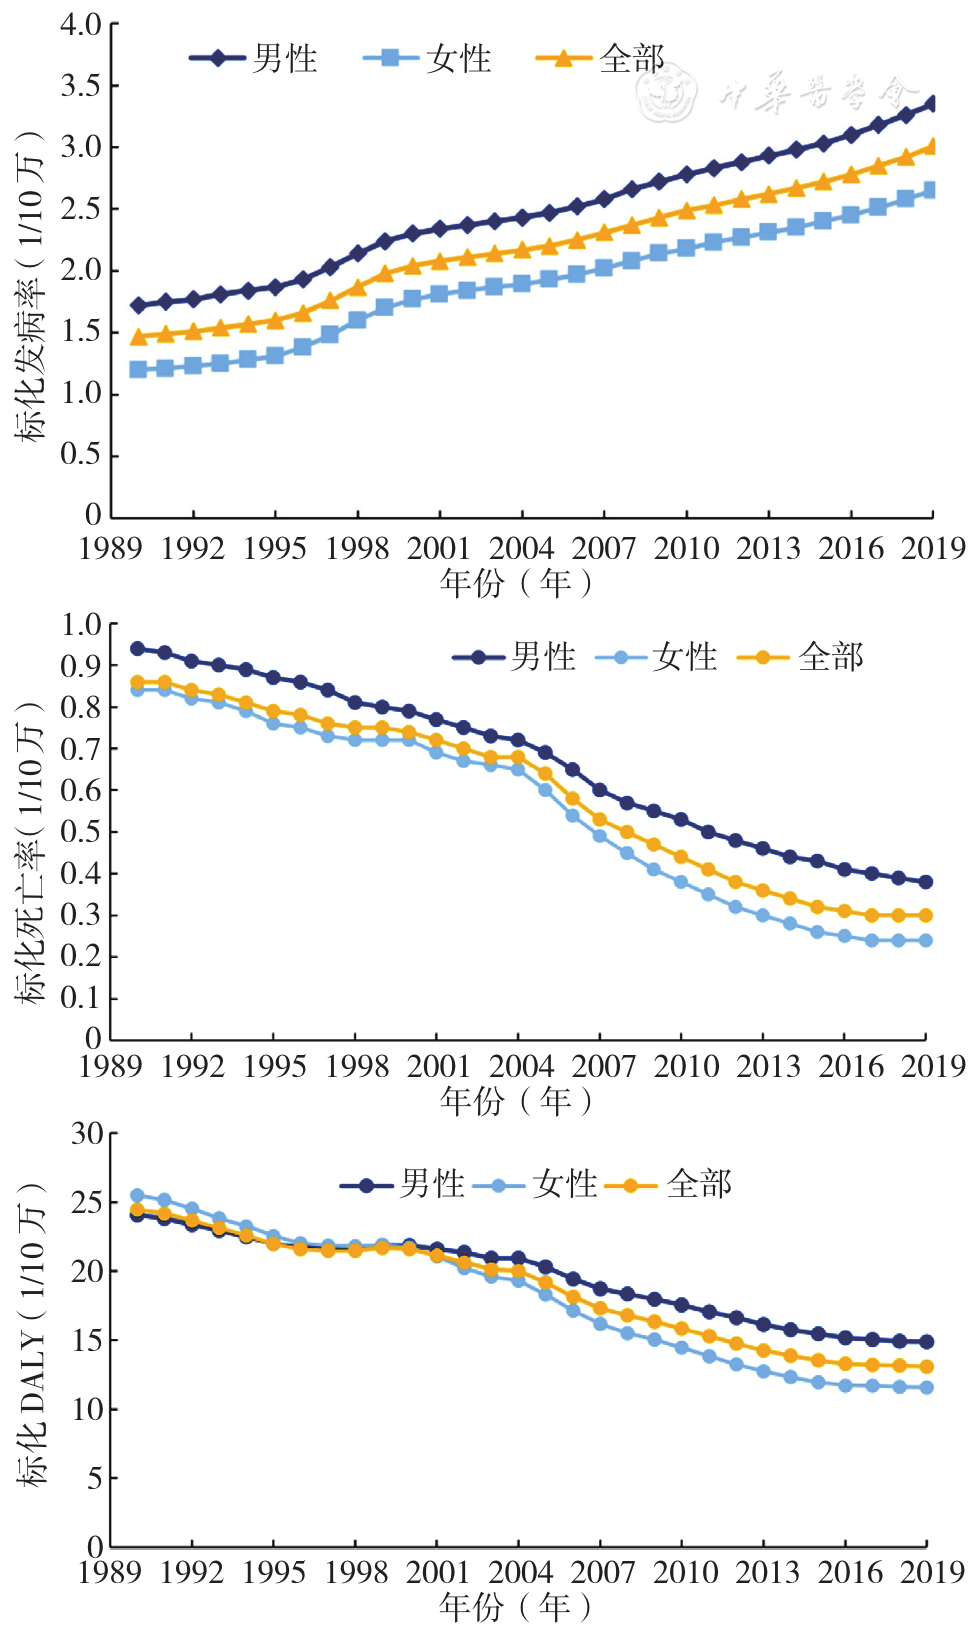
Figure 2 Joinpoint regression analysis of variation tendency of inflammatory bowel disease burden in different genders
| 分类 | 区间段(年) | APC(%) | t值 | P值 |
|---|---|---|---|---|
| 男性 | 1990—1996 | 1.86 | 77.1 | <0.001 |
| 1996—1999 | 5.66 | 42.7 | <0.001 | |
| 1999—2006 | 1.56 | 73.6 | <0.001 | |
| 2006—2009 | 2.77 | 22.0 | <0.001 | |
| 2009—2015 | 1.74 | 63.1 | <0.001 | |
| 2015—2019 | 2.52 | 62.9 | <0.001 | |
| 女性 | 1990—1995 | 1.63 | 6.8 | <0.001 |
| 1995—1999 | 7.19 | 13.9 | <0.001 | |
| 1999—2019 | 2.16 | 82.7 | <0.001 | |
| 总体 | 1990—1995 | 1.68 | 27.8 | <0.001 |
| 1995—2000 | 5.26 | 66.1 | <0.001 | |
| 2000—2005 | 1.31 | 17.5 | <0.001 | |
| 2005—2010 | 2.54 | 33.9 | <0.001 | |
| 2010—2015 | 1.73 | 23.2 | <0.001 | |
| 2015—2019 | 2.55 | 33.4 | <0.001 |
Table 2 Joinpoint regression analysis of standardized incidence of inflammatory bowel disease in China from 1990 to 2019
| 分类 | 区间段(年) | APC(%) | t值 | P值 |
|---|---|---|---|---|
| 男性 | 1990—1996 | 1.86 | 77.1 | <0.001 |
| 1996—1999 | 5.66 | 42.7 | <0.001 | |
| 1999—2006 | 1.56 | 73.6 | <0.001 | |
| 2006—2009 | 2.77 | 22.0 | <0.001 | |
| 2009—2015 | 1.74 | 63.1 | <0.001 | |
| 2015—2019 | 2.52 | 62.9 | <0.001 | |
| 女性 | 1990—1995 | 1.63 | 6.8 | <0.001 |
| 1995—1999 | 7.19 | 13.9 | <0.001 | |
| 1999—2019 | 2.16 | 82.7 | <0.001 | |
| 总体 | 1990—1995 | 1.68 | 27.8 | <0.001 |
| 1995—2000 | 5.26 | 66.1 | <0.001 | |
| 2000—2005 | 1.31 | 17.5 | <0.001 | |
| 2005—2010 | 2.54 | 33.9 | <0.001 | |
| 2010—2015 | 1.73 | 23.2 | <0.001 | |
| 2015—2019 | 2.55 | 33.4 | <0.001 |
| 分类 | 区间段(年) | APC(%) | t值 | P值 |
|---|---|---|---|---|
| 男性 | 1990—2004 | -1.95 | -30.2 | <0.001 |
| 2004—2008 | -5.74 | -14.1 | <0.001 | |
| 2008—2016 | -4.14 | -47.1 | <0.001 | |
| 2016—2019 | -2.14 | -5.4 | <0.001 | |
| 女性 | 1990—2004 | -1.83 | -26.5 | <0.001 |
| 2004—2008 | -8.98 | -16.8 | <0.001 | |
| 2008—2013 | -7.87 | -33.2 | <0.001 | |
| 2013—2016 | -6.23 | -8.6 | <0.001 | |
| 2016—2019 | -0.41 | -0.9 | <0.001 | |
| 总体 | 1990—2004 | -1.72 | -32.6 | <0.001 |
| 2004—2007 | -7.82 | -9.5 | <0.001 | |
| 2007—2013 | -6.36 | -47.2 | <0.001 | |
| 2013—2016 | -5.04 | -9.4 | <0.001 | |
| 2016—2019 | -1.13 | -3.5 | <0.001 |
Table 3 Joinpoint regression analysis of standardized mortality of inflammatory bowel disease in China from 1990 to 2019
| 分类 | 区间段(年) | APC(%) | t值 | P值 |
|---|---|---|---|---|
| 男性 | 1990—2004 | -1.95 | -30.2 | <0.001 |
| 2004—2008 | -5.74 | -14.1 | <0.001 | |
| 2008—2016 | -4.14 | -47.1 | <0.001 | |
| 2016—2019 | -2.14 | -5.4 | <0.001 | |
| 女性 | 1990—2004 | -1.83 | -26.5 | <0.001 |
| 2004—2008 | -8.98 | -16.8 | <0.001 | |
| 2008—2013 | -7.87 | -33.2 | <0.001 | |
| 2013—2016 | -6.23 | -8.6 | <0.001 | |
| 2016—2019 | -0.41 | -0.9 | <0.001 | |
| 总体 | 1990—2004 | -1.72 | -32.6 | <0.001 |
| 2004—2007 | -7.82 | -9.5 | <0.001 | |
| 2007—2013 | -6.36 | -47.2 | <0.001 | |
| 2013—2016 | -5.04 | -9.4 | <0.001 | |
| 2016—2019 | -1.13 | -3.5 | <0.001 |
| 分类 | 区间段(年) | APC(%) | t值 | P值 |
|---|---|---|---|---|
| 男性 | 1990—1996 | -1.81 | -19.2 | <0.001 |
| 1996—2000 | 0.19 | 0.8 | <0.001 | |
| 2000—2004 | -1.11 | -5.3 | <0.001 | |
| 2004—2007 | -3.39 | -9.3 | <0.001 | |
| 2007—2015 | -2.49 | -54.5 | <0.001 | |
| 2015—2019 | -0.96 | -7.8 | <0.001 | |
| 女性 | 1990—1996 | -2.55 | -26.4 | <0.001 |
| 1996—2000 | -0.40 | -1.5 | <0.001 | |
| 2000—2004 | -2.97 | -11.7 | <0.001 | |
| 2004—2007 | -5.55 | -10.4 | <0.001 | |
| 2007—2015 | -3.83 | -46.5 | <0.001 | |
| 2015—2019 | -0.63 | -2.6 | <0.001 | |
| 总体 | 1990—1996 | -2.20 | -25.7 | <0.001 |
| 1996—2000 | -0.00 | 0.0 | <0.001 | |
| 2000—2004 | -1.95 | -8.7 | <0.001 | |
| 2004—2007 | -4.47 | -10.3 | <0.001 | |
| 2007—2015 | -3.16 | -49.1 | <0.001 | |
| 2015—2019 | -0.72 | -4.0 | <0.001 |
Table 4 Joinpoint regression analysis of standardized DALY rate of inflammatory bowel disease in China from 1990 to 2019
| 分类 | 区间段(年) | APC(%) | t值 | P值 |
|---|---|---|---|---|
| 男性 | 1990—1996 | -1.81 | -19.2 | <0.001 |
| 1996—2000 | 0.19 | 0.8 | <0.001 | |
| 2000—2004 | -1.11 | -5.3 | <0.001 | |
| 2004—2007 | -3.39 | -9.3 | <0.001 | |
| 2007—2015 | -2.49 | -54.5 | <0.001 | |
| 2015—2019 | -0.96 | -7.8 | <0.001 | |
| 女性 | 1990—1996 | -2.55 | -26.4 | <0.001 |
| 1996—2000 | -0.40 | -1.5 | <0.001 | |
| 2000—2004 | -2.97 | -11.7 | <0.001 | |
| 2004—2007 | -5.55 | -10.4 | <0.001 | |
| 2007—2015 | -3.83 | -46.5 | <0.001 | |
| 2015—2019 | -0.63 | -2.6 | <0.001 | |
| 总体 | 1990—1996 | -2.20 | -25.7 | <0.001 |
| 1996—2000 | -0.00 | 0.0 | <0.001 | |
| 2000—2004 | -1.95 | -8.7 | <0.001 | |
| 2004—2007 | -4.47 | -10.3 | <0.001 | |
| 2007—2015 | -3.16 | -49.1 | <0.001 | |
| 2015—2019 | -0.72 | -4.0 | <0.001 |
| 指标 | AAPC(95%CI)(%) | t值 | P值 |
|---|---|---|---|
| 标化发病率 | |||
| 男性 | 2.3(2.3,2.4) | 108.1 | <0.001 |
| 女性 | 2.7(2.6,2.9) | 33.0 | <0.001 |
| 合计 | 2.5(2.4,2.6) | 83.2 | <0.001 |
| 标化死亡率 | |||
| 男性 | -3.1(-3.3,-3.0) | -38.6 | <0.001 |
| 女性 | -4.2(-4.5,-4.0) | -33.0 | <0.001 |
| 合计 | -3.6(-3.8,-3.4) | -31.5 | <0.001 |
| 标化DALY率 | |||
| 男性 | -1.7(-1.8,-1.5) | -25.9 | <0.001 |
| 女性 | -2.7(-2.9,-2.6) | -30.8 | <0.001 |
| 合计 | -2.2(-2.3,-2.0) | -30.0 | <0.001 |
Table 5 Joinpoint regression analysis of inflammatory bowel disease burden
| 指标 | AAPC(95%CI)(%) | t值 | P值 |
|---|---|---|---|
| 标化发病率 | |||
| 男性 | 2.3(2.3,2.4) | 108.1 | <0.001 |
| 女性 | 2.7(2.6,2.9) | 33.0 | <0.001 |
| 合计 | 2.5(2.4,2.6) | 83.2 | <0.001 |
| 标化死亡率 | |||
| 男性 | -3.1(-3.3,-3.0) | -38.6 | <0.001 |
| 女性 | -4.2(-4.5,-4.0) | -33.0 | <0.001 |
| 合计 | -3.6(-3.8,-3.4) | -31.5 | <0.001 |
| 标化DALY率 | |||
| 男性 | -1.7(-1.8,-1.5) | -25.9 | <0.001 |
| 女性 | -2.7(-2.9,-2.6) | -30.8 | <0.001 |
| 合计 | -2.2(-2.3,-2.0) | -30.0 | <0.001 |
| 年龄(岁) | AAPC(95%CI)(%) | t值 | P值 |
|---|---|---|---|
| 15~19 | 2.7(2.5,2.9) | 28.5 | <0.001 |
| 20~24 | 2.9(2.7,3.0) | 50.0 | <0.001 |
| 25~29 | 2.8(2.7,2.9) | 46.0 | <0.001 |
| 30~34 | 2.6(2.5,2.8) | 37.7 | <0.001 |
| 35~39 | 2.6(2.5,2.6) | 101.1 | <0.001 |
| 40~44 | 2.5(2.5,2.6) | 88.5 | <0.001 |
| 45~49 | 2.5(2.4,2.6) | 81.5 | <0.001 |
| 50~54 | 2.4(2.4,2.5) | 79.7 | <0.001 |
| 55~59 | 2.3(2.2,2.3) | 106.3 | <0.001 |
| 60~64 | 2.2(2.2,2.3) | 95.6 | <0.001 |
| 65~69 | 2.2(2.1,2.2) | 81.2 | <0.001 |
| 70~74 | 2.1(2.0,2.1) | 69.4 | <0.001 |
| 75~79 | 1.9(1.8,2.0) | 47.2 | <0.001 |
| 80~84 | 1.8(1.7,1.9) | 50.4 | <0.001 |
| 85~89 | 1.7(1.6,1.8) | 38.0 | <0.001 |
| 90~94 | 1.7(1.6,1.7) | 49.2 | <0.001 |
| ≥95 | 1.6(1.5,1.7) | 41.0 | <0.001 |
Table 6 Age grouping of standardized incidence of inflammatory bowel disease in China from 1990 to 2019
| 年龄(岁) | AAPC(95%CI)(%) | t值 | P值 |
|---|---|---|---|
| 15~19 | 2.7(2.5,2.9) | 28.5 | <0.001 |
| 20~24 | 2.9(2.7,3.0) | 50.0 | <0.001 |
| 25~29 | 2.8(2.7,2.9) | 46.0 | <0.001 |
| 30~34 | 2.6(2.5,2.8) | 37.7 | <0.001 |
| 35~39 | 2.6(2.5,2.6) | 101.1 | <0.001 |
| 40~44 | 2.5(2.5,2.6) | 88.5 | <0.001 |
| 45~49 | 2.5(2.4,2.6) | 81.5 | <0.001 |
| 50~54 | 2.4(2.4,2.5) | 79.7 | <0.001 |
| 55~59 | 2.3(2.2,2.3) | 106.3 | <0.001 |
| 60~64 | 2.2(2.2,2.3) | 95.6 | <0.001 |
| 65~69 | 2.2(2.1,2.2) | 81.2 | <0.001 |
| 70~74 | 2.1(2.0,2.1) | 69.4 | <0.001 |
| 75~79 | 1.9(1.8,2.0) | 47.2 | <0.001 |
| 80~84 | 1.8(1.7,1.9) | 50.4 | <0.001 |
| 85~89 | 1.7(1.6,1.8) | 38.0 | <0.001 |
| 90~94 | 1.7(1.6,1.7) | 49.2 | <0.001 |
| ≥95 | 1.6(1.5,1.7) | 41.0 | <0.001 |
| 年龄(岁) | AAPC(95%CI)(%) | t值 | P值 |
|---|---|---|---|
| 15~19 | -4.2(-4.0,-4.4) | -48.4 | <0.001 |
| 20~24 | -3.4(-3.8,-3.0) | -16.1 | <0.001 |
| 25~29 | -3.8(-4.2,-3.3) | -16.8 | <0.001 |
| 30~34 | -3.7(-4.1,-3.2) | -15.4 | <0.001 |
| 35~39 | -3.8(-4.0,-3.5) | -25.4 | <0.001 |
| 40~44 | -3.5(-3.8,-3.3) | -26.6 | <0.001 |
| 45~49 | -3.7(-4.2,-3.2) | -14.0 | <0.001 |
| 50~54 | -3.6(-3.8,-3.4) | -31.6 | <0.001 |
| 55~59 | -3.4(-3.8,-3.1) | -19.9 | <0.001 |
| 60~64 | -3.4(-3.6,-3.2) | -29.6 | <0.001 |
| 65~69 | -3.3(-3.6,-3.2) | -27.7 | <0.001 |
| 70~74 | -3.4(-3.6,-3.2) | -48.3 | <0.001 |
| 75~79 | -3.5(-3.6,-3.2) | -33.3 | <0.001 |
| 80~84 | -3.7(-3.6,-3.2) | -19.2 | <0.001 |
| 85~89 | -3.5(-3.6,-3.2) | -22.7 | <0.001 |
| 90~94 | -3.3(-3.6,-3.2) | -20.3 | <0.001 |
| ≥95 | -2.5(-2.8,-2.1) | -14.8 | <0.001 |
Table 7 Age grouping of standardized mortality of inflammatory bowel disease in China from 1990 to 2019
| 年龄(岁) | AAPC(95%CI)(%) | t值 | P值 |
|---|---|---|---|
| 15~19 | -4.2(-4.0,-4.4) | -48.4 | <0.001 |
| 20~24 | -3.4(-3.8,-3.0) | -16.1 | <0.001 |
| 25~29 | -3.8(-4.2,-3.3) | -16.8 | <0.001 |
| 30~34 | -3.7(-4.1,-3.2) | -15.4 | <0.001 |
| 35~39 | -3.8(-4.0,-3.5) | -25.4 | <0.001 |
| 40~44 | -3.5(-3.8,-3.3) | -26.6 | <0.001 |
| 45~49 | -3.7(-4.2,-3.2) | -14.0 | <0.001 |
| 50~54 | -3.6(-3.8,-3.4) | -31.6 | <0.001 |
| 55~59 | -3.4(-3.8,-3.1) | -19.9 | <0.001 |
| 60~64 | -3.4(-3.6,-3.2) | -29.6 | <0.001 |
| 65~69 | -3.3(-3.6,-3.2) | -27.7 | <0.001 |
| 70~74 | -3.4(-3.6,-3.2) | -48.3 | <0.001 |
| 75~79 | -3.5(-3.6,-3.2) | -33.3 | <0.001 |
| 80~84 | -3.7(-3.6,-3.2) | -19.2 | <0.001 |
| 85~89 | -3.5(-3.6,-3.2) | -22.7 | <0.001 |
| 90~94 | -3.3(-3.6,-3.2) | -20.3 | <0.001 |
| ≥95 | -2.5(-2.8,-2.1) | -14.8 | <0.001 |
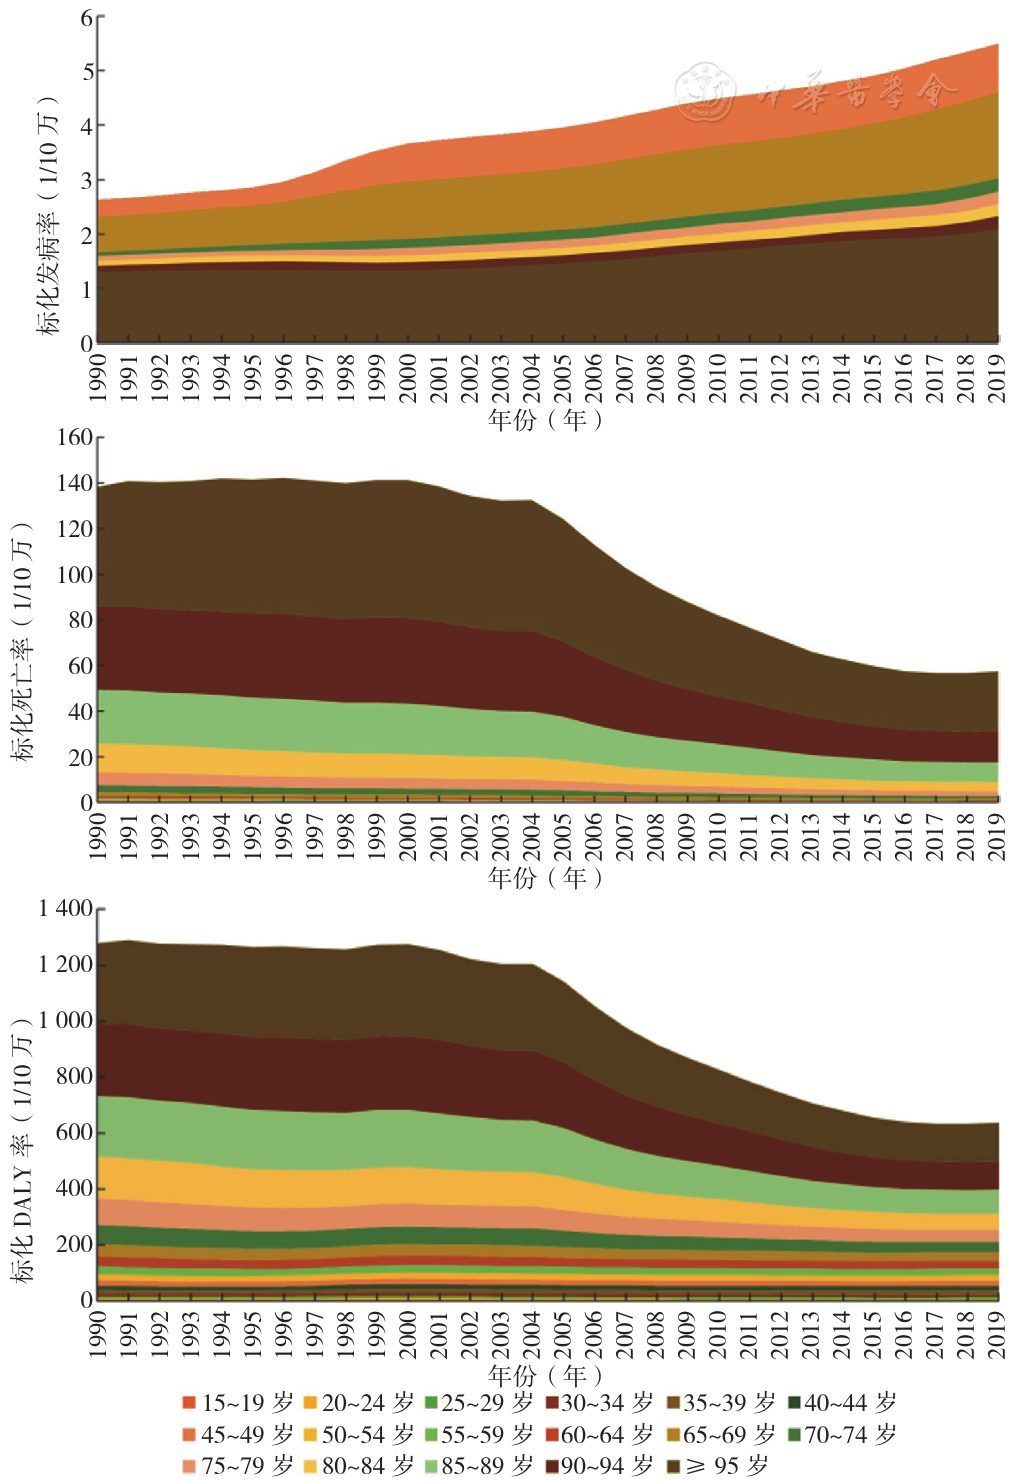
Figure 3 Disease burden variation tendency of inflammatory bowel disease by age from 1990 to 2019
| [1] |
|
| [2] |
|
| [3] |
|
| [4] |
|
| [5] |
|
| [6] |
|
| [7] |
张梦,吴丹,李艺星,等. 中国部分地区2004—2021年百日咳发病率趋势的Joinpoint回归分析[J]. 中国疫苗和免疫,2023,29(1):25-30. DOI:10.19914/j.CJVI.2023005.
|
| [8] |
|
| [9] |
|
| [10] | |
| [11] |
|
| [12] |
|
| [13] |
|
| [14] |
GBD Inflammatory Bowel Disease Collaborators. The global,regional,and national burden of inflammatory bowel disease in 195 countries and territories,1990-2017:a systematic analysis for the Global Burden of Disease Study 2017[J]. Lancet Gastroenterol Hepatol,2020,5(1):17-30. DOI:10.1016/S2468-1253(19)30333-4.
|
| [15] |
|
| [16] |
|
| [17] |
|
| [18] |
|
| [19] |
|
| [20] |
|
| [1] | ZHEN Rui, GU Xufang, GAO Shengwei, ZHANG Bowen, REN Zhenjuan, YANG Ruixuan. Burden of Cardiovascular Diseases Attributable to Metabolic Risk Factors in China 1990—2021 and Projected Trends from 2022 to 2035 [J]. Chinese General Practice, 2026, 29(15): 2077-2083. |
| [2] | YIN Tingting, TU Wenjing, BAI Yamei, HUANG Lina, LI Yiting, XU Guihua. Study on Healthy Dietary Recommendation Model for Inflammatory Bowel Disease Patients Based on Multi-objective Planning [J]. Chinese General Practice, 2026, 29(08): 1029-1036. |
| [3] | LI Shunan, ZHANG Shiyan, DENG Yanan, HU Danqing, ZHENG Yuxin, LI Danyang, LI Candong. An Analysis of Trends and Prediction of Disease Burden for Type 2 Diabetic Nephropathy from 1990 to 2021 in China [J]. Chinese General Practice, 2025, 28(33): 4214-4226. |
| [4] | ZHANG Yongqing, LI Na, GAO Yili, QIN Jiawen, YU Haiping, SHI Hui. Analysis on the Trend of Disease Burden of Hearing Loss in Middle-aged and Elderly People in China from 1990 to 2021 [J]. Chinese General Practice, 2025, 28(33): 4227-4233. |
| [5] | LIU Mingbo, HE Xinye, YANG Xiaohong, WANG Zengwu. Interpretation of Report on Cardiovascular Health and Diseases in China 2024 [J]. Chinese General Practice, 2025, 28(32): 3989-4008. |
| [6] | LUO Xinyu, LIU Jin, CHEN Hailong. Trend Analysis of the Changing Disease Burden of Pancreatitis in China and Worldwide from 1990 to 2021 and Prediction for 2022 to 2031 [J]. Chinese General Practice, 2025, 28(26): 3321-3327. |
| [7] | ZHANG Zhidong, JIN Hua, HU Jihong, JIANG Lu, WANG Li, LONG Kaichong, ZHANG Ronghua. Analysis and Prediction of the Incidence and Mortality Trends of Hypertensive Nephropathy in China from 1990 to 2021 [J]. Chinese General Practice, 2025, 28(18): 2262-2269. |
| [8] | ZHANG Bingqing, WANG Zhongkai, WU Changyong, SUN Huang, LI Ruijie, LIU Wenjie, LUO Yihua, ZHENG Lihui, PENG Yunzhu. Changes and Trend Prediction in the Global Burden of Congenital Heart Defects, 1990-2021 [J]. Chinese General Practice, 2025, 28(18): 2253-2261. |
| [9] | CHEN Xingchao, GAO Zhenhua, XU Shenggang, ZOU Yonggang, QIAN Jun, WEI Jiantong. Disease Burden of Osteoarthritis in the World, China, and Regions with Different Socio-demographic Index from 1990 to 2021 [J]. Chinese General Practice, 2025, 28(17): 2172-2178. |
| [10] | LING Yao, ZHANG Wenbin, WANG Shihong, CHEN Yongze, DONG Wenjiao, DENG Xingyu, DING Yuanlin. Trend Analysis and Forecasting Study on the Changing Disease Burden of Rheumatoid Arthritis in China, 1990-2021 [J]. Chinese General Practice, 2025, 28(15): 1914-1922. |
| [11] | XU Jun, GAO Yanan, XU Yaxin, YAO Ting, CHEN Yamei. Latent Profiles Analysis and Its Influencing Factors of Disease Burden in Patients with Inflammatory Bowel Disease [J]. Chinese General Practice, 2025, 28(14): 1744-1750. |
| [12] | LIAO Xingyu, TIAN Siyu, CHEN Min. The Disease Burden, Risk Factors and Predictive Analysis of Early-onset Colorectal Cancer of Different Genders between China and the World from 1990 to 2021 [J]. Chinese General Practice, 2025, 28(08): 1004-1011. |
| [13] | JIANG Shen, WU Jing, ZHOU Jiali, JIANG Denan, SUN Weidi, CHENG Siqing, ZHU Siyu, HOU Leying, SONG Peige. Progress in the Study of the Association between Adverse Childhood Experiences and the Prevalence of Hypertension in Adulthood [J]. Chinese General Practice, 2025, 28(03): 358-364. |
| [14] | WU Xia, ZHANG Yiyun, YAO Chengzhi, ZHAO Xiangling, XIONG Wenjing, RANG Weiqing. Trend and Prediction of Changes in the Disease Burden of Diet-related Ischemic Heart Disease in China, 1990-2021 [J]. Chinese General Practice, 2025, 28(03): 305-312. |
| [15] | LIU Mingbo, HE Xinye, YANG Xiaohong, WANG Zengwu. Interpretation of Report on Cardiovascular Health and Diseases in China 2023 [J]. Chinese General Practice, 2025, 28(01): 20-38. |
| Viewed | ||||||
|
Full text |
|
|||||
|
Abstract |
|
|||||
