
Chinese General Practice ›› 2023, Vol. 26 ›› Issue (36): 4581-4586.DOI: 10.12114/j.issn.1007-9572.2023.0220
• Article • Previous Articles Next Articles
Received:2023-04-02
Revised:2023-06-10
Published:2023-12-20
Online:2023-07-19
Contact:
YU Xiaohui
通讯作者:
于晓辉
作者简介:基金资助:
Add to citation manager EndNote|Ris|BibTeX
URL: https://www.chinagp.net/EN/10.12114/j.issn.1007-9572.2023.0220
| 性别 | 年份 | 发病率 | 死亡率 | DALY率 | |||
|---|---|---|---|---|---|---|---|
| 粗率 | 标化率 | 粗率 | 标化率 | 粗率 | 标化率 | ||
| 男性 | 1990年 | 1.71 | 1.72 | 0.42 | 0.94 | 18.21 | 24.06 |
| 2019年 | 3.99 | 3.35 | 0.35 | 0.47 | 17.71 | 18.45 | |
| 变化率(%) | 133.33 | 94.76 | -16.67 | -50.00 | -2.75 | -23.32 | |
| 女性 | 1990年 | 1.19 | 1.21 | 0.52 | 0.84 | 21.47 | 25.50 |
| 2019年 | 3.24 | 2.66 | 0.31 | 0.30 | 14.92 | 14.78 | |
| 变化率(%) | 172.27 | 119.83 | -40.38 | -64.29 | -30.51 | -42.04 | |
| 总人群 | 1990年 | 1.45 | 1.47 | 0.47 | 0.86 | 19.79 | 24.47 |
| 2019年 | 3.62 | 3.01 | 0.33 | 0.35 | 16.34 | 16.31 | |
| 变化率(%) | 149.66 | 104.76 | -29.79 | -59.30 | -17.43 | -33.35 | |
Table 1 Disease burden of inflammatory bowel disease in China from 1990 to 2019
| 性别 | 年份 | 发病率 | 死亡率 | DALY率 | |||
|---|---|---|---|---|---|---|---|
| 粗率 | 标化率 | 粗率 | 标化率 | 粗率 | 标化率 | ||
| 男性 | 1990年 | 1.71 | 1.72 | 0.42 | 0.94 | 18.21 | 24.06 |
| 2019年 | 3.99 | 3.35 | 0.35 | 0.47 | 17.71 | 18.45 | |
| 变化率(%) | 133.33 | 94.76 | -16.67 | -50.00 | -2.75 | -23.32 | |
| 女性 | 1990年 | 1.19 | 1.21 | 0.52 | 0.84 | 21.47 | 25.50 |
| 2019年 | 3.24 | 2.66 | 0.31 | 0.30 | 14.92 | 14.78 | |
| 变化率(%) | 172.27 | 119.83 | -40.38 | -64.29 | -30.51 | -42.04 | |
| 总人群 | 1990年 | 1.45 | 1.47 | 0.47 | 0.86 | 19.79 | 24.47 |
| 2019年 | 3.62 | 3.01 | 0.33 | 0.35 | 16.34 | 16.31 | |
| 变化率(%) | 149.66 | 104.76 | -29.79 | -59.30 | -17.43 | -33.35 | |
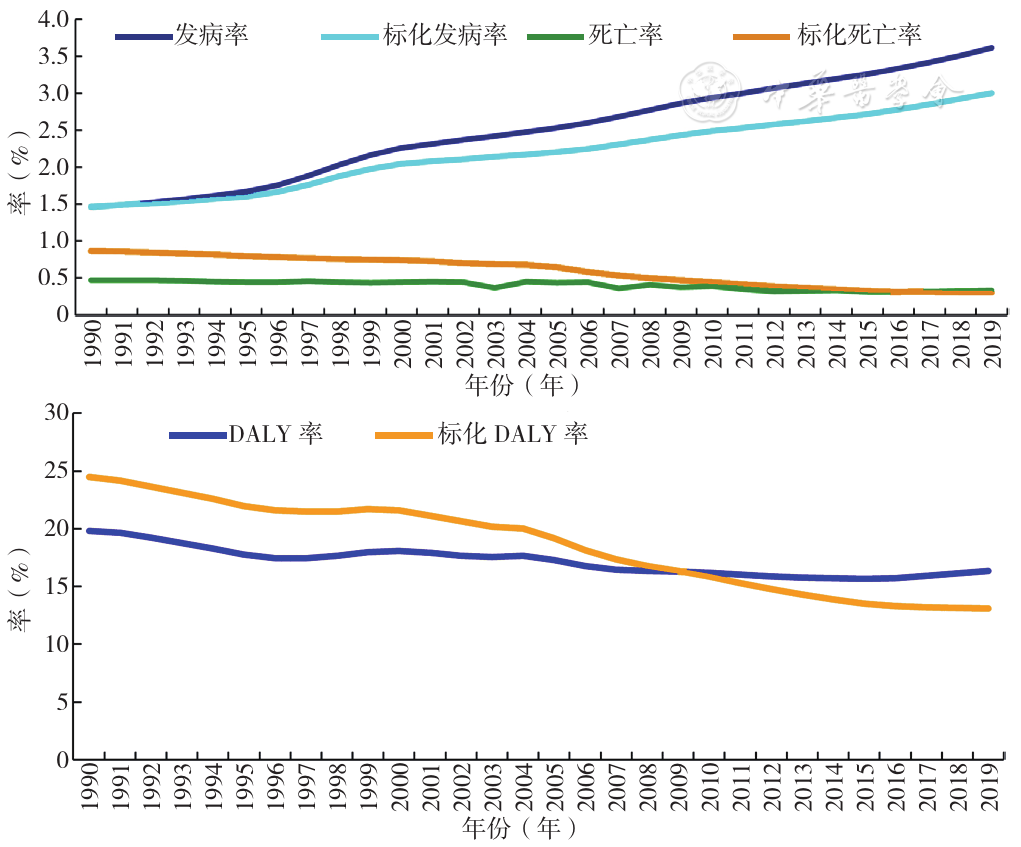
Figure 1 Disease burden of inflammatory bowel disease in China from 1990 to 2019
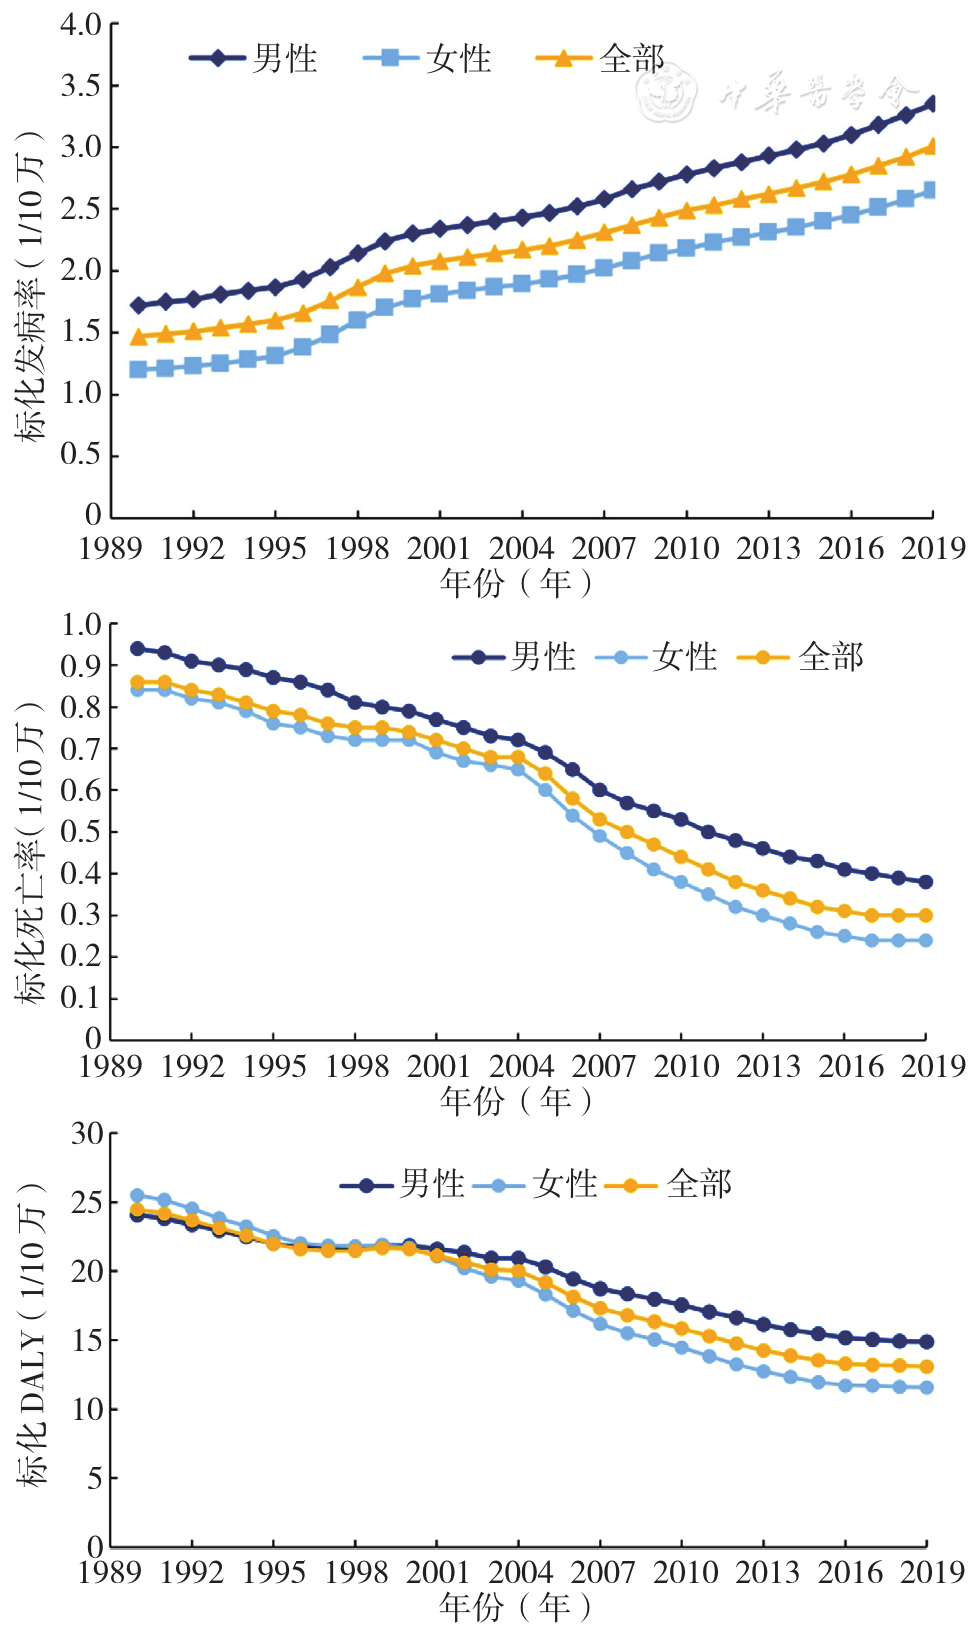
Figure 2 Joinpoint regression analysis of variation tendency of inflammatory bowel disease burden in different genders
| 分类 | 区间段(年) | APC(%) | t值 | P值 |
|---|---|---|---|---|
| 男性 | 1990—1996 | 1.86 | 77.1 | <0.001 |
| 1996—1999 | 5.66 | 42.7 | <0.001 | |
| 1999—2006 | 1.56 | 73.6 | <0.001 | |
| 2006—2009 | 2.77 | 22.0 | <0.001 | |
| 2009—2015 | 1.74 | 63.1 | <0.001 | |
| 2015—2019 | 2.52 | 62.9 | <0.001 | |
| 女性 | 1990—1995 | 1.63 | 6.8 | <0.001 |
| 1995—1999 | 7.19 | 13.9 | <0.001 | |
| 1999—2019 | 2.16 | 82.7 | <0.001 | |
| 总体 | 1990—1995 | 1.68 | 27.8 | <0.001 |
| 1995—2000 | 5.26 | 66.1 | <0.001 | |
| 2000—2005 | 1.31 | 17.5 | <0.001 | |
| 2005—2010 | 2.54 | 33.9 | <0.001 | |
| 2010—2015 | 1.73 | 23.2 | <0.001 | |
| 2015—2019 | 2.55 | 33.4 | <0.001 |
Table 2 Joinpoint regression analysis of standardized incidence of inflammatory bowel disease in China from 1990 to 2019
| 分类 | 区间段(年) | APC(%) | t值 | P值 |
|---|---|---|---|---|
| 男性 | 1990—1996 | 1.86 | 77.1 | <0.001 |
| 1996—1999 | 5.66 | 42.7 | <0.001 | |
| 1999—2006 | 1.56 | 73.6 | <0.001 | |
| 2006—2009 | 2.77 | 22.0 | <0.001 | |
| 2009—2015 | 1.74 | 63.1 | <0.001 | |
| 2015—2019 | 2.52 | 62.9 | <0.001 | |
| 女性 | 1990—1995 | 1.63 | 6.8 | <0.001 |
| 1995—1999 | 7.19 | 13.9 | <0.001 | |
| 1999—2019 | 2.16 | 82.7 | <0.001 | |
| 总体 | 1990—1995 | 1.68 | 27.8 | <0.001 |
| 1995—2000 | 5.26 | 66.1 | <0.001 | |
| 2000—2005 | 1.31 | 17.5 | <0.001 | |
| 2005—2010 | 2.54 | 33.9 | <0.001 | |
| 2010—2015 | 1.73 | 23.2 | <0.001 | |
| 2015—2019 | 2.55 | 33.4 | <0.001 |
| 分类 | 区间段(年) | APC(%) | t值 | P值 |
|---|---|---|---|---|
| 男性 | 1990—2004 | -1.95 | -30.2 | <0.001 |
| 2004—2008 | -5.74 | -14.1 | <0.001 | |
| 2008—2016 | -4.14 | -47.1 | <0.001 | |
| 2016—2019 | -2.14 | -5.4 | <0.001 | |
| 女性 | 1990—2004 | -1.83 | -26.5 | <0.001 |
| 2004—2008 | -8.98 | -16.8 | <0.001 | |
| 2008—2013 | -7.87 | -33.2 | <0.001 | |
| 2013—2016 | -6.23 | -8.6 | <0.001 | |
| 2016—2019 | -0.41 | -0.9 | <0.001 | |
| 总体 | 1990—2004 | -1.72 | -32.6 | <0.001 |
| 2004—2007 | -7.82 | -9.5 | <0.001 | |
| 2007—2013 | -6.36 | -47.2 | <0.001 | |
| 2013—2016 | -5.04 | -9.4 | <0.001 | |
| 2016—2019 | -1.13 | -3.5 | <0.001 |
Table 3 Joinpoint regression analysis of standardized mortality of inflammatory bowel disease in China from 1990 to 2019
| 分类 | 区间段(年) | APC(%) | t值 | P值 |
|---|---|---|---|---|
| 男性 | 1990—2004 | -1.95 | -30.2 | <0.001 |
| 2004—2008 | -5.74 | -14.1 | <0.001 | |
| 2008—2016 | -4.14 | -47.1 | <0.001 | |
| 2016—2019 | -2.14 | -5.4 | <0.001 | |
| 女性 | 1990—2004 | -1.83 | -26.5 | <0.001 |
| 2004—2008 | -8.98 | -16.8 | <0.001 | |
| 2008—2013 | -7.87 | -33.2 | <0.001 | |
| 2013—2016 | -6.23 | -8.6 | <0.001 | |
| 2016—2019 | -0.41 | -0.9 | <0.001 | |
| 总体 | 1990—2004 | -1.72 | -32.6 | <0.001 |
| 2004—2007 | -7.82 | -9.5 | <0.001 | |
| 2007—2013 | -6.36 | -47.2 | <0.001 | |
| 2013—2016 | -5.04 | -9.4 | <0.001 | |
| 2016—2019 | -1.13 | -3.5 | <0.001 |
| 分类 | 区间段(年) | APC(%) | t值 | P值 |
|---|---|---|---|---|
| 男性 | 1990—1996 | -1.81 | -19.2 | <0.001 |
| 1996—2000 | 0.19 | 0.8 | <0.001 | |
| 2000—2004 | -1.11 | -5.3 | <0.001 | |
| 2004—2007 | -3.39 | -9.3 | <0.001 | |
| 2007—2015 | -2.49 | -54.5 | <0.001 | |
| 2015—2019 | -0.96 | -7.8 | <0.001 | |
| 女性 | 1990—1996 | -2.55 | -26.4 | <0.001 |
| 1996—2000 | -0.40 | -1.5 | <0.001 | |
| 2000—2004 | -2.97 | -11.7 | <0.001 | |
| 2004—2007 | -5.55 | -10.4 | <0.001 | |
| 2007—2015 | -3.83 | -46.5 | <0.001 | |
| 2015—2019 | -0.63 | -2.6 | <0.001 | |
| 总体 | 1990—1996 | -2.20 | -25.7 | <0.001 |
| 1996—2000 | -0.00 | 0.0 | <0.001 | |
| 2000—2004 | -1.95 | -8.7 | <0.001 | |
| 2004—2007 | -4.47 | -10.3 | <0.001 | |
| 2007—2015 | -3.16 | -49.1 | <0.001 | |
| 2015—2019 | -0.72 | -4.0 | <0.001 |
Table 4 Joinpoint regression analysis of standardized DALY rate of inflammatory bowel disease in China from 1990 to 2019
| 分类 | 区间段(年) | APC(%) | t值 | P值 |
|---|---|---|---|---|
| 男性 | 1990—1996 | -1.81 | -19.2 | <0.001 |
| 1996—2000 | 0.19 | 0.8 | <0.001 | |
| 2000—2004 | -1.11 | -5.3 | <0.001 | |
| 2004—2007 | -3.39 | -9.3 | <0.001 | |
| 2007—2015 | -2.49 | -54.5 | <0.001 | |
| 2015—2019 | -0.96 | -7.8 | <0.001 | |
| 女性 | 1990—1996 | -2.55 | -26.4 | <0.001 |
| 1996—2000 | -0.40 | -1.5 | <0.001 | |
| 2000—2004 | -2.97 | -11.7 | <0.001 | |
| 2004—2007 | -5.55 | -10.4 | <0.001 | |
| 2007—2015 | -3.83 | -46.5 | <0.001 | |
| 2015—2019 | -0.63 | -2.6 | <0.001 | |
| 总体 | 1990—1996 | -2.20 | -25.7 | <0.001 |
| 1996—2000 | -0.00 | 0.0 | <0.001 | |
| 2000—2004 | -1.95 | -8.7 | <0.001 | |
| 2004—2007 | -4.47 | -10.3 | <0.001 | |
| 2007—2015 | -3.16 | -49.1 | <0.001 | |
| 2015—2019 | -0.72 | -4.0 | <0.001 |
| 指标 | AAPC(95%CI)(%) | t值 | P值 |
|---|---|---|---|
| 标化发病率 | |||
| 男性 | 2.3(2.3,2.4) | 108.1 | <0.001 |
| 女性 | 2.7(2.6,2.9) | 33.0 | <0.001 |
| 合计 | 2.5(2.4,2.6) | 83.2 | <0.001 |
| 标化死亡率 | |||
| 男性 | -3.1(-3.3,-3.0) | -38.6 | <0.001 |
| 女性 | -4.2(-4.5,-4.0) | -33.0 | <0.001 |
| 合计 | -3.6(-3.8,-3.4) | -31.5 | <0.001 |
| 标化DALY率 | |||
| 男性 | -1.7(-1.8,-1.5) | -25.9 | <0.001 |
| 女性 | -2.7(-2.9,-2.6) | -30.8 | <0.001 |
| 合计 | -2.2(-2.3,-2.0) | -30.0 | <0.001 |
Table 5 Joinpoint regression analysis of inflammatory bowel disease burden
| 指标 | AAPC(95%CI)(%) | t值 | P值 |
|---|---|---|---|
| 标化发病率 | |||
| 男性 | 2.3(2.3,2.4) | 108.1 | <0.001 |
| 女性 | 2.7(2.6,2.9) | 33.0 | <0.001 |
| 合计 | 2.5(2.4,2.6) | 83.2 | <0.001 |
| 标化死亡率 | |||
| 男性 | -3.1(-3.3,-3.0) | -38.6 | <0.001 |
| 女性 | -4.2(-4.5,-4.0) | -33.0 | <0.001 |
| 合计 | -3.6(-3.8,-3.4) | -31.5 | <0.001 |
| 标化DALY率 | |||
| 男性 | -1.7(-1.8,-1.5) | -25.9 | <0.001 |
| 女性 | -2.7(-2.9,-2.6) | -30.8 | <0.001 |
| 合计 | -2.2(-2.3,-2.0) | -30.0 | <0.001 |
| 年龄(岁) | AAPC(95%CI)(%) | t值 | P值 |
|---|---|---|---|
| 15~19 | 2.7(2.5,2.9) | 28.5 | <0.001 |
| 20~24 | 2.9(2.7,3.0) | 50.0 | <0.001 |
| 25~29 | 2.8(2.7,2.9) | 46.0 | <0.001 |
| 30~34 | 2.6(2.5,2.8) | 37.7 | <0.001 |
| 35~39 | 2.6(2.5,2.6) | 101.1 | <0.001 |
| 40~44 | 2.5(2.5,2.6) | 88.5 | <0.001 |
| 45~49 | 2.5(2.4,2.6) | 81.5 | <0.001 |
| 50~54 | 2.4(2.4,2.5) | 79.7 | <0.001 |
| 55~59 | 2.3(2.2,2.3) | 106.3 | <0.001 |
| 60~64 | 2.2(2.2,2.3) | 95.6 | <0.001 |
| 65~69 | 2.2(2.1,2.2) | 81.2 | <0.001 |
| 70~74 | 2.1(2.0,2.1) | 69.4 | <0.001 |
| 75~79 | 1.9(1.8,2.0) | 47.2 | <0.001 |
| 80~84 | 1.8(1.7,1.9) | 50.4 | <0.001 |
| 85~89 | 1.7(1.6,1.8) | 38.0 | <0.001 |
| 90~94 | 1.7(1.6,1.7) | 49.2 | <0.001 |
| ≥95 | 1.6(1.5,1.7) | 41.0 | <0.001 |
Table 6 Age grouping of standardized incidence of inflammatory bowel disease in China from 1990 to 2019
| 年龄(岁) | AAPC(95%CI)(%) | t值 | P值 |
|---|---|---|---|
| 15~19 | 2.7(2.5,2.9) | 28.5 | <0.001 |
| 20~24 | 2.9(2.7,3.0) | 50.0 | <0.001 |
| 25~29 | 2.8(2.7,2.9) | 46.0 | <0.001 |
| 30~34 | 2.6(2.5,2.8) | 37.7 | <0.001 |
| 35~39 | 2.6(2.5,2.6) | 101.1 | <0.001 |
| 40~44 | 2.5(2.5,2.6) | 88.5 | <0.001 |
| 45~49 | 2.5(2.4,2.6) | 81.5 | <0.001 |
| 50~54 | 2.4(2.4,2.5) | 79.7 | <0.001 |
| 55~59 | 2.3(2.2,2.3) | 106.3 | <0.001 |
| 60~64 | 2.2(2.2,2.3) | 95.6 | <0.001 |
| 65~69 | 2.2(2.1,2.2) | 81.2 | <0.001 |
| 70~74 | 2.1(2.0,2.1) | 69.4 | <0.001 |
| 75~79 | 1.9(1.8,2.0) | 47.2 | <0.001 |
| 80~84 | 1.8(1.7,1.9) | 50.4 | <0.001 |
| 85~89 | 1.7(1.6,1.8) | 38.0 | <0.001 |
| 90~94 | 1.7(1.6,1.7) | 49.2 | <0.001 |
| ≥95 | 1.6(1.5,1.7) | 41.0 | <0.001 |
| 年龄(岁) | AAPC(95%CI)(%) | t值 | P值 |
|---|---|---|---|
| 15~19 | -4.2(-4.0,-4.4) | -48.4 | <0.001 |
| 20~24 | -3.4(-3.8,-3.0) | -16.1 | <0.001 |
| 25~29 | -3.8(-4.2,-3.3) | -16.8 | <0.001 |
| 30~34 | -3.7(-4.1,-3.2) | -15.4 | <0.001 |
| 35~39 | -3.8(-4.0,-3.5) | -25.4 | <0.001 |
| 40~44 | -3.5(-3.8,-3.3) | -26.6 | <0.001 |
| 45~49 | -3.7(-4.2,-3.2) | -14.0 | <0.001 |
| 50~54 | -3.6(-3.8,-3.4) | -31.6 | <0.001 |
| 55~59 | -3.4(-3.8,-3.1) | -19.9 | <0.001 |
| 60~64 | -3.4(-3.6,-3.2) | -29.6 | <0.001 |
| 65~69 | -3.3(-3.6,-3.2) | -27.7 | <0.001 |
| 70~74 | -3.4(-3.6,-3.2) | -48.3 | <0.001 |
| 75~79 | -3.5(-3.6,-3.2) | -33.3 | <0.001 |
| 80~84 | -3.7(-3.6,-3.2) | -19.2 | <0.001 |
| 85~89 | -3.5(-3.6,-3.2) | -22.7 | <0.001 |
| 90~94 | -3.3(-3.6,-3.2) | -20.3 | <0.001 |
| ≥95 | -2.5(-2.8,-2.1) | -14.8 | <0.001 |
Table 7 Age grouping of standardized mortality of inflammatory bowel disease in China from 1990 to 2019
| 年龄(岁) | AAPC(95%CI)(%) | t值 | P值 |
|---|---|---|---|
| 15~19 | -4.2(-4.0,-4.4) | -48.4 | <0.001 |
| 20~24 | -3.4(-3.8,-3.0) | -16.1 | <0.001 |
| 25~29 | -3.8(-4.2,-3.3) | -16.8 | <0.001 |
| 30~34 | -3.7(-4.1,-3.2) | -15.4 | <0.001 |
| 35~39 | -3.8(-4.0,-3.5) | -25.4 | <0.001 |
| 40~44 | -3.5(-3.8,-3.3) | -26.6 | <0.001 |
| 45~49 | -3.7(-4.2,-3.2) | -14.0 | <0.001 |
| 50~54 | -3.6(-3.8,-3.4) | -31.6 | <0.001 |
| 55~59 | -3.4(-3.8,-3.1) | -19.9 | <0.001 |
| 60~64 | -3.4(-3.6,-3.2) | -29.6 | <0.001 |
| 65~69 | -3.3(-3.6,-3.2) | -27.7 | <0.001 |
| 70~74 | -3.4(-3.6,-3.2) | -48.3 | <0.001 |
| 75~79 | -3.5(-3.6,-3.2) | -33.3 | <0.001 |
| 80~84 | -3.7(-3.6,-3.2) | -19.2 | <0.001 |
| 85~89 | -3.5(-3.6,-3.2) | -22.7 | <0.001 |
| 90~94 | -3.3(-3.6,-3.2) | -20.3 | <0.001 |
| ≥95 | -2.5(-2.8,-2.1) | -14.8 | <0.001 |
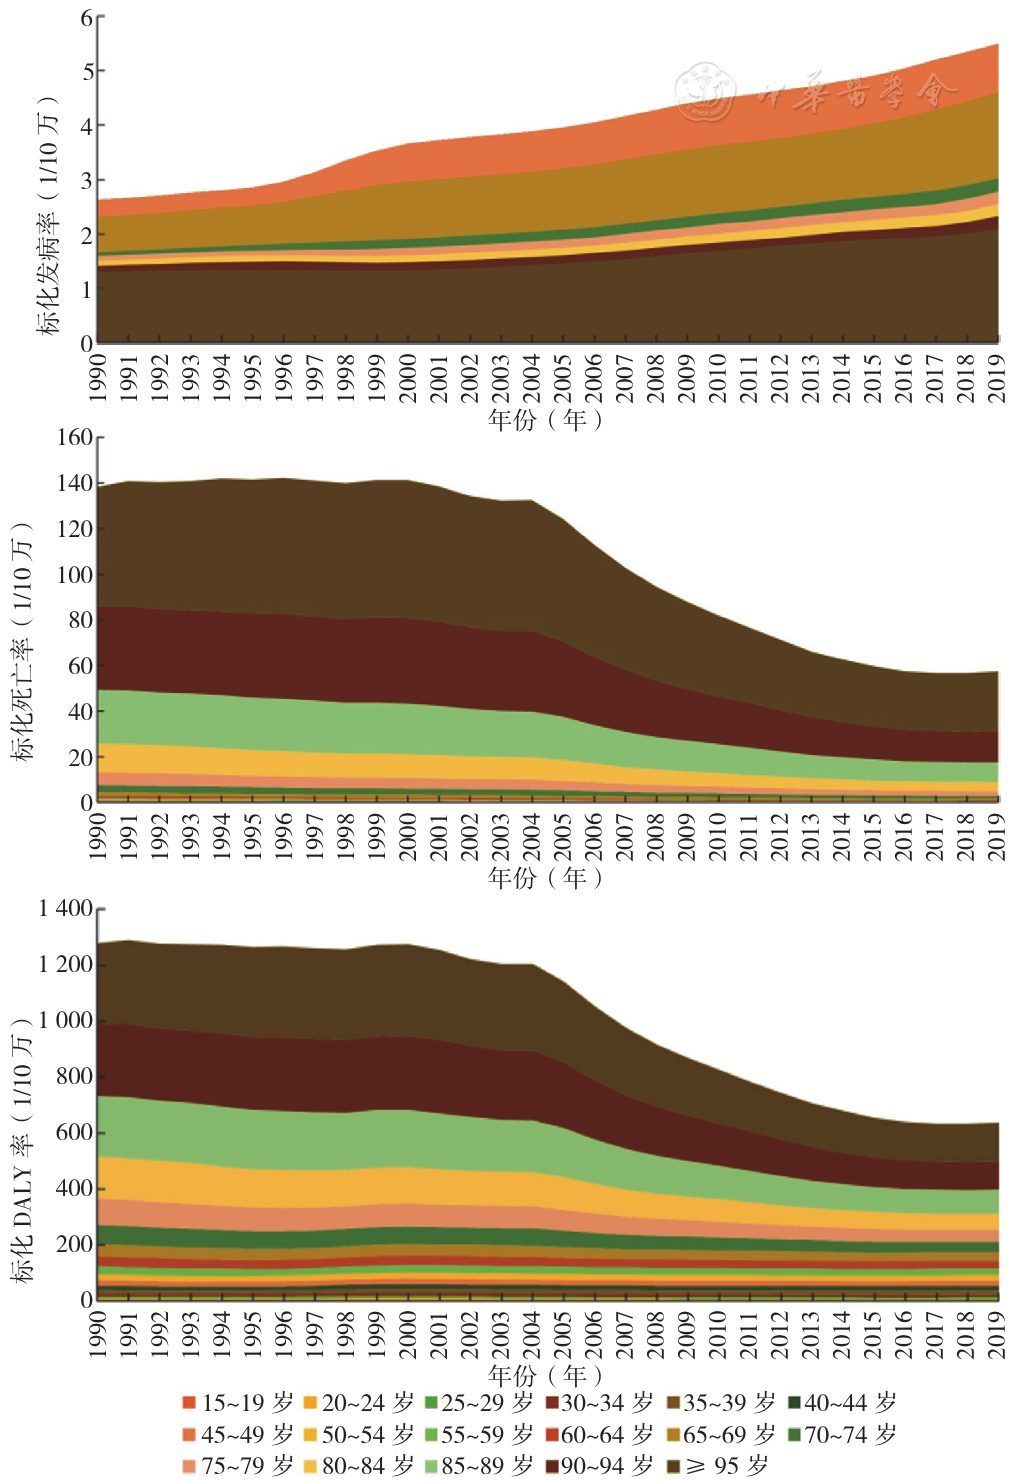
Figure 3 Disease burden variation tendency of inflammatory bowel disease by age from 1990 to 2019
| [1] |
|
| [2] |
|
| [3] |
|
| [4] |
|
| [5] |
|
| [6] |
|
| [7] |
张梦,吴丹,李艺星,等. 中国部分地区2004—2021年百日咳发病率趋势的Joinpoint回归分析[J]. 中国疫苗和免疫,2023,29(1):25-30. DOI:10.19914/j.CJVI.2023005.
|
| [8] |
|
| [9] |
|
| [10] | |
| [11] |
|
| [12] |
|
| [13] |
|
| [14] |
GBD Inflammatory Bowel Disease Collaborators. The global,regional,and national burden of inflammatory bowel disease in 195 countries and territories,1990-2017:a systematic analysis for the Global Burden of Disease Study 2017[J]. Lancet Gastroenterol Hepatol,2020,5(1):17-30. DOI:10.1016/S2468-1253(19)30333-4.
|
| [15] |
|
| [16] |
|
| [17] |
|
| [18] |
|
| [19] |
|
| [20] |
|
| [1] | JIANG Shen, WU Jing, ZHOU Jiali, JIANG Denan, SUN Weidi, CHENG Siqing, ZHU Siyu, HOU Leying, SONG Peige. Progress in the Study of the Association between Adverse Childhood Experiences and the Prevalence of Hypertension in Adulthood [J]. Chinese General Practice, 2025, 28(03): 358-364. |
| [2] | WU Xia, ZHANG Yiyun, YAO Chengzhi, ZHAO Xiangling, XIONG Wenjing, RANG Weiqing. Trend and Prediction of Changes in the Disease Burden of Diet-related Ischemic Heart Disease in China, 1990-2021 [J]. Chinese General Practice, 2025, 28(03): 305-312. |
| [3] | LIU Mingbo, HE Xinye, YANG Xiaohong, WANG Zengwu. Interpretation of Report on Cardiovascular Health and Diseases in China 2023 [J]. Chinese General Practice, 2025, 28(01): 20-38. |
| [4] | ZHANG Xinyue, ZHANG Liangwen, FANG Ya. A Long-term Study on the Long-term Impact of Demographic Factors on the Burden of Ischemic Heart Disease in China from 1990 to 2019 [J]. Chinese General Practice, 2024, 27(27): 3388-3394. |
| [5] | CHEN Siqi, XIAO Jin, TIAN Siyu, ZHANG Jia, WANG Shuting, ZHANG Xindan, ZHU Yan, CHEN Min. Progress of Research on Mechanism of Intestinal Nervous System Regulating Intestinal Inflammation Based on Intestinal Stem Cells [J]. Chinese General Practice, 2024, 27(23): 2858-2863. |
| [6] | MA Xuefeng, HUANG Jun, LI Na, SHAO Huijuan, LU Lixia, YU Xiaohui, ZHANG Jiucong. Analysis of Disease Burden and Annual Change Trends of Gastroesophageal Reflux Disease in China from 1990 to 2019 [J]. Chinese General Practice, 2024, 27(18): 2265-2271. |
| [7] | HUANG Gang, CAO Guiying, LIU Min. Current Situation and Trends in the Disease Burden of Dental Caries in China, 1990-2019 [J]. Chinese General Practice, 2024, 27(14): 1735-1741. |
| [8] | LIU Shanshan, LI Chuyi, ZHENG Ying, LU Lixia, LI Bin, YU Xiaohui, DANG Zheng. Disease Burden of Gallbladder Cancer in China from 1990 to 2019 and the Analysis of Its Future Trends [J]. Chinese General Practice, 2024, 27(14): 1742-1749. |
| [9] | QU Yuanyuan, CAO Miao, WANG Jing, CHENG Li, HE Xiaoshuang. Trends in Prevalence and Burden of Asthma and Its Risk Factors in China, 1990-2019 [J]. Chinese General Practice, 2024, 27(13): 1594-1600. |
| [10] | YIN Tingting, TU Wenjing, ZHANG Sumin, LI Yiting, XU Guihua. Correlation between Food Literacy and Avoidant/Restrictive Food Intake Disorder in Patients with Inflammatory Bowel Disease [J]. Chinese General Practice, 2024, 27(12): 1445-1451. |
| [11] | WANG Xueting, JIANG Yi. Disease Burden of Chronic Obstructive Pulmonary Disease in the BRICS Countries from 1990 to 2019 [J]. Chinese General Practice, 2024, 27(09): 1118-1125. |
| [12] | ZHOU Jingjing, HE Kaiyue, LIU Ailing, ZHAO Lanhui, GAO Jing, ZHOU Shangcheng. Impact of ICD-11 Inclusion of TCM Codes on the Global Burden of Disease [J]. Chinese General Practice, 2024, 27(06): 746-750. |
| [13] | ZHAO Lanhui, GAO Jing, ZHOU Shangcheng. Analysis of Traditional Chinese Medicine Constitutions Attributable to the Burden of Wasting Thirst Disorder among the Middle-aged and Older adults in Guangzhou Based on ICD-11 [J]. Chinese General Practice, 2024, 27(06): 751-757. |
| [14] | LUO Na, RUAN Yanqin, LEI Pingguang, WAN Chonghua, WAN Keyan, SONG Ying, CHEN Ying. Analysis of the Measurement Characteristics of Inflammatory Bowel Disease Patient-reported Outcomes Measurement Scale [J]. Chinese General Practice, 2023, 26(36): 4602-4607. |
| [15] | LIU Linbo, LIAO Zhijie, YANG Wenfan, BAI Dandan, WANG Dongmei, SHI Sen. Analysis of Gender Differences in Peripheral Arterial Disease Prevalence from 1990 to 2019 in China [J]. Chinese General Practice, 2023, 26(35): 4425-4432. |
| Viewed | ||||||
|
Full text |
|
|||||
|
Abstract |
|
|||||