
Chinese General Practice ›› 2023, Vol. 26 ›› Issue (16): 2013-2019.DOI: 10.12114/j.issn.1007-9572.2023.0009
Special Issue: 内分泌代谢性疾病最新文章合辑
• Original Research·Focus on Population Health • Previous Articles Next Articles
Received:2023-01-16
Revised:2023-03-15
Published:2023-06-05
Online:2023-03-23
Contact:
ZHOU Shangcheng
通讯作者:
周尚成
作者简介:基金资助:
Add to citation manager EndNote|Ris|BibTeX
URL: https://www.chinagp.net/EN/10.12114/j.issn.1007-9572.2023.0009
| 年份(年) | 粗发病率 | 标化发病率 | 粗死亡率 | 标化死亡率 |
|---|---|---|---|---|
| 1990 | 162.73 | 176.23 | 5.92 | 9.20 |
| 1991 | 169.77 | 182.00 | 5.88 | 9.02 |
| 1992 | 176.18 | 186.99 | 5.94 | 8.99 |
| 1993 | 181.88 | 191.06 | 6.04 | 9.02 |
| 1994 | 186.99 | 194.02 | 6.11 | 8.98 |
| 1995 | 190.85 | 195.78 | 6.21 | 8.98 |
| 1996 | 193.58 | 196.11 | 6.43 | 9.13 |
| 1997 | 195.10 | 195.36 | 6.63 | 9.23 |
| 1998 | 196.23 | 194.19 | 6.91 | 9.42 |
| 1999 | 197.92 | 193.29 | 7.28 | 9.71 |
| 2000 | 200.84 | 193.33 | 7.63 | 9.95 |
| 2001 | 207.64 | 196.58 | 7.99 | 10.20 |
| 2002 | 218.63 | 203.40 | 8.46 | 10.54 |
| 2003 | 231.56 | 211.57 | 8.86 | 10.74 |
| 2004 | 244.00 | 218.85 | 9.32 | 11.03 |
| 2005 | 253.23 | 222.99 | 9.59 | 11.10 |
| 2006 | 258.50 | 223.54 | 9.28 | 10.45 |
| 2007 | 261.56 | 222.25 | 9.16 | 10.04 |
| 2008 | 263.44 | 220.16 | 9.24 | 9.88 |
| 2009 | 265.25 | 218.38 | 9.43 | 9.85 |
| 2010 | 268.30 | 217.96 | 9.68 | 9.88 |
| 2011 | 272.83 | 219.18 | 9.85 | 9.79 |
| 2012 | 277.65 | 221.18 | 9.96 | 9.62 |
| 2013 | 281.99 | 223.27 | 10.15 | 9.54 |
| 2014 | 285.17 | 224.81 | 10.46 | 9.53 |
| 2015 | 286.32 | 225.11 | 10.69 | 9.45 |
| 2016 | 273.35 | 216.22 | 11.10 | 9.52 |
| 2017 | 259.74 | 206.90 | 11.43 | 9.51 |
| 2018 | 260.08 | 205.03 | 11.76 | 9.46 |
| 2019 | 265.45 | 204.31 | 12.16 | 9.44 |
Table 1 Diabetes incidence and deaths in China,1990—2019
| 年份(年) | 粗发病率 | 标化发病率 | 粗死亡率 | 标化死亡率 |
|---|---|---|---|---|
| 1990 | 162.73 | 176.23 | 5.92 | 9.20 |
| 1991 | 169.77 | 182.00 | 5.88 | 9.02 |
| 1992 | 176.18 | 186.99 | 5.94 | 8.99 |
| 1993 | 181.88 | 191.06 | 6.04 | 9.02 |
| 1994 | 186.99 | 194.02 | 6.11 | 8.98 |
| 1995 | 190.85 | 195.78 | 6.21 | 8.98 |
| 1996 | 193.58 | 196.11 | 6.43 | 9.13 |
| 1997 | 195.10 | 195.36 | 6.63 | 9.23 |
| 1998 | 196.23 | 194.19 | 6.91 | 9.42 |
| 1999 | 197.92 | 193.29 | 7.28 | 9.71 |
| 2000 | 200.84 | 193.33 | 7.63 | 9.95 |
| 2001 | 207.64 | 196.58 | 7.99 | 10.20 |
| 2002 | 218.63 | 203.40 | 8.46 | 10.54 |
| 2003 | 231.56 | 211.57 | 8.86 | 10.74 |
| 2004 | 244.00 | 218.85 | 9.32 | 11.03 |
| 2005 | 253.23 | 222.99 | 9.59 | 11.10 |
| 2006 | 258.50 | 223.54 | 9.28 | 10.45 |
| 2007 | 261.56 | 222.25 | 9.16 | 10.04 |
| 2008 | 263.44 | 220.16 | 9.24 | 9.88 |
| 2009 | 265.25 | 218.38 | 9.43 | 9.85 |
| 2010 | 268.30 | 217.96 | 9.68 | 9.88 |
| 2011 | 272.83 | 219.18 | 9.85 | 9.79 |
| 2012 | 277.65 | 221.18 | 9.96 | 9.62 |
| 2013 | 281.99 | 223.27 | 10.15 | 9.54 |
| 2014 | 285.17 | 224.81 | 10.46 | 9.53 |
| 2015 | 286.32 | 225.11 | 10.69 | 9.45 |
| 2016 | 273.35 | 216.22 | 11.10 | 9.52 |
| 2017 | 259.74 | 206.90 | 11.43 | 9.51 |
| 2018 | 260.08 | 205.03 | 11.76 | 9.46 |
| 2019 | 265.45 | 204.31 | 12.16 | 9.44 |
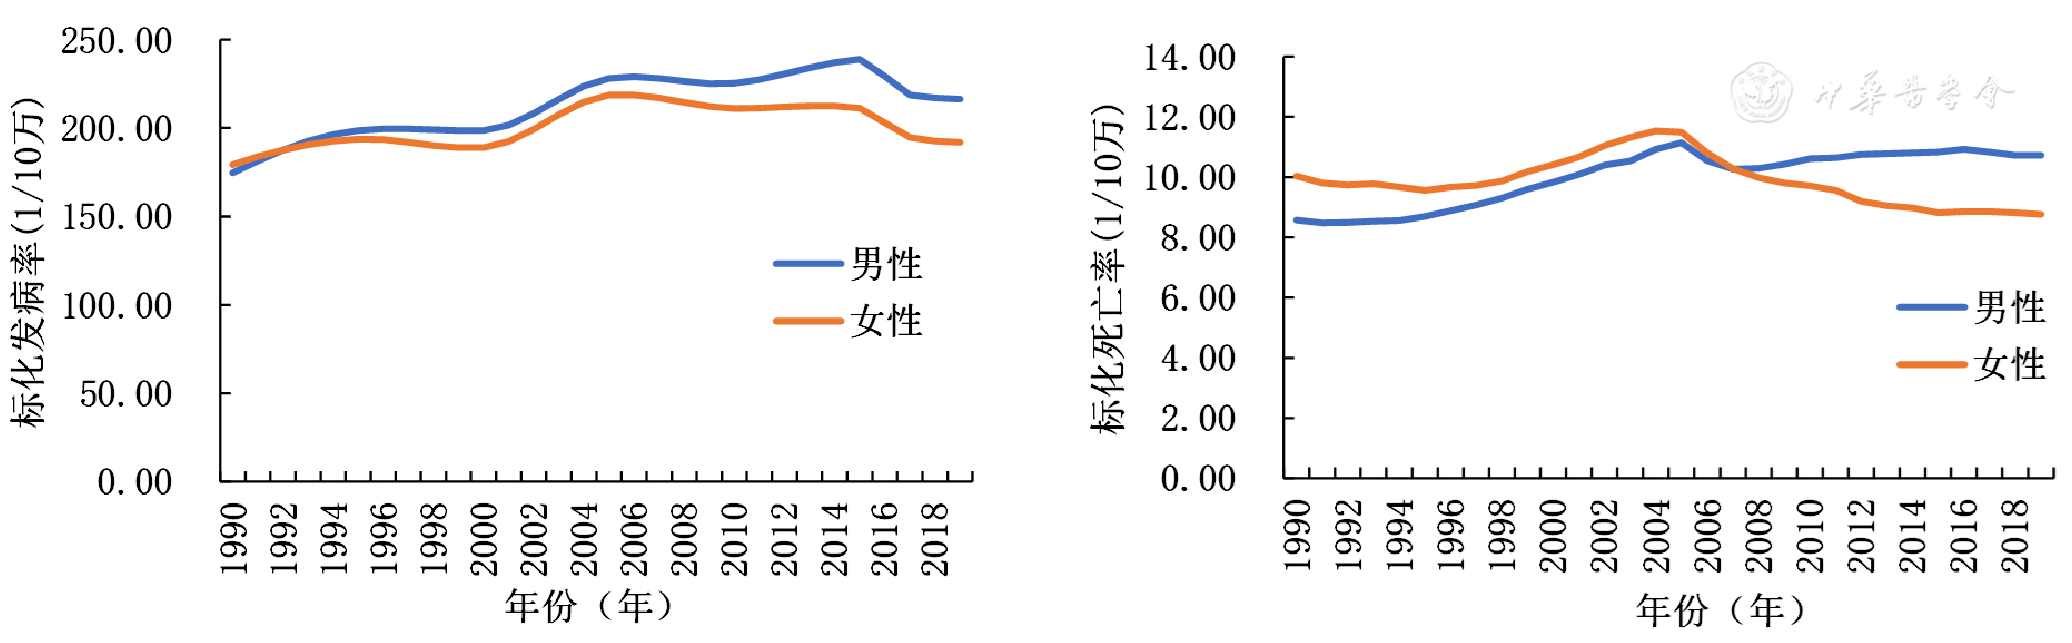
Figure 1 Diabetes morbidity and mortality by gender in China,1990—2019
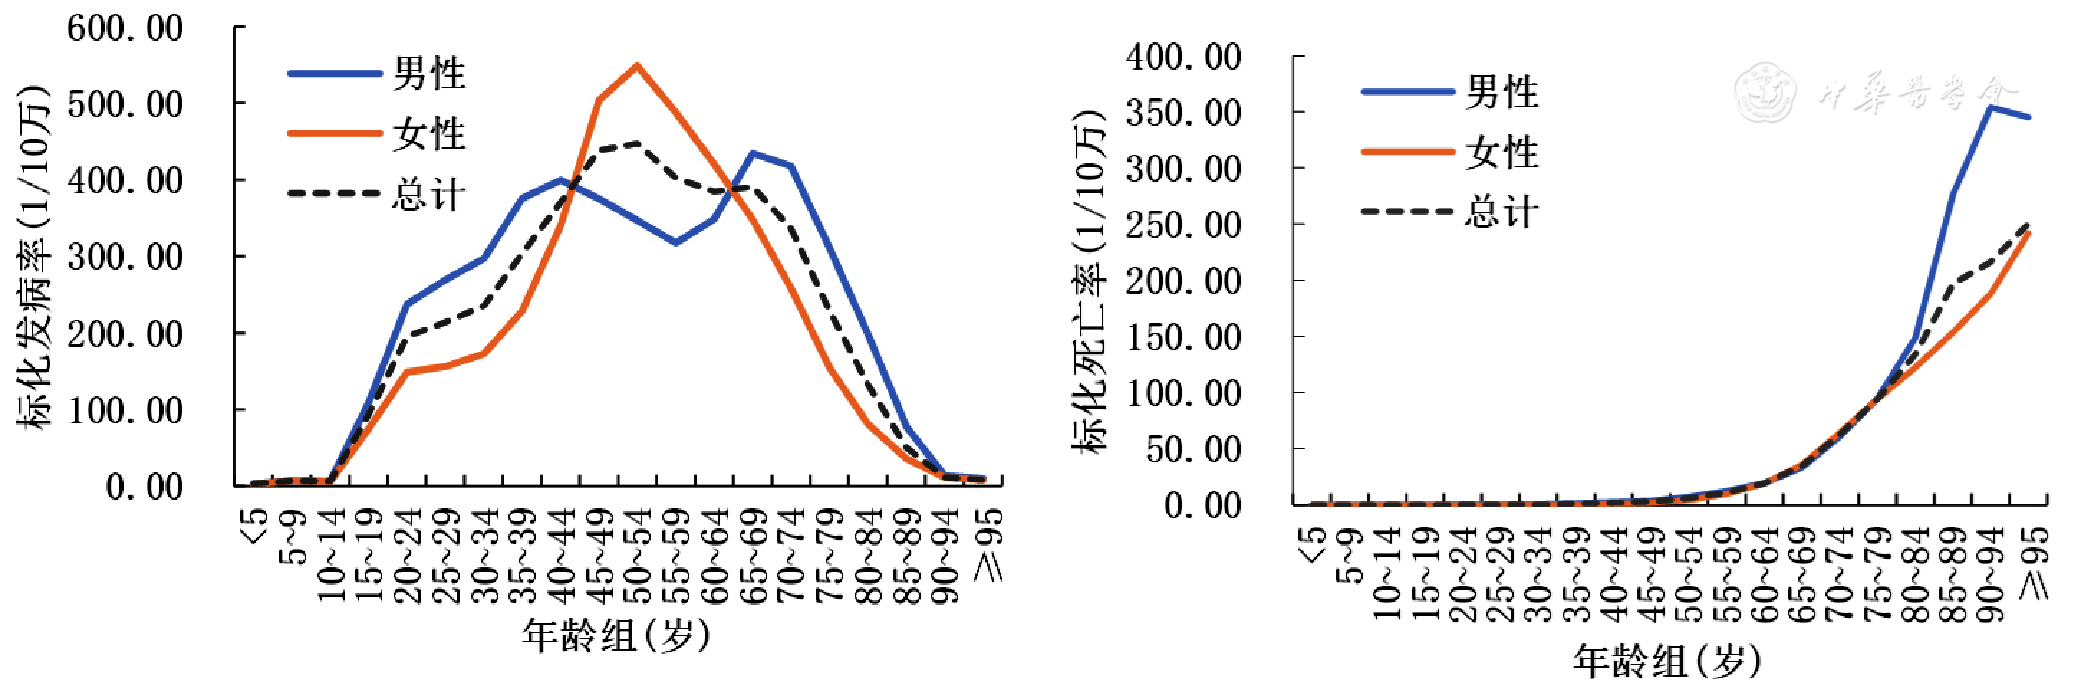
Figure 2 Trends in incidence and mortality rates of diabetes by age group and gender in China,2019
| 年份(年) | 男 | 女 | 总计 | ||||||
|---|---|---|---|---|---|---|---|---|---|
| YLL率 | YLD率 | DALY率 | YLL率 | YLD率 | DALY率 | YLL率 | YLD率 | DALY率 | |
| 1990 | 182.77 | 265.20 | 447.97 | 228.56 | 255.81 | 484.38 | 204.71 | 260.74 | 465.46 |
| 1991 | 179.78 | 275.92 | 455.70 | 222.13 | 259.88 | 482.01 | 199.92 | 267.96 | 467.88 |
| 1992 | 179.13 | 285.06 | 464.19 | 219.79 | 263.12 | 482.91 | 198.31 | 274.00 | 472.31 |
| 1993 | 178.69 | 292.33 | 471.01 | 219.58 | 265.57 | 485.14 | 197.93 | 278.72 | 476.65 |
| 1994 | 178.56 | 297.46 | 476.02 | 218.20 | 267.06 | 485.25 | 197.04 | 281.92 | 478.97 |
| 1995 | 180.71 | 300.12 | 480.83 | 215.85 | 267.47 | 483.32 | 196.87 | 283.38 | 480.25 |
| 1996 | 183.84 | 299.57 | 483.42 | 216.65 | 266.20 | 482.85 | 198.82 | 282.38 | 481.21 |
| 1997 | 186.54 | 296.47 | 483.01 | 216.63 | 263.32 | 479.95 | 200.05 | 279.27 | 479.33 |
| 1998 | 190.72 | 292.54 | 483.27 | 219.62 | 259.99 | 479.61 | 203.58 | 275.51 | 479.09 |
| 1999 | 195.69 | 289.45 | 485.14 | 224.42 | 257.34 | 481.75 | 208.45 | 272.53 | 480.98 |
| 2000 | 200.16 | 288.95 | 489.11 | 226.81 | 256.50 | 483.31 | 211.98 | 271.82 | 483.80 |
| 2001 | 203.66 | 296.40 | 500.06 | 229.60 | 263.27 | 492.87 | 215.13 | 278.98 | 494.12 |
| 2002 | 209.42 | 312.42 | 521.84 | 235.17 | 278.78 | 513.95 | 220.75 | 294.90 | 515.66 |
| 2003 | 211.55 | 331.50 | 543.05 | 238.95 | 297.48 | 536.43 | 223.71 | 313.98 | 537.69 |
| 2004 | 217.71 | 348.39 | 566.10 | 241.54 | 313.53 | 555.08 | 227.93 | 330.62 | 558.55 |
| 2005 | 219.76 | 357.70 | 577.46 | 238.63 | 321.32 | 559.95 | 227.37 | 339.25 | 566.62 |
| 2006 | 207.44 | 359.47 | 566.91 | 222.84 | 321.45 | 544.29 | 213.40 | 340.24 | 553.64 |
| 2007 | 200.61 | 358.33 | 558.94 | 210.38 | 319.23 | 529.61 | 203.71 | 338.59 | 542.29 |
| 2008 | 199.44 | 355.74 | 555.18 | 201.69 | 315.82 | 517.50 | 198.68 | 335.61 | 534.30 |
| 2009 | 199.38 | 353.02 | 552.40 | 195.52 | 312.11 | 507.62 | 195.41 | 332.42 | 527.83 |
| 2010 | 200.69 | 351.70 | 552.39 | 190.74 | 309.27 | 500.02 | 193.56 | 330.37 | 523.93 |
| 2011 | 199.10 | 352.76 | 551.86 | 185.51 | 307.14 | 492.65 | 190.01 | 329.82 | 519.84 |
| 2012 | 199.24 | 355.46 | 554.69 | 177.55 | 304.90 | 482.46 | 185.71 | 330.02 | 515.73 |
| 2013 | 198.18 | 358.49 | 556.66 | 172.74 | 302.53 | 475.26 | 182.63 | 330.30 | 512.94 |
| 2014 | 198.23 | 360.64 | 558.88 | 169.93 | 299.85 | 469.77 | 181.34 | 330.00 | 511.34 |
| 2015 | 198.05 | 360.72 | 558.77 | 166.28 | 296.82 | 463.10 | 179.36 | 328.51 | 507.87 |
| 2016 | 199.38 | 350.30 | 549.68 | 166.12 | 288.55 | 454.67 | 179.95 | 319.23 | 499.18 |
| 2017 | 198.41 | 337.89 | 536.30 | 165.60 | 279.67 | 445.27 | 179.49 | 308.65 | 488.14 |
| 2018 | 197.54 | 337.67 | 535.21 | 164.86 | 280.27 | 445.12 | 178.92 | 308.81 | 487.73 |
| 2019 | 197.55 | 344.86 | 542.41 | 163.86 | 288.17 | 452.02 | 178.45 | 316.30 | 494.76 |
Table 2 Burden of diabetes in China,1990—2019
| 年份(年) | 男 | 女 | 总计 | ||||||
|---|---|---|---|---|---|---|---|---|---|
| YLL率 | YLD率 | DALY率 | YLL率 | YLD率 | DALY率 | YLL率 | YLD率 | DALY率 | |
| 1990 | 182.77 | 265.20 | 447.97 | 228.56 | 255.81 | 484.38 | 204.71 | 260.74 | 465.46 |
| 1991 | 179.78 | 275.92 | 455.70 | 222.13 | 259.88 | 482.01 | 199.92 | 267.96 | 467.88 |
| 1992 | 179.13 | 285.06 | 464.19 | 219.79 | 263.12 | 482.91 | 198.31 | 274.00 | 472.31 |
| 1993 | 178.69 | 292.33 | 471.01 | 219.58 | 265.57 | 485.14 | 197.93 | 278.72 | 476.65 |
| 1994 | 178.56 | 297.46 | 476.02 | 218.20 | 267.06 | 485.25 | 197.04 | 281.92 | 478.97 |
| 1995 | 180.71 | 300.12 | 480.83 | 215.85 | 267.47 | 483.32 | 196.87 | 283.38 | 480.25 |
| 1996 | 183.84 | 299.57 | 483.42 | 216.65 | 266.20 | 482.85 | 198.82 | 282.38 | 481.21 |
| 1997 | 186.54 | 296.47 | 483.01 | 216.63 | 263.32 | 479.95 | 200.05 | 279.27 | 479.33 |
| 1998 | 190.72 | 292.54 | 483.27 | 219.62 | 259.99 | 479.61 | 203.58 | 275.51 | 479.09 |
| 1999 | 195.69 | 289.45 | 485.14 | 224.42 | 257.34 | 481.75 | 208.45 | 272.53 | 480.98 |
| 2000 | 200.16 | 288.95 | 489.11 | 226.81 | 256.50 | 483.31 | 211.98 | 271.82 | 483.80 |
| 2001 | 203.66 | 296.40 | 500.06 | 229.60 | 263.27 | 492.87 | 215.13 | 278.98 | 494.12 |
| 2002 | 209.42 | 312.42 | 521.84 | 235.17 | 278.78 | 513.95 | 220.75 | 294.90 | 515.66 |
| 2003 | 211.55 | 331.50 | 543.05 | 238.95 | 297.48 | 536.43 | 223.71 | 313.98 | 537.69 |
| 2004 | 217.71 | 348.39 | 566.10 | 241.54 | 313.53 | 555.08 | 227.93 | 330.62 | 558.55 |
| 2005 | 219.76 | 357.70 | 577.46 | 238.63 | 321.32 | 559.95 | 227.37 | 339.25 | 566.62 |
| 2006 | 207.44 | 359.47 | 566.91 | 222.84 | 321.45 | 544.29 | 213.40 | 340.24 | 553.64 |
| 2007 | 200.61 | 358.33 | 558.94 | 210.38 | 319.23 | 529.61 | 203.71 | 338.59 | 542.29 |
| 2008 | 199.44 | 355.74 | 555.18 | 201.69 | 315.82 | 517.50 | 198.68 | 335.61 | 534.30 |
| 2009 | 199.38 | 353.02 | 552.40 | 195.52 | 312.11 | 507.62 | 195.41 | 332.42 | 527.83 |
| 2010 | 200.69 | 351.70 | 552.39 | 190.74 | 309.27 | 500.02 | 193.56 | 330.37 | 523.93 |
| 2011 | 199.10 | 352.76 | 551.86 | 185.51 | 307.14 | 492.65 | 190.01 | 329.82 | 519.84 |
| 2012 | 199.24 | 355.46 | 554.69 | 177.55 | 304.90 | 482.46 | 185.71 | 330.02 | 515.73 |
| 2013 | 198.18 | 358.49 | 556.66 | 172.74 | 302.53 | 475.26 | 182.63 | 330.30 | 512.94 |
| 2014 | 198.23 | 360.64 | 558.88 | 169.93 | 299.85 | 469.77 | 181.34 | 330.00 | 511.34 |
| 2015 | 198.05 | 360.72 | 558.77 | 166.28 | 296.82 | 463.10 | 179.36 | 328.51 | 507.87 |
| 2016 | 199.38 | 350.30 | 549.68 | 166.12 | 288.55 | 454.67 | 179.95 | 319.23 | 499.18 |
| 2017 | 198.41 | 337.89 | 536.30 | 165.60 | 279.67 | 445.27 | 179.49 | 308.65 | 488.14 |
| 2018 | 197.54 | 337.67 | 535.21 | 164.86 | 280.27 | 445.12 | 178.92 | 308.81 | 487.73 |
| 2019 | 197.55 | 344.86 | 542.41 | 163.86 | 288.17 | 452.02 | 178.45 | 316.30 | 494.76 |
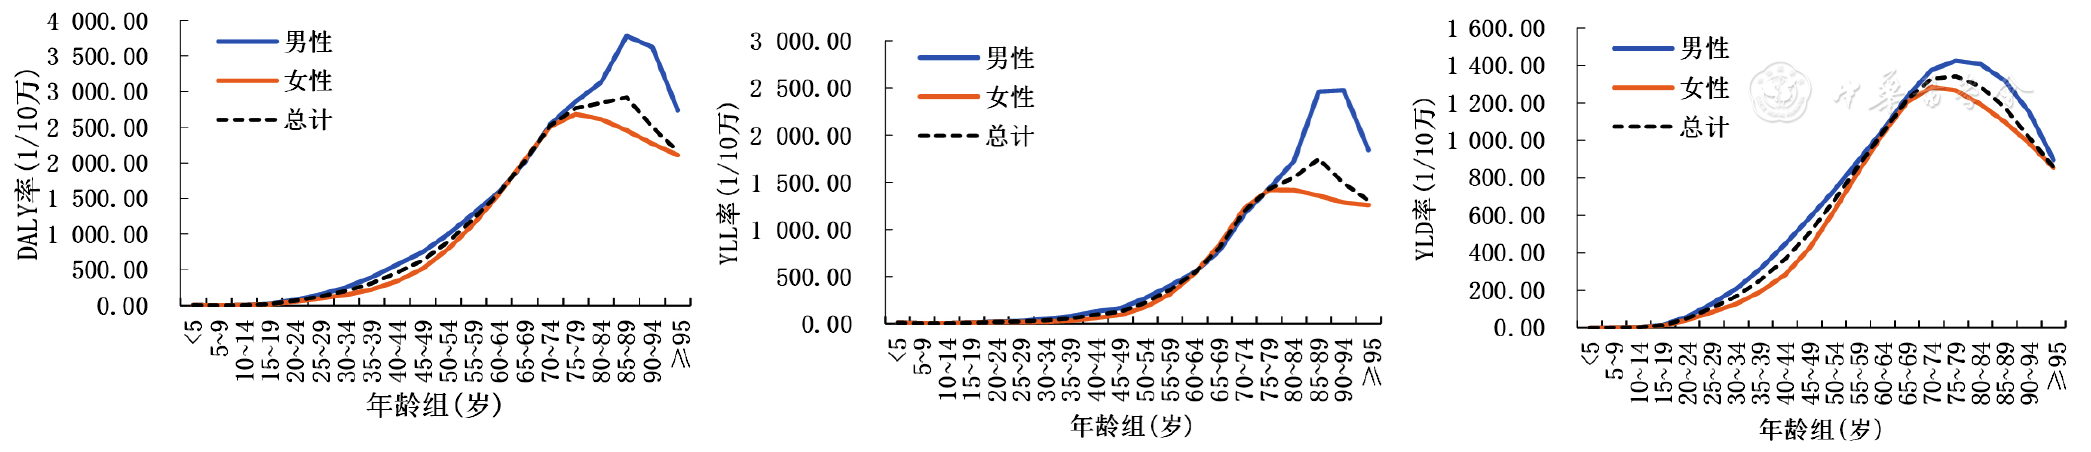
Figure 3 Trends in burden of diabetes by age group and gender in China,2019
| 年份(年) | 1型糖尿病 | 2型糖尿病 | ||||
|---|---|---|---|---|---|---|
| 标化发病率 | 标化死亡率 | DALY率 | 标化发病率 | 标化死亡率 | DALY率 | |
| 1990 | 1.96 | 0.57 | 29.65 | 174.27 | 8.63 | 435.81 |
| 1991 | 1.95 | 0.55 | 28.93 | 180.05 | 8.47 | 438.95 |
| 1992 | 1.94 | 0.55 | 28.70 | 185.05 | 8.44 | 443.61 |
| 1993 | 1.94 | 0.54 | 28.41 | 189.12 | 8.48 | 448.24 |
| 1994 | 1.94 | 0.55 | 28.94 | 192.08 | 8.43 | 450.03 |
| 1995 | 1.94 | 0.55 | 29.39 | 193.84 | 8.43 | 450.86 |
| 1996 | 1.95 | 0.55 | 29.27 | 194.16 | 8.57 | 451.94 |
| 1997 | 1.98 | 0.55 | 29.02 | 193.38 | 8.68 | 450.31 |
| 1998 | 2.01 | 0.56 | 29.48 | 192.18 | 8.86 | 449.61 |
| 1999 | 2.05 | 0.56 | 29.57 | 191.24 | 9.15 | 451.41 |
| 2000 | 2.09 | 0.56 | 29.15 | 191.24 | 9.40 | 454.66 |
| 2001 | 2.13 | 0.54 | 28.31 | 194.45 | 9.66 | 465.81 |
| 2002 | 2.19 | 0.52 | 27.05 | 201.21 | 10.02 | 488.61 |
| 2003 | 2.27 | 0.49 | 25.77 | 209.30 | 10.25 | 511.92 |
| 2004 | 2.34 | 0.47 | 25.13 | 216.51 | 10.55 | 533.42 |
| 2005 | 2.42 | 0.45 | 24.09 | 220.58 | 10.65 | 542.53 |
| 2006 | 2.49 | 0.42 | 22.96 | 221.05 | 10.04 | 530.68 |
| 2007 | 2.58 | 0.39 | 22.06 | 219.67 | 9.65 | 520.24 |
| 2008 | 2.67 | 0.37 | 21.54 | 217.49 | 9.51 | 512.75 |
| 2009 | 2.74 | 0.36 | 21.05 | 215.64 | 9.49 | 506.78 |
| 2010 | 2.78 | 0.34 | 20.46 | 215.17 | 9.54 | 503.47 |
| 2011 | 2.80 | 0.33 | 19.65 | 216.38 | 9.47 | 500.18 |
| 2012 | 2.80 | 0.31 | 18.78 | 218.38 | 9.31 | 496.96 |
| 2013 | 2.80 | 0.29 | 18.23 | 220.47 | 9.24 | 494.70 |
| 2014 | 2.79 | 0.29 | 17.89 | 222.01 | 9.24 | 493.45 |
| 2015 | 2.81 | 0.28 | 17.49 | 222.30 | 9.17 | 490.38 |
| 2016 | 2.84 | 0.27 | 17.39 | 213.38 | 9.25 | 481.78 |
| 2017 | 2.90 | 0.27 | 17.36 | 204.01 | 9.24 | 470.78 |
| 2018 | 3.03 | 0.27 | 17.68 | 202.00 | 9.19 | 470.05 |
| 2019 | 3.26 | 0.27 | 18.24 | 201.06 | 9.17 | 476.52 |
Table 3 Burden of type 1 and type 2 diabetes in China,1990—2019
| 年份(年) | 1型糖尿病 | 2型糖尿病 | ||||
|---|---|---|---|---|---|---|
| 标化发病率 | 标化死亡率 | DALY率 | 标化发病率 | 标化死亡率 | DALY率 | |
| 1990 | 1.96 | 0.57 | 29.65 | 174.27 | 8.63 | 435.81 |
| 1991 | 1.95 | 0.55 | 28.93 | 180.05 | 8.47 | 438.95 |
| 1992 | 1.94 | 0.55 | 28.70 | 185.05 | 8.44 | 443.61 |
| 1993 | 1.94 | 0.54 | 28.41 | 189.12 | 8.48 | 448.24 |
| 1994 | 1.94 | 0.55 | 28.94 | 192.08 | 8.43 | 450.03 |
| 1995 | 1.94 | 0.55 | 29.39 | 193.84 | 8.43 | 450.86 |
| 1996 | 1.95 | 0.55 | 29.27 | 194.16 | 8.57 | 451.94 |
| 1997 | 1.98 | 0.55 | 29.02 | 193.38 | 8.68 | 450.31 |
| 1998 | 2.01 | 0.56 | 29.48 | 192.18 | 8.86 | 449.61 |
| 1999 | 2.05 | 0.56 | 29.57 | 191.24 | 9.15 | 451.41 |
| 2000 | 2.09 | 0.56 | 29.15 | 191.24 | 9.40 | 454.66 |
| 2001 | 2.13 | 0.54 | 28.31 | 194.45 | 9.66 | 465.81 |
| 2002 | 2.19 | 0.52 | 27.05 | 201.21 | 10.02 | 488.61 |
| 2003 | 2.27 | 0.49 | 25.77 | 209.30 | 10.25 | 511.92 |
| 2004 | 2.34 | 0.47 | 25.13 | 216.51 | 10.55 | 533.42 |
| 2005 | 2.42 | 0.45 | 24.09 | 220.58 | 10.65 | 542.53 |
| 2006 | 2.49 | 0.42 | 22.96 | 221.05 | 10.04 | 530.68 |
| 2007 | 2.58 | 0.39 | 22.06 | 219.67 | 9.65 | 520.24 |
| 2008 | 2.67 | 0.37 | 21.54 | 217.49 | 9.51 | 512.75 |
| 2009 | 2.74 | 0.36 | 21.05 | 215.64 | 9.49 | 506.78 |
| 2010 | 2.78 | 0.34 | 20.46 | 215.17 | 9.54 | 503.47 |
| 2011 | 2.80 | 0.33 | 19.65 | 216.38 | 9.47 | 500.18 |
| 2012 | 2.80 | 0.31 | 18.78 | 218.38 | 9.31 | 496.96 |
| 2013 | 2.80 | 0.29 | 18.23 | 220.47 | 9.24 | 494.70 |
| 2014 | 2.79 | 0.29 | 17.89 | 222.01 | 9.24 | 493.45 |
| 2015 | 2.81 | 0.28 | 17.49 | 222.30 | 9.17 | 490.38 |
| 2016 | 2.84 | 0.27 | 17.39 | 213.38 | 9.25 | 481.78 |
| 2017 | 2.90 | 0.27 | 17.36 | 204.01 | 9.24 | 470.78 |
| 2018 | 3.03 | 0.27 | 17.68 | 202.00 | 9.19 | 470.05 |
| 2019 | 3.26 | 0.27 | 18.24 | 201.06 | 9.17 | 476.52 |
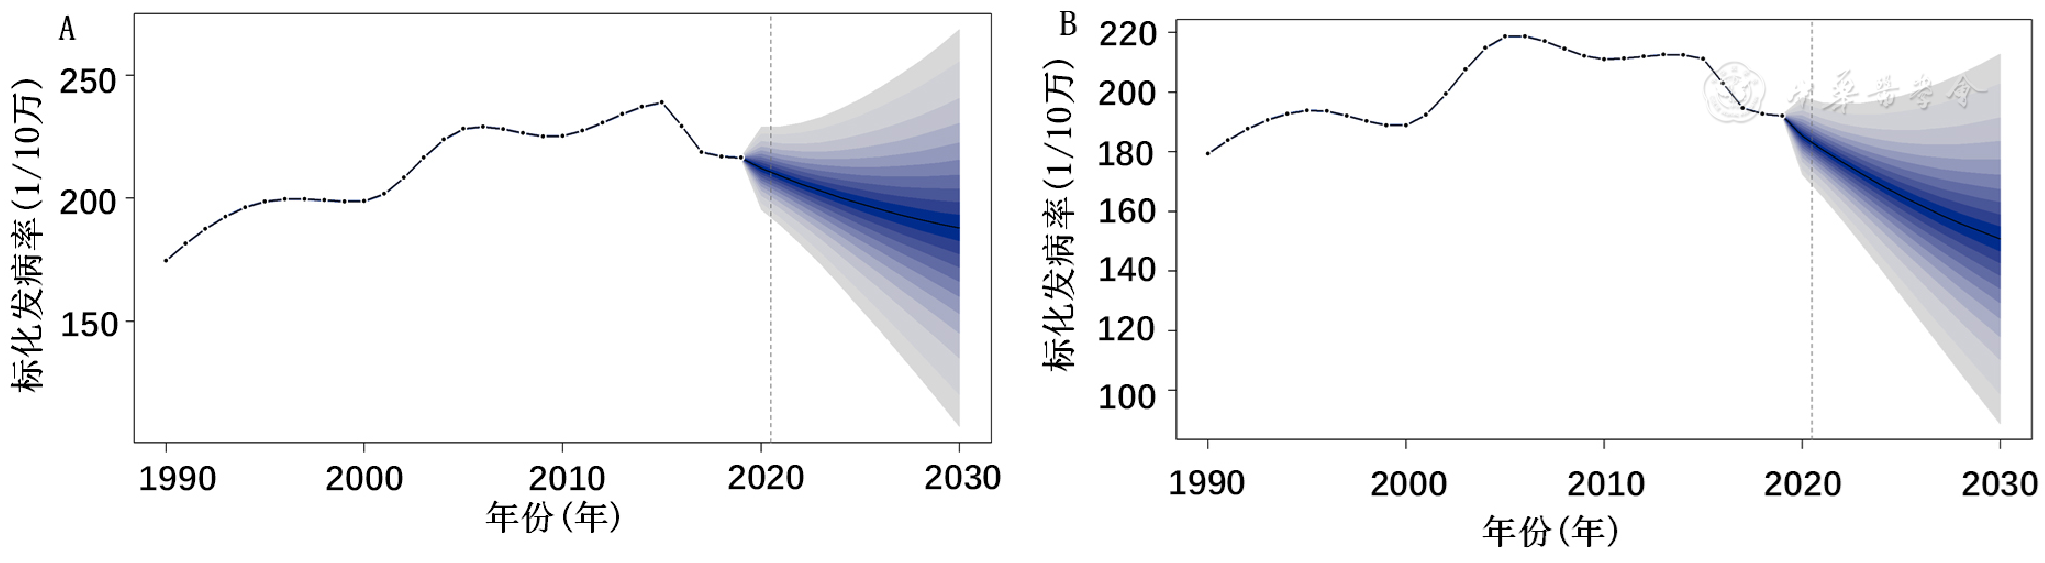
Figure 4 Predicted incidence of diabetes in China,2020—2030
| [1] | |
| [2] |
《中国心血管健康与疾病报告》编写组. 《中国心血管健康与疾病报告2020》概述[J]. 中国心血管病研究,2021,19(7):582-590. DOI:10.3969/j.issn.1672-5301.2021.07.002.
|
| [3] |
丁贤彬,毛德强,焦艳,等. 重庆市糖尿病患病率、死亡率及伤残调整寿命年率分析[J]. 上海交通大学学报(医学版),2021,41(1):78-81. DOI:10.3969/j.issn.1674-8115.2021.01.014.
|
| [4] |
陈文婕,钱永刚,初迪,等. 1990—2019年内蒙古自治区糖尿病疾病负担趋势研究[J]. 疾病监测,2022,37(6):826-831. DOI:10.3784/jbjc.202110150546.
|
| [5] |
官昊宇,俞浩,罗鹏飞,等. 1990—2019年江苏省居民2型糖尿病疾病负担及其变化趋势分析[J]. 中国慢性病预防与控制,2022,30(9):666-671. DOI:10.16386/j.cjpccd.issn.1004-6194.2022.09.006.
|
| [6] |
徐英,李志学,马艳,等. 1990—2019年中国成年人归因于2型糖尿病的癌症疾病负担研究[J]. 中国肿瘤,2022,31(12):959-966.
|
| [7] |
GBD Risk Factors Collaborators. Global burden of 87 risk factors in 204 countries and territories,1990—2019:a systematic analysis for the Global Burden of Disease Study 2019[J]. Lancet,2020,396(10258):1223-1249. DOI:10.1016/S0140-6736(20)30752-2.
|
| [8] |
|
| [9] |
杨明,汪舒文,宇传华. 1990—2019年中国皮肤恶性肿瘤疾病负担状况及发病趋势预测[J]. 中国肿瘤,2022,31(11):853-861. DOI:10.11735/j.issn.1004-0242.2022.11.A002.
|
| [10] |
GBD. Global fertility,mortality,migration,and population forecasts 2017—2100[EB/OL]. [2022-11-15].
|
| [11] |
郑荣寿,陈万青. 基于贝叶斯方法的年龄-时期-队列预测模型的介绍[J]. 中华预防医学杂志,2012,46(7):648-650. DOI:10.3760/cma.j.issn.0253-9624.2012.07.016.
|
| [12] |
许晴晴,严永富,陈浩,等. 中国四大慢性病死亡率可持续发展目标实现的预测研究[J]. 中华流行病学杂志,2022,43(6):878-884. DOI:10.3760/cma.j.cn112338-20211028-00830.
|
| [13] |
International Diabetes Federation. IDF diabetes atlas[EB/OL]. [2022-11-15].
|
| [14] |
|
| [15] |
黎倩欣,周尚成,陈飘飘,等. 深圳市糖尿病疾病经济负担研究[J]. 卫生经济研究,2021,38(3):63-66. DOI:10.14055/j.cnki.33-1056/f.2021.03.032.
|
| [16] |
王俊,王丽丹,江启成,等. 我国糖尿病直接医疗费用研究系统评价[J]. 现代预防医学,2018,45(3):462-466,490.
|
| [17] | |
| [18] |
彭莉,韩攀. Ⅱ型糖尿病患者的体力活动水平、静坐时间与其糖脂代谢的关系[J]. 现代预防医学,2017,44(23):4391-4394.
|
| [19] |
姜莹莹,刘敏,吉宁,等. 1990—2016年中国高BMI导致的糖尿病疾病负担研究[J]. 中华流行病学杂志,2019,40(1):46-51. DOI:10.3760/cma.j.issn.0254-6450.2019.01.010.
|
| [20] |
|
| [21] |
|
| [22] |
|
| [23] |
袁晓霞,钟艾霖,周尚成,等. 2017—2019年广州市糖尿病早死概率及疾病负担分析[J]. 现代预防医学,2021,48(5):784-788.
|
| [24] |
| [1] | MA Juan, MA Shengzong, YAN Ru, MA Xueping, JIA Shaobin. Predictive Effect of C-reactive Protein Albumin Ratio on Long-term Adverse Cardiovascular Events in Patients with Type 2 Diabetes Mellitus and Acute Myocardial Infarction [J]. Chinese General Practice, 2025, 28(06): 705-712. |
| [2] | SUN Zhenzhen, CUI Qian, LOU Qingqing, CHEN Xiaodong, FANG Dan, YAO Ping, YUAN Xiaodan. Effect of Physical Activities on the Carotid Intima-media Thickening in Patients with Type 2 Diabetes Mellitus [J]. Chinese General Practice, 2025, 28(06): 697-704. |
| [3] | WANG Rui, OUYANG Lina, WU Qian, NIU Yuanyuan, LI Guilan, ZHU Li. The Value of CT-FFR in Predicting Major Adverse Cardiovascular Events in Patients with Obstructive Coronary Artery Disease [J]. Chinese General Practice, 2025, 28(06): 713-719. |
| [4] | ZHU Ling, ZHAO Fouxi, WANG Jiangtao, DU Yu, WU Yanli, ZHANG Ji, LIU Tao. Hypertriglyceridemic-waist Phenotype and the Risk of Type 2 Diabetes Mellitus: a Prospective Cohort Study [J]. Chinese General Practice, 2025, 28(06): 681-687. |
| [5] | ZHU Lu, AI Jun, LIAO Shengwu, HUANG Shuting, GONG Nirong, KONG Yaozhong, LIU Dehui, DOU Xianrui, ZHANG Guangqing. Association of Prognostic Nutritional Index with Cardiovascular Mortality in Patients with Peritoneal Dialysis: a Multicenter Retrospective Cohort Study [J]. Chinese General Practice, 2025, 28(05): 568-574. |
| [6] | JIA Honghong, DU Qiuhui, ZHANG Zichen, ZHOU Yuqiu. Study on the Application of O2O Peer Tutor Collaborative Health Management Program in Rural Diabetes Patients with Non-standard Treatment [J]. Chinese General Practice, 2025, 28(04): 476-481. |
| [7] | WANG Xiaoru, LI Yueping. The Mediating Effect of Core Attributes of General Practice between Basic Public Health Service and Self-management Behaviors in Patients with Type 2 Diabetes Mellitus [J]. Chinese General Practice, 2025, 28(04): 470-475. |
| [8] | LAI Fengxia, WANG Shihong, ZHAO Le, HUANG Ruixian, YANG Zihua, ZHANG Zhiyi, KONG Danli, DING Yuanlin. Analysis and Prediction of Incidence and Mortality Trends of Three Enteric Infectious Diseases in China from 1990 to 2019 [J]. Chinese General Practice, 2025, 28(03): 313-319. |
| [9] | WU Xia, ZHANG Yiyun, YAO Chengzhi, ZHAO Xiangling, XIONG Wenjing, RANG Weiqing. Trend and Prediction of Changes in the Disease Burden of Diet-related Ischemic Heart Disease in China, 1990-2021 [J]. Chinese General Practice, 2025, 28(03): 305-312. |
| [10] | LIU Qingping, KE Juzhong, SONG Jiahui, GAO Jiaojiao, LI Zhitao, WANG Xiaonan, QIU Hua, ZHOU Yi, RUAN Xiaonan, WU Kang. Trend of Onset Time of Diabetes Mellitus and Its Correlation with Chinese Visceral Adiposity Index: a Prospective Cohort Study [J]. Chinese General Practice, 2025, 28(02): 183-192. |
| [11] | LIU Mingbo, HE Xinye, YANG Xiaohong, WANG Zengwu. Interpretation of Report on Cardiovascular Health and Diseases in China 2023 [J]. Chinese General Practice, 2025, 28(01): 20-38. |
| [12] | ZHANG Lianfang, ZHENG Yabin, LIN Xuefeng, XIE Rongcheng, MA Jiefei. Clinical Predictive Value of Immature Platelet Fraction Combined with Other Biomarkers for the Severity and Prognosis of Sepsis [J]. Chinese General Practice, 2024, 27(35): 4417-4425. |
| [13] | CAO Chenchen, LIU Zhigang, LIU Shimeng, ZHENG Lyuyun, XUE Wenjing, CHEN Yingyao, LIU Jing. The Differences in Second-line Medication Preferences for T2DM Patients between North and South China [J]. Chinese General Practice, 2024, 27(34): 4264-4272. |
| [14] | LU Wei, YANG Yunsong, LIN Lianmei, LIU Qiong, ZHAO Min, LI Jia, LIANG Fengxia, WU Song. The Idea of Kidney Tonifying Therapy for Spermatogenesis Disorder in Type 2 Diabetes Mellitus Based on the Hypothalamic-pituitary-gonadal Axis [J]. Chinese General Practice, 2024, 27(33): 4210-4214. |
| [15] | YANG Tianyi, SITU Xuanming, QUMU Shiwei, WANG Siyuan, JIANG Shan, YANG Ting. Predictive Value of the Oxygen Desaturation Induced by the 30-second Sit-to-stand-test combined with COPD Patient Self-assessment Test in Exercise-induced Hypoxemia and Its Clinical Application [J]. Chinese General Practice, 2024, 27(33): 4119-4124. |
| Viewed | ||||||
|
Full text |
|
|||||
|
Abstract |
|
|||||