
Chinese General Practice ›› 2023, Vol. 26 ›› Issue (04): 417-425.DOI: 10.12114/j.issn.1007-9572.2022.0612
• Original Research·Focus on Population Health • Previous Articles Next Articles
Received:2022-08-17
Revised:2022-11-14
Published:2023-02-05
Online:2022-12-12
Contact:
YAO Weiguang
About author:
通讯作者:
姚卫光
作者简介:基金资助:
Add to citation manager EndNote|Ris|BibTeX
URL: https://www.chinagp.net/EN/10.12114/j.issn.1007-9572.2022.0612
| 年份(年) | 伤寒与副伤寒 | 病毒性肝炎 | 痢疾 | 总发病例数(例) | 总发病率(1/105) | |||
|---|---|---|---|---|---|---|---|---|
| 发病例数(例) | 发病率(1/105) | 发病例数(例) | 发病率(1/105) | 发病例数(例) | 发病率(1/105) | |||
| 2008 | 15 641 | 1.18 | 129 649 | 9.81 | 312 522 | 23.65 | 457 812 | 34.65 |
| 2009 | 16 938 | 1.28 | 113 564 | 8.55 | 271 551 | 20.45 | 402 053 | 30.27 |
| 2010 | 14 041 | 1.05 | 104 361 | 7.82 | 252 248 | 18.90 | 370 650 | 27.77 |
| 2011 | 11 798 | 0.88 | 105 137 | 7.84 | 237 930 | 17.74 | 354 865 | 26.46 |
| 2012 | 11 998 | 0.89 | 92 092 | 6.84 | 207 429 | 15.40 | 311 519 | 23.12 |
| 2013 | 14 136 | 1.04 | 85 743 | 6.33 | 188 669 | 13.93 | 288 548 | 21.31 |
| 2014 | 13 768 | 1.02 | 84 516 | 6.24 | 153 585 | 11.33 | 251 869 | 18.59 |
| 2015 | 11 637 | 0.85 | 76 834 | 5.64 | 138 917 | 10.20 | 227 388 | 16.69 |
| 2016 | 10 899 | 0.80 | 71 968 | 5.25 | 123 283 | 8.99 | 206 150 | 15.04 |
| 2017 | 10 791 | 0.78 | 67 173 | 4.87 | 109 368 | 7.93 | 187 332 | 13.58 |
| 2018 | 10 843 | 0.78 | 60 299 | 4.34 | 91 152 | 6.56 | 162 294 | 11.68 |
| 变化率(%) | — | -33.90 | — | -55.76 | — | -72.26 | — | -66.29 |
| χ2趋势值 | — | 9.688 | — | 7.043 | — | 9.863 | — | 9.861 |
| P值 | — | 0.002 | — | 0.008 | — | 0.002 | — | 0.002 |
Table 1 Overview of reported incidence of types A and B intestinal infectious diseases in China,2008—2018
| 年份(年) | 伤寒与副伤寒 | 病毒性肝炎 | 痢疾 | 总发病例数(例) | 总发病率(1/105) | |||
|---|---|---|---|---|---|---|---|---|
| 发病例数(例) | 发病率(1/105) | 发病例数(例) | 发病率(1/105) | 发病例数(例) | 发病率(1/105) | |||
| 2008 | 15 641 | 1.18 | 129 649 | 9.81 | 312 522 | 23.65 | 457 812 | 34.65 |
| 2009 | 16 938 | 1.28 | 113 564 | 8.55 | 271 551 | 20.45 | 402 053 | 30.27 |
| 2010 | 14 041 | 1.05 | 104 361 | 7.82 | 252 248 | 18.90 | 370 650 | 27.77 |
| 2011 | 11 798 | 0.88 | 105 137 | 7.84 | 237 930 | 17.74 | 354 865 | 26.46 |
| 2012 | 11 998 | 0.89 | 92 092 | 6.84 | 207 429 | 15.40 | 311 519 | 23.12 |
| 2013 | 14 136 | 1.04 | 85 743 | 6.33 | 188 669 | 13.93 | 288 548 | 21.31 |
| 2014 | 13 768 | 1.02 | 84 516 | 6.24 | 153 585 | 11.33 | 251 869 | 18.59 |
| 2015 | 11 637 | 0.85 | 76 834 | 5.64 | 138 917 | 10.20 | 227 388 | 16.69 |
| 2016 | 10 899 | 0.80 | 71 968 | 5.25 | 123 283 | 8.99 | 206 150 | 15.04 |
| 2017 | 10 791 | 0.78 | 67 173 | 4.87 | 109 368 | 7.93 | 187 332 | 13.58 |
| 2018 | 10 843 | 0.78 | 60 299 | 4.34 | 91 152 | 6.56 | 162 294 | 11.68 |
| 变化率(%) | — | -33.90 | — | -55.76 | — | -72.26 | — | -66.29 |
| χ2趋势值 | — | 9.688 | — | 7.043 | — | 9.863 | — | 9.861 |
| P值 | — | 0.002 | — | 0.008 | — | 0.002 | — | 0.002 |

Figure 1 Monthly incidence trends of types A and B intestinal infectious diseases in China,2008—2018
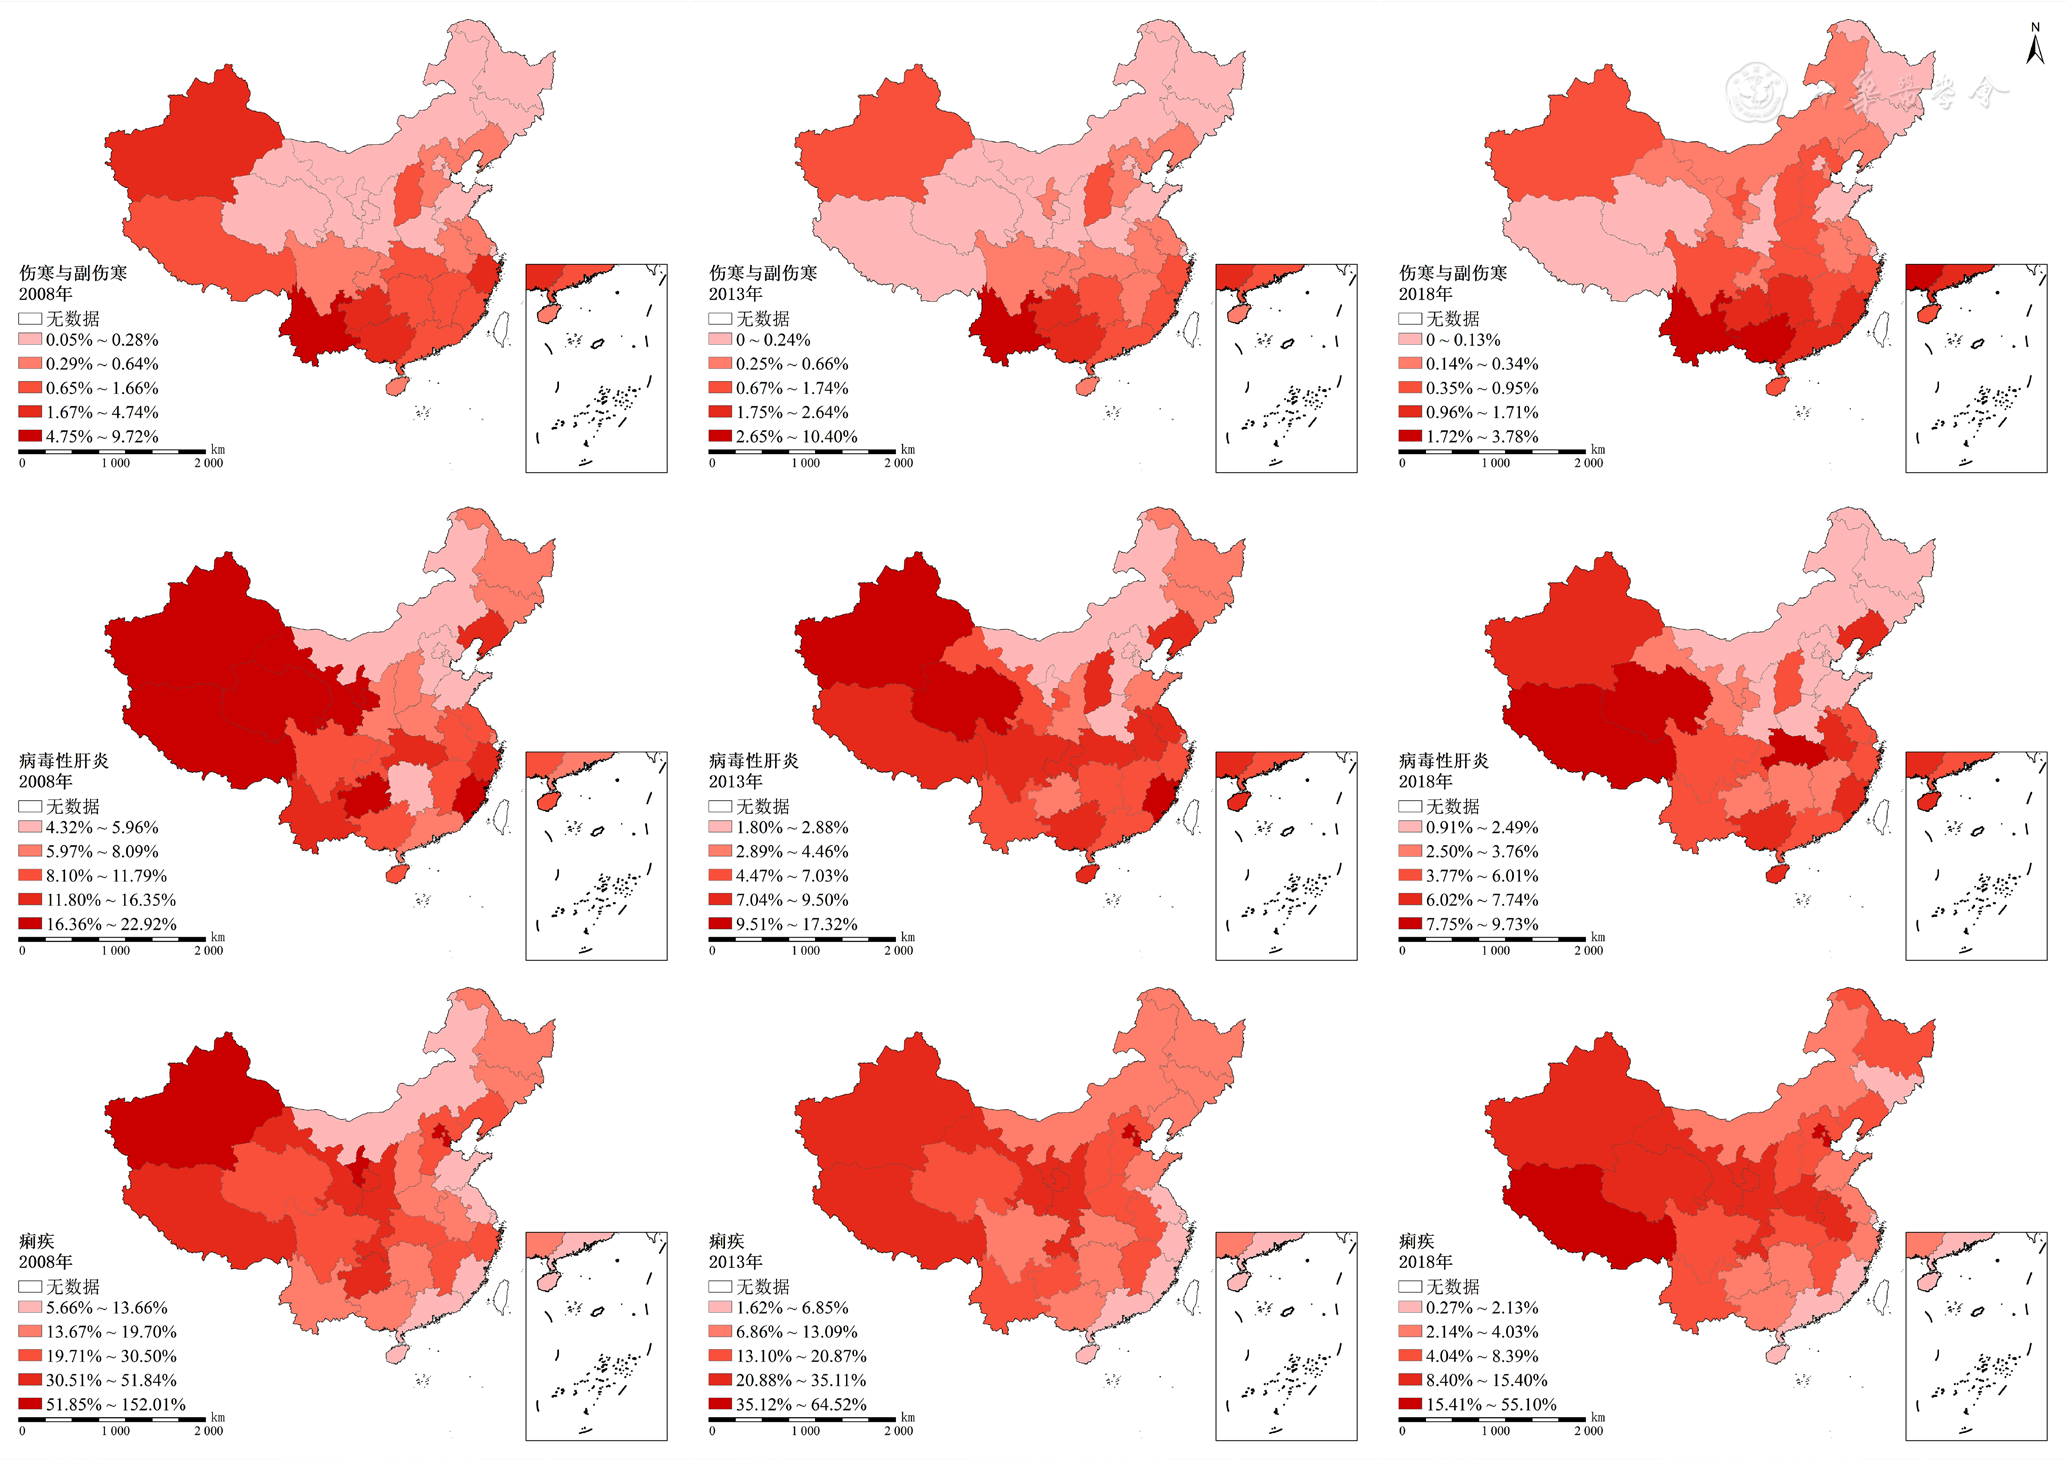
Figure 2 Spatial distribution of the incidence of types A and B intestinal infectious diseases in China(except for Hong Kong,Macao and Taiwan)in 2008,2013 and 2018
| 年份(年) | 伤寒与副伤寒 | 病毒性肝炎 | 痢疾 | ||||||
|---|---|---|---|---|---|---|---|---|---|
| 全局Moran's I值 | Z值 | P值 | 全局Moran's I值 | Z值 | P值 | 全局Moran's I值 | Z值 | P值 | |
| 2008 | 0.15 | 2.960 | 0.003 | 0.24 | 3.510 | <0.001 | 0.20 | 3.387 | 0.001 |
| 2009 | 0.13 | 2.910 | 0.004 | 0.24 | 3.590 | <0.001 | 0.18 | 3.191 | 0.001 |
| 2010 | 0.11 | 2.605 | 0.009 | 0.17 | 2.855 | 0.004 | 0.19 | 3.622 | <0.001 |
| 2011 | 0.13 | 3.137 | 0.002 | 0.20 | 3.057 | 0.002 | 0.24 | 3.886 | <0.001 |
| 2012 | 0.11 | 3.158 | 0.002 | 0.19 | 3.064 | 0.002 | 0.24 | 3.734 | <0.001 |
| 2013 | 0.10 | 2.604 | 0.009 | 0.16 | 2.618 | 0.009 | 0.22 | 3.536 | <0.001 |
| 2014 | 0.06 | 1.921 | 0.055 | 0.09 | 1.996 | 0.046 | 0.24 | 3.801 | <0.001 |
| 2015 | 0.13 | 2.942 | 0.003 | 0.15 | 2.638 | 0.008 | 0.23 | 3.743 | <0.001 |
| 2016 | 0.18 | 3.300 | 0.001 | 0.07 | 1.521 | 0.128 | 0.23 | 3.707 | <0.001 |
| 2017 | 0.19 | 3.425 | <0.001 | 0.13 | 2.155 | 0.031 | 0.22 | 3.628 | <0.001 |
| 2018 | 0.22 | 3.654 | <0.001 | 0.19 | 2.864 | 0.004 | 0.17 | 3.166 | 0.001 |
Table 2 Global spatial autocorrelation analysis of the incidence of typhoid and paratyphoid,viral hepatitis and dysentery in China,2008—2018
| 年份(年) | 伤寒与副伤寒 | 病毒性肝炎 | 痢疾 | ||||||
|---|---|---|---|---|---|---|---|---|---|
| 全局Moran's I值 | Z值 | P值 | 全局Moran's I值 | Z值 | P值 | 全局Moran's I值 | Z值 | P值 | |
| 2008 | 0.15 | 2.960 | 0.003 | 0.24 | 3.510 | <0.001 | 0.20 | 3.387 | 0.001 |
| 2009 | 0.13 | 2.910 | 0.004 | 0.24 | 3.590 | <0.001 | 0.18 | 3.191 | 0.001 |
| 2010 | 0.11 | 2.605 | 0.009 | 0.17 | 2.855 | 0.004 | 0.19 | 3.622 | <0.001 |
| 2011 | 0.13 | 3.137 | 0.002 | 0.20 | 3.057 | 0.002 | 0.24 | 3.886 | <0.001 |
| 2012 | 0.11 | 3.158 | 0.002 | 0.19 | 3.064 | 0.002 | 0.24 | 3.734 | <0.001 |
| 2013 | 0.10 | 2.604 | 0.009 | 0.16 | 2.618 | 0.009 | 0.22 | 3.536 | <0.001 |
| 2014 | 0.06 | 1.921 | 0.055 | 0.09 | 1.996 | 0.046 | 0.24 | 3.801 | <0.001 |
| 2015 | 0.13 | 2.942 | 0.003 | 0.15 | 2.638 | 0.008 | 0.23 | 3.743 | <0.001 |
| 2016 | 0.18 | 3.300 | 0.001 | 0.07 | 1.521 | 0.128 | 0.23 | 3.707 | <0.001 |
| 2017 | 0.19 | 3.425 | <0.001 | 0.13 | 2.155 | 0.031 | 0.22 | 3.628 | <0.001 |
| 2018 | 0.22 | 3.654 | <0.001 | 0.19 | 2.864 | 0.004 | 0.17 | 3.166 | 0.001 |
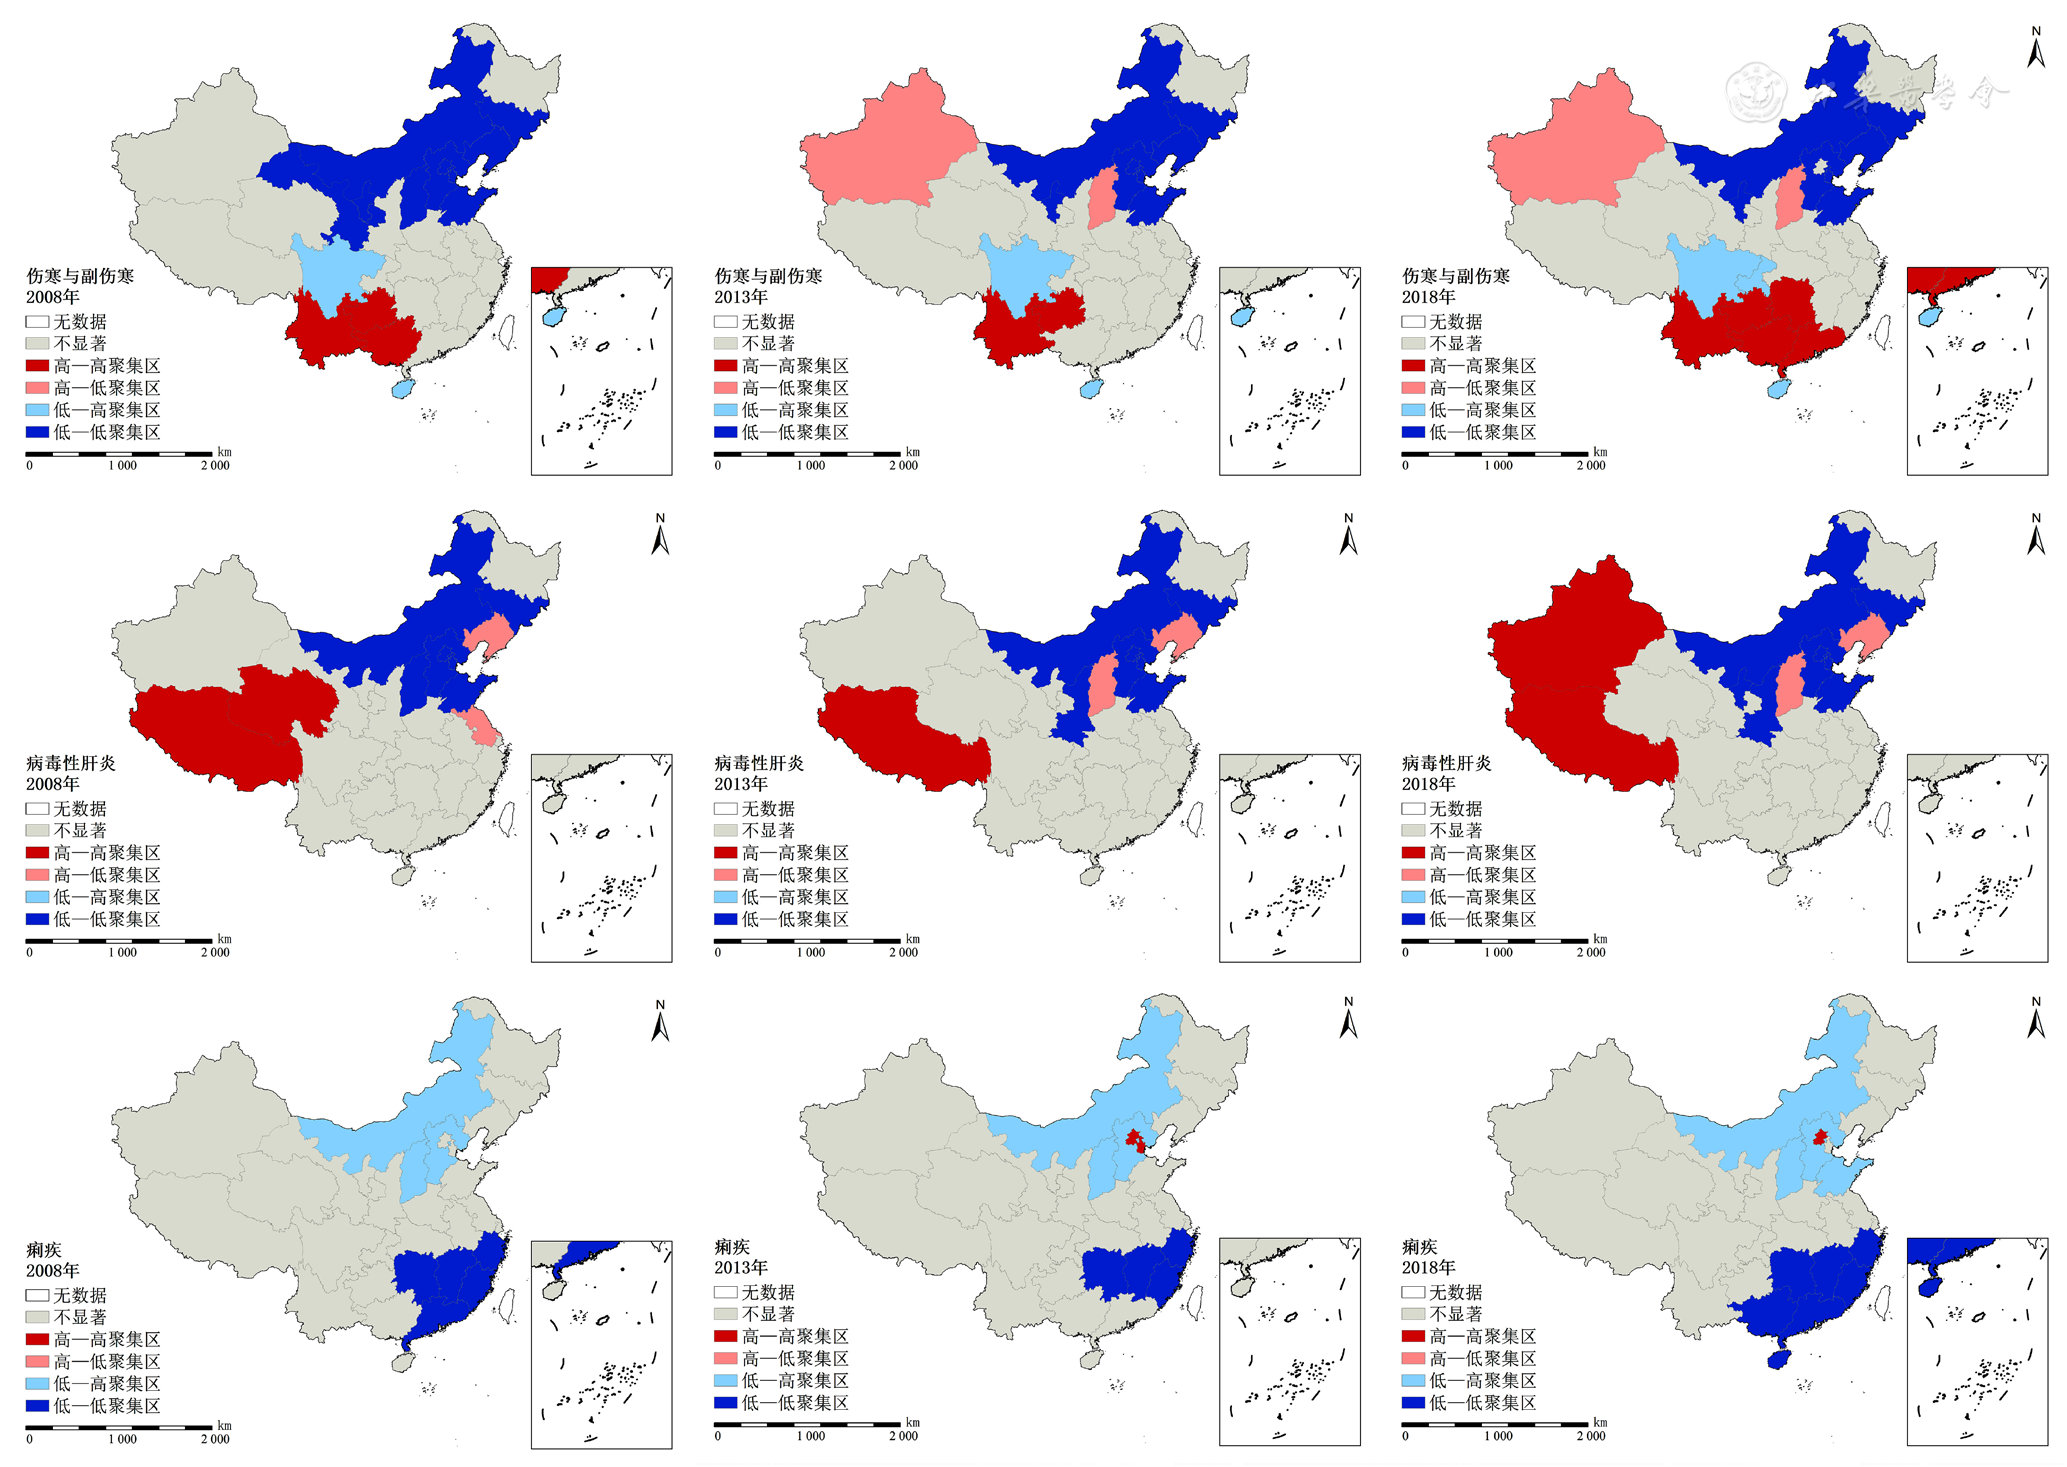
Figure 3 LISA clustering maps of the incidence of types A and B intestinal infectious diseases in China(except for Hong Kong,Macao and Taiwan)in 2008,2013 and 2018
| 类别 | 聚集时间(年) | 聚集中心〔扫描半径(km)〕 | 涉及省份数(个) | 实际发病例数(例) | 预期发病例数(例) | RR值 | LLR | P值 |
|---|---|---|---|---|---|---|---|---|
| 伤寒与副伤寒 | 2009—2013 | 云南省(0) | 1 | 23 375 | 2 213.53 | 12.44 | 35 618.36 | <0.001 |
| 病毒性肝炎 | 2008—2011 | 西藏自治区(1 679.46) | 9a | 122 748 | 68 208.18 | 1.91 | 19 226.94 | <0.001 |
| 痢疾 | 2008—2012 | 北京市(108.31) | 2b | 152 409 | 21 499.05 | 7.57 | 171 831.80 | <0.001 |
Table 3 Results of year-by-year spatio-temporal scan statistics of types A and B intestinal infectious diseases in China,2008—2018(the primary geographic cluster)
| 类别 | 聚集时间(年) | 聚集中心〔扫描半径(km)〕 | 涉及省份数(个) | 实际发病例数(例) | 预期发病例数(例) | RR值 | LLR | P值 |
|---|---|---|---|---|---|---|---|---|
| 伤寒与副伤寒 | 2009—2013 | 云南省(0) | 1 | 23 375 | 2 213.53 | 12.44 | 35 618.36 | <0.001 |
| 病毒性肝炎 | 2008—2011 | 西藏自治区(1 679.46) | 9a | 122 748 | 68 208.18 | 1.91 | 19 226.94 | <0.001 |
| 痢疾 | 2008—2012 | 北京市(108.31) | 2b | 152 409 | 21 499.05 | 7.57 | 171 831.80 | <0.001 |
| [1] |
|
| [2] |
|
| [3] |
中国疾病预防控制中心. 传染病[EB/OL]. [2022-03-30].
|
| [4] |
张璟,刘伟,刘艳挪,等. 济宁市2009—2016年肠道传染病流行状况及疾病负担分析[J]. 中华疾病控制杂志,2019,23(2):217-222.
|
| [5] |
国家卫生健康委员会疾病预防控制局. 2018年全国法定传染病疫情概况[EB/OL]. (2019-04-24)[2022-03-21].
|
| [6] |
李文豪,曾昱兴,李笑颜,等. SARIMA-GRNN组合模型在伤寒与副伤寒逐月发病数预测中的应用[J]. 中华疾病控制杂志,2021,25(11):1341-1346.
|
| [7] |
孟银平,姜黎黎,周永明,等. 云南省2010—2020年伤寒副伤寒流行特征分析[J]. 现代预防医学,2021,48(15):2689-2691,2715.
|
| [8] |
沙小兰,李燕,蒋泽顺,等. 2015—2019年银川市乙类肠道传染病流行特征分析[J]. 现代预防医学,2020,47(19):3602-3606.
|
| [9] |
朱斌,毛瑛. 中国2005—2015年典型法定报告肠道传染病流行趋势及时空集聚分析[J]. 中国公共卫生,2018,34(8):1120-1124. DOI:10.11847/zgggws1117754.
|
| [10] |
史芸萍,李刚,刘洋,等. 2010—2019年北京市法定报告肠道传染病流行病学特征分析[J]. 首都公共卫生,2021,15(4):192-196. DOI:10.16760/j.cnki.sdggws.2021.04.004.
|
| [11] |
中国疾病预防控制中心. 公共卫生科学数据中心[EB/OL]. [2022-11-23].
|
| [12] |
国家统计局. 中国统计年鉴2019[M]. 北京:中国统计出版社,2019.
|
| [13] |
国家基础地理信息中心. 天地图[EB/OL]. [2022-03-30].
|
| [14] |
|
| [15] |
杨静,段晓雨,黄甜,等. 云南省2014—2018年手足口病疫情时空流行特征[J]. 中华疾病控制杂志,2020,24(3):290-296.
|
| [16] |
|
| [17] |
|
| [18] |
白尧,陈志军,陈保忠,等. 2013—2017年陕西省手足口病的时空流行特征[J]. 中华疾病控制杂志,2021,25(3):329-334.
|
| [19] |
国家统计局. 统计制度及分类标准(17)[EB/OL]. (2018-10-01)[2022-02-07].
|
| [20] |
大江网. 健全传染病防控体系 为人民健康保驾护航[EB/OL]. (2021-01-11)[2022-03-30].
|
| [21] |
苏通,刘莹莹,赵文娜,等. 河北省2015—2020年其他感染性腹泻流行特征及时空聚集性[J]. 中华疾病控制杂志,2022,26(2):175-181.
|
| [22] |
赖彩云,魏志胜,高剑基,等. 北京市海淀区2005—2016年甲乙类肠道传染病疫情分析[J]. 中国预防医学杂志,2018,19(12):881-885. DOI:10.16506/j.1009-6639.2018.12.001.
|
| [23] |
杨小兵,邹娇娇,陈邦华,等. 2004—2017年武汉市病毒性肝炎流行病学特征分析[J]. 中国预防医学杂志,2019,20(1):42-47. DOI:10.16506/j.1009-6639.2019.01.011.
|
| [24] |
孙校金,张国民,郑徽,等. 2004—2017年中国戊型肝炎流行特征分析[J]. 中华预防医学杂志,2019,53(4):382-387.
|
| [25] |
肖正斌,陈恺韵,任宏,等. 2005—2019年戊型肝炎季节性流行特征及时间序列分析[J]. 上海预防医学,2021,33(10):923-928. DOI:10.19428/j.cnki.sjpm.2021.20817.
|
| [26] |
原云霄,王丽宁,王宝海,等. 中国传染病集聚与扩散的空间计量分析:基于空间面板数据[J]. 数学的实践与认识,2020,50(21):144-150.
|
| [27] |
单宝磊,宫献升,邓招红,等. 2005—2012年高密市乙类肠道传染病疫情分析[J]. 现代预防医学,2015,42(9):1687-1690.
|
| [28] |
李媛媛,徐成东,肖革新,等. 京津唐地区细菌性痢疾社会经济影响时空分析[J]. 地球信息科学学报,2016,18(12):1615-1623. DOI:10.3724/SP.J.1047.2016.01615.
|
| [1] | ZHANG Shengnan, XU Shihua, HUANG Rongchao, CHEN Jian, ZHAO Chunru, MENG Minglyu, MA Yingjiao. Trend and Forecast Analysis of Premature Mortality Probability by Four Major Non-communicable Diseases in Baise from 2015 to 2021 [J]. Chinese General Practice, 2024, 27(11): 1387-1394. |
| [2] | SONG Weimei, WANG Xuchun, REN Hao, ZHAO Ying, CHEN Liming, QIU Lixia. A Study on the Prevalence Trend of Overweight and Obesity among Adults Aged 20 and above in Shanxi Province from 2010 to 2018 [J]. Chinese General Practice, 2024, 27(10): 1245-1251. |
| [3] | WU Chunyan, DENG Yinglan, ZHAO Ping, HU Shixiu, WU Xiaoyan, ZHU Yan, LI Xiangyan, XIE Zhengzhou, WANG Rong, GAO Yan, YANG Xiuying, XU Haina, LU Ran, RAN Limei. Epidemiological Survey of Urinary Incontinence and Its Impact on Quality of Life in Women Aged 40-60 Years in Guizhou Province [J]. Chinese General Practice, 2024, 27(10): 1252-1260. |
| [4] | LI Ziyue, FANG Jiawen, LIN Kaicheng. Analysis and Prediction of the Disease Burden of Type 2 Diabetes Attributable to High Body Mass Index in China from 1990 to 2019 [J]. Chinese General Practice, 2024, 27(09): 1126-1133. |
| [5] | CHEN Qianqian, RUI Fajuan, NI Wenjing, LI Jie. Research Progress in Epidemiology and Risk Factors of Primary Liver Cancer [J]. Chinese General Practice, 2024, 27(06): 637-642. |
| [6] | YANG Ji, ZHANG Yao, MA Teng, TIAN Xintong, ZHAO Yingqiang. Epidemic Status, Disease Burden and Prediction of Cardiovascular Diseases in China, 1990-2019 [J]. Chinese General Practice, 2024, 27(02): 233-244. |
| [7] | FANG Jiawen, FENG Tianyuan, ZHOU Zhiheng, LI Ziyue, YAN Danhong, LIN Kaicheng. Trend Analysis of Gout Burden in China from 1990 to 2019 and Prediction for the Next Ten Years [J]. Chinese General Practice, 2024, 27(02): 245-252. |
| [8] | LENG Zheng qing, ALIMUJIANG· yimiti·taerkin. Growth Trends and Overweight/Obesity Status of Children Aged 7-12 Years in China from 2014 to 2020 [J]. Chinese General Practice, 2024, 27(01): 36-44. |
| [9] | LIU Ailing, ZHOU Jingjing, LI Chengcheng, HE Kaiyue, LIANG Shanshan, ZHOU Shangcheng. Analysis of the Disease Burden Trends and Death Projections for Esophageal Cancer Attributable to Tobacco in China from 1990 to 2019 [J]. Chinese General Practice, 2023, 26(36): 4587-4594. |
| [10] | ZHU Wenpeng, HAN Mengqi, WANG Yuxin, WANG Guoping. Trends and Projections of Incidence and Mortality of Nasopharyngeal Carcinoma in China from 1990 to 2019 [J]. Chinese General Practice, 2023, 26(34): 4269-4276. |
| [11] | MA Liyuan, WANG Zengwu, FAN Jing, HU Shengshou. Interpretation of Report on Cardiovascular Health and Diseases in China 2022 [J]. Chinese General Practice, 2023, 26(32): 3975-3994. |
| [12] | HUANG Qixian, WEN Yanting, HUANG Jun, LI Weibin, XU Yongneng, LIN Xiayi, WANG Haoxiang, WENG Fan, YANG Lianping. Prevalence of Dyslipidemia and Its Influencing Factors among Elderly Community Residents [J]. Chinese General Practice, 2023, 26(28): 3520-3525. |
| [13] | TIAN Meiling, MA Guojuan, DU Liyan, XIAO Yuange, ZHANG Sai, ZHANG Cui, TANG Zengjun. Prevalence and Epidemiology of Gestational Diabetes Mellitus from 2014 to 2021 in Hebei Province [J]. Chinese General Practice, 2023, 26(26): 3320-3324. |
| [14] | LIANG Shanshan, ZHOU Zhihua, LI Chengcheng, CHEN Huijing, ZHOU Shangcheng. Diabetes in China: Burden Analysis between 1990 and 2019 and Incidence Prediction between 2020 and 2030 [J]. Chinese General Practice, 2023, 26(16): 2013-2019. |
| [15] | BAI Dingxi, GAO Jing, YANG Zhi, WU Chenxi. Development of a Treatment Burden Scale for Elderly Patients with Coexisting Chronic Diseases [J]. Chinese General Practice, 2023, 26(13): 1613-1620. |
| Viewed | ||||||
|
Full text |
|
|||||
|
Abstract |
|
|||||