
Chinese General Practice ›› 2025, Vol. 28 ›› Issue (28): 3532-3540.DOI: 10.12114/j.issn.1007-9572.2024.0703
• Article • Previous Articles Next Articles
Received:2024-12-10
Revised:2025-02-12
Published:2025-10-05
Online:2025-08-28
Contact:
HAN Li
通讯作者:
韩莉
作者简介:作者贡献:
赵思琪、叶杏、韩莉负责文章的构思与设计、论文撰写;赵洋、Kanya Anindya、Tiara Marthias、Mercian Daniel负责数据整理、统计分析和结果解释;赵思琪、赵天浩负责文献检索和整理;赵思琪、赵洋、赵天浩负责论文初稿的修改;韩莉负责文章的质量控制及审校,对文章整体负责。
基金资助:CLC Number:
Add to citation manager EndNote|Ris|BibTeX
URL: https://www.chinagp.net/EN/10.12114/j.issn.1007-9572.2024.0703
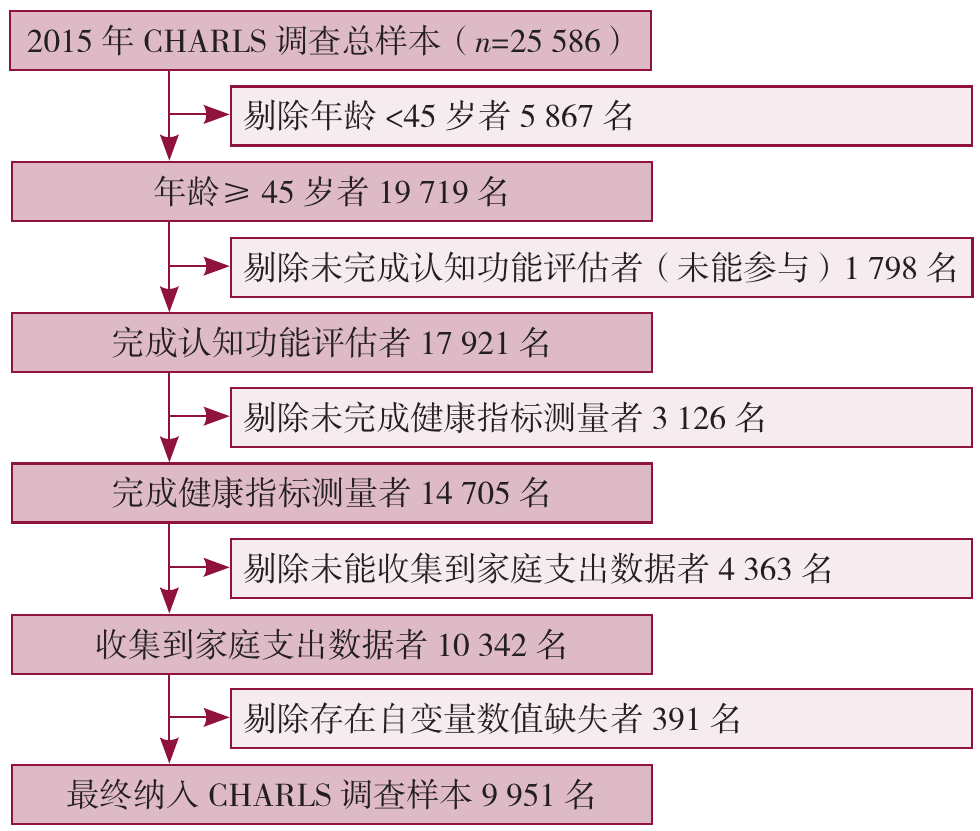
Figure 1 Flow chart of the CHARLS sample selection
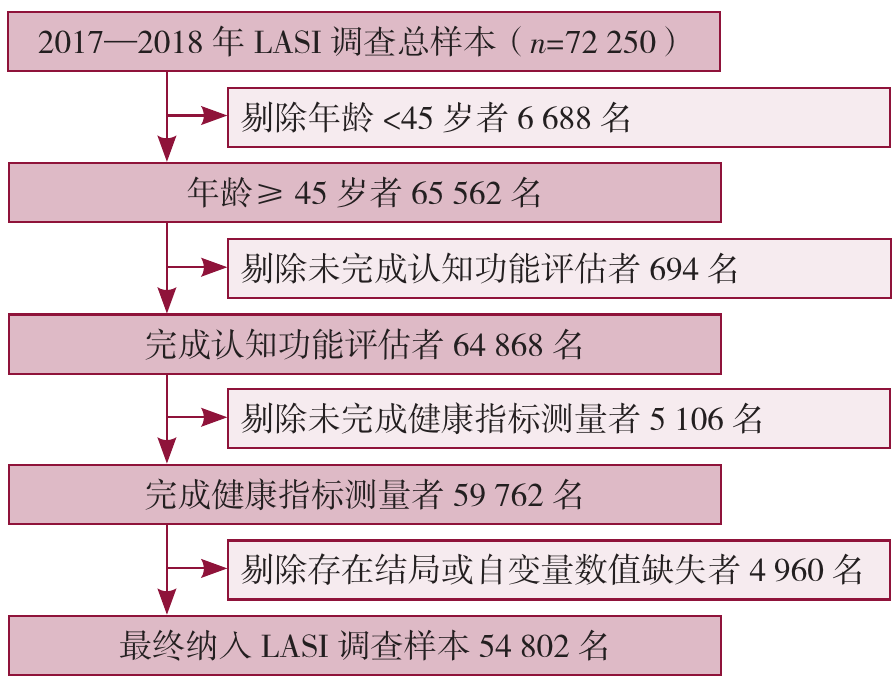
Figure 2 Flow chart of the LASI sample selection
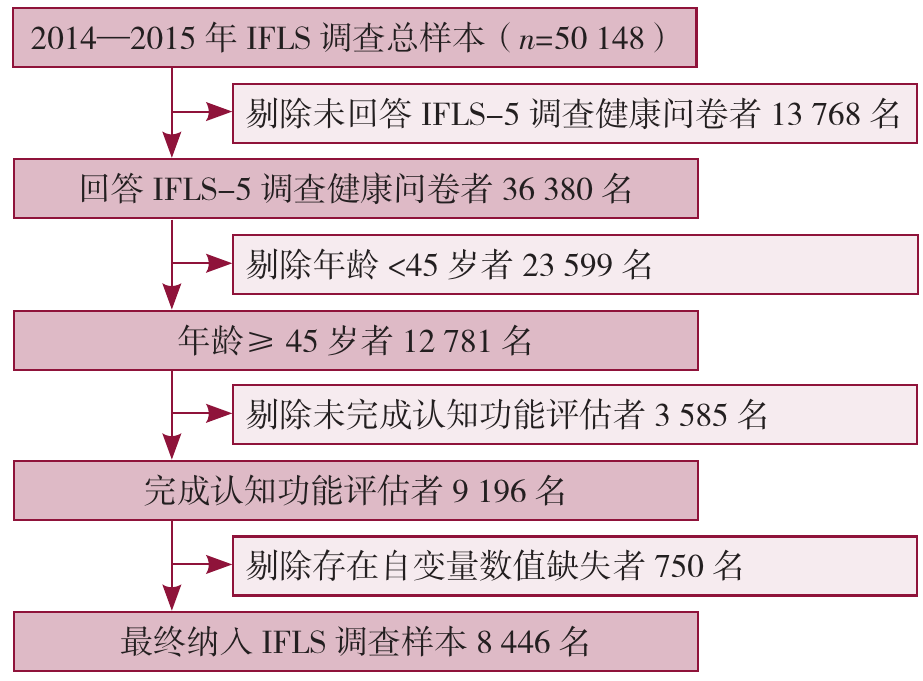
Figure 3 Flow chart of the IFLS sample selection
| 变量 | 中国 | 印度 | 印度尼西亚 | |||
|---|---|---|---|---|---|---|
| 名数 | 认知功能评分 | 名数 | 认知功能评分 | 名数 | 认知功能评分 | |
| 性别 | ||||||
| 男 | 4 884 | 58.3±16.9 | 26 048 | 57.5±19.2 | 4 015 | 52.4±17.3 |
| 女 | 5 067 | 51.3±21.9 | 28 754 | 45.3±19.0 | 4 431 | 49.2±19.2 |
| 年龄 | ||||||
| 45~49岁 | 1 598 | 62.0±16.4 | 11 261 | 57.3±18.5 | 2 321 | 56.0±16.7 |
| 50~59岁 | 3 601 | 57.7±18.4 | 17 829 | 54.1±19.3 | 3 416 | 51.6±17.7 |
| 60~69岁 | 3 268 | 52.3±20.1 | 15 992 | 49.7±19.7 | 1 816 | 48.4±18.3 |
| ≥70岁 | 1 484 | 45.5±21.6 | 9 720 | 42.4±20.0 | 893 | 36.2±18.1 |
| 婚姻状况 | ||||||
| 未婚 | 1 011 | 45.6±22.2 | 13 062 | 42.8±19.3 | 1 808 | 45.7±19.8 |
| 已婚 | 8 940 | 55.8±19.3 | 41 740 | 53.8±19.5 | 6 638 | 52.0±17.8 |
| 民族(印度尼西亚) | ||||||
| 爪哇族 | 4 025 | 50.9±18.5 | ||||
| 巽他族 | 1 022 | 53.9±17.6 | ||||
| 其他 | 3 399 | 48.5±18.4 | ||||
| 种姓(印度) | ||||||
| 表列种姓和部落 | 18 592 | 45.5±19.6 | ||||
| 其他落后阶层 | 20 767 | 52.3±19.7 | ||||
| 其他 | 15 443 | 54.9±19.8 | ||||
| 受教育程度 | ||||||
| 高中及以上 | 157 | 76.1±9.7 | 3 074 | 74.5±12.6 | 700 | 67.8±11.1 |
| 初中 | 3 100 | 65.2±12.9 | 12 873 | 66.5±14.3 | 2 371 | 61.0±13.5 |
| 小学 | 2 766 | 58.4±15.2 | 13 824 | 55.1±16.9 | 4 411 | 47.9±16.4 |
| 小学以下 | 3 928 | 40.8±20.5 | 25 031 | 40.0±16.7 | 964 | 29.3±15.5 |
| 家庭经济水平 | ||||||
| Q5 | 1 828 | 60.0±19.3 | 10 930 | 56.5±20.1 | 1 379 | 59.3±16.9 |
| Q4 | 1 990 | 56.6±18.6 | 11 124 | 52.7±19.8 | 1 638 | 54.4±17.1 |
| Q3 | 1 997 | 55.0±19.1 | 11 118 | 50.8±19.9 | 1 681 | 51.3±17.9 |
| Q2 | 2 039 | 53.8±19.9 | 11 077 | 48.7±19.8 | 1 733 | 48.1±18.0 |
| Q1 | 2 097 | 47.7±20.6 | 10 553 | 47.6±19.4 | 2 015 | 44.7±18.4 |
| 就业情况 | ||||||
| 失业 | 3 114 | 53.8±21.2 | 28 797 | 48.1±19.9 | 1 937 | 48.8±19.6 |
| 在业 | 6 837 | 55.2±19.1 | 26 005 | 54.3±19.6 | 6 509 | 51.2±18.0 |
| 居住地区 | ||||||
| 城市 | 3 764 | 61.0±17.1 | 18 963 | 59.9±18.4 | 4 751 | 55.5±17.2 |
| 农村 | 6 187 | 49.5±20.5 | 35 839 | 47.5±19.5 | 3 695 | 45.7±18.3 |
| 吸烟 | ||||||
| 不吸烟 | 5 517 | 53.3±21.2 | 34 290 | 51.5±20.1 | 4 951 | 50.6±18.8 |
| 已戒烟 | 1 559 | 56.1±17.7 | 3 542 | 51.7±19.8 | 676 | 52.3±17.7 |
| 吸烟 | 2 875 | 56.7±17.9 | 16 970 | 50.2±19.9 | 2 819 | 50.6±17.9 |
| 饮酒 | ||||||
| 不饮酒 | 6 276 | 52.3±20.6 | 48 919 | 51.1±20.0 | ||
| 饮酒较少 | 2 778 | 58.6±17.6 | 3 383 | 52.2±20.2 | ||
| 饮酒较多 | 8 97 | 59.2±19.0 | 2 500 | 49.3±19.9 | ||
| BMI | ||||||
| 正常 | 3 573 | 52.9±20.3 | 20 420 | 49.8±19.7 | 3 119 | 48.0±18.5 |
| 低 | 506 | 44.8±22.6 | 10 041 | 42.6±18.9 | 908 | 41.6±19.2 |
| 超重 | 2 172 | 56.1±19.5 | 8 326 | 54.4±19.6 | 1 410 | 52.5±17.6 |
| 肥胖 | 3 700 | 57.0±18.8 | 16 015 | 58.0±18.8 | 3 009 | 55.4±16.8 |
| 慢性病类型 | ||||||
| 无慢性病 | 2 313 | 60.1±17.8 | 12 456 | 53.0±19.9 | 2 766 | 51.4±18.4 |
| 单一慢性病 | 2 358 | 57.1±19.1 | 12 483 | 53.1±20.5 | 3 203 | 50.4±18.9 |
| 躯体共病 | 1 971 | 55.8±19.3 | 6 022 | 55.4±19.1 | 960 | 53.0±17.2 |
| 仅抑郁症状 | 731 | 53.1±19.2 | 8 709 | 48.3±19.5 | 531 | 49.5±17.5 |
| 身心共病 | 2 578 | 46.7±20.7 | 15 132 | 48.0±19.8 | 986 | 48.0±18.2 |
Table 1 Characteristics of participants and average cognitive function in China,India and Indonesia
| 变量 | 中国 | 印度 | 印度尼西亚 | |||
|---|---|---|---|---|---|---|
| 名数 | 认知功能评分 | 名数 | 认知功能评分 | 名数 | 认知功能评分 | |
| 性别 | ||||||
| 男 | 4 884 | 58.3±16.9 | 26 048 | 57.5±19.2 | 4 015 | 52.4±17.3 |
| 女 | 5 067 | 51.3±21.9 | 28 754 | 45.3±19.0 | 4 431 | 49.2±19.2 |
| 年龄 | ||||||
| 45~49岁 | 1 598 | 62.0±16.4 | 11 261 | 57.3±18.5 | 2 321 | 56.0±16.7 |
| 50~59岁 | 3 601 | 57.7±18.4 | 17 829 | 54.1±19.3 | 3 416 | 51.6±17.7 |
| 60~69岁 | 3 268 | 52.3±20.1 | 15 992 | 49.7±19.7 | 1 816 | 48.4±18.3 |
| ≥70岁 | 1 484 | 45.5±21.6 | 9 720 | 42.4±20.0 | 893 | 36.2±18.1 |
| 婚姻状况 | ||||||
| 未婚 | 1 011 | 45.6±22.2 | 13 062 | 42.8±19.3 | 1 808 | 45.7±19.8 |
| 已婚 | 8 940 | 55.8±19.3 | 41 740 | 53.8±19.5 | 6 638 | 52.0±17.8 |
| 民族(印度尼西亚) | ||||||
| 爪哇族 | 4 025 | 50.9±18.5 | ||||
| 巽他族 | 1 022 | 53.9±17.6 | ||||
| 其他 | 3 399 | 48.5±18.4 | ||||
| 种姓(印度) | ||||||
| 表列种姓和部落 | 18 592 | 45.5±19.6 | ||||
| 其他落后阶层 | 20 767 | 52.3±19.7 | ||||
| 其他 | 15 443 | 54.9±19.8 | ||||
| 受教育程度 | ||||||
| 高中及以上 | 157 | 76.1±9.7 | 3 074 | 74.5±12.6 | 700 | 67.8±11.1 |
| 初中 | 3 100 | 65.2±12.9 | 12 873 | 66.5±14.3 | 2 371 | 61.0±13.5 |
| 小学 | 2 766 | 58.4±15.2 | 13 824 | 55.1±16.9 | 4 411 | 47.9±16.4 |
| 小学以下 | 3 928 | 40.8±20.5 | 25 031 | 40.0±16.7 | 964 | 29.3±15.5 |
| 家庭经济水平 | ||||||
| Q5 | 1 828 | 60.0±19.3 | 10 930 | 56.5±20.1 | 1 379 | 59.3±16.9 |
| Q4 | 1 990 | 56.6±18.6 | 11 124 | 52.7±19.8 | 1 638 | 54.4±17.1 |
| Q3 | 1 997 | 55.0±19.1 | 11 118 | 50.8±19.9 | 1 681 | 51.3±17.9 |
| Q2 | 2 039 | 53.8±19.9 | 11 077 | 48.7±19.8 | 1 733 | 48.1±18.0 |
| Q1 | 2 097 | 47.7±20.6 | 10 553 | 47.6±19.4 | 2 015 | 44.7±18.4 |
| 就业情况 | ||||||
| 失业 | 3 114 | 53.8±21.2 | 28 797 | 48.1±19.9 | 1 937 | 48.8±19.6 |
| 在业 | 6 837 | 55.2±19.1 | 26 005 | 54.3±19.6 | 6 509 | 51.2±18.0 |
| 居住地区 | ||||||
| 城市 | 3 764 | 61.0±17.1 | 18 963 | 59.9±18.4 | 4 751 | 55.5±17.2 |
| 农村 | 6 187 | 49.5±20.5 | 35 839 | 47.5±19.5 | 3 695 | 45.7±18.3 |
| 吸烟 | ||||||
| 不吸烟 | 5 517 | 53.3±21.2 | 34 290 | 51.5±20.1 | 4 951 | 50.6±18.8 |
| 已戒烟 | 1 559 | 56.1±17.7 | 3 542 | 51.7±19.8 | 676 | 52.3±17.7 |
| 吸烟 | 2 875 | 56.7±17.9 | 16 970 | 50.2±19.9 | 2 819 | 50.6±17.9 |
| 饮酒 | ||||||
| 不饮酒 | 6 276 | 52.3±20.6 | 48 919 | 51.1±20.0 | ||
| 饮酒较少 | 2 778 | 58.6±17.6 | 3 383 | 52.2±20.2 | ||
| 饮酒较多 | 8 97 | 59.2±19.0 | 2 500 | 49.3±19.9 | ||
| BMI | ||||||
| 正常 | 3 573 | 52.9±20.3 | 20 420 | 49.8±19.7 | 3 119 | 48.0±18.5 |
| 低 | 506 | 44.8±22.6 | 10 041 | 42.6±18.9 | 908 | 41.6±19.2 |
| 超重 | 2 172 | 56.1±19.5 | 8 326 | 54.4±19.6 | 1 410 | 52.5±17.6 |
| 肥胖 | 3 700 | 57.0±18.8 | 16 015 | 58.0±18.8 | 3 009 | 55.4±16.8 |
| 慢性病类型 | ||||||
| 无慢性病 | 2 313 | 60.1±17.8 | 12 456 | 53.0±19.9 | 2 766 | 51.4±18.4 |
| 单一慢性病 | 2 358 | 57.1±19.1 | 12 483 | 53.1±20.5 | 3 203 | 50.4±18.9 |
| 躯体共病 | 1 971 | 55.8±19.3 | 6 022 | 55.4±19.1 | 960 | 53.0±17.2 |
| 仅抑郁症状 | 731 | 53.1±19.2 | 8 709 | 48.3±19.5 | 531 | 49.5±17.5 |
| 身心共病 | 2 578 | 46.7±20.7 | 15 132 | 48.0±19.8 | 986 | 48.0±18.2 |
| 变量 | 中国 | 印度 | 印度尼西亚 | |||
|---|---|---|---|---|---|---|
| β(95%CI) | P值 | β(95%CI) | P值 | β(95%CI) | P值 | |
| 慢性病类型(以无慢性病为参照) | ||||||
| 单一慢性病 | -1.03(-2.23~0.17) | 0.093 | -0.09(-0.79~0.60) | 0.797 | -0.30(-1.25~0.65) | 0.535 |
| 躯体共病 | -0.51(-1.73~0.70) | 0.405 | -0.02(-0.97~0.92) | 0.963 | 0.98(-0.36~2.31) | 0.151 |
| 仅抑郁症状 | -4.59(-6.29~-2.90) | <0.001 | -2.13(-2.84~-1.43) | <0.001 | -2.20(-3.82~-0.57) | 0.008 |
| 身心共病 | -6.99(-8.26~-5.71) | <0.001 | -2.76(-3.41~-2.11) | <0.001 | -2.75(-4.10~-1.41) | <0.001 |
| 性别(以男为参照) | ||||||
| 女 | -7.34(-8.63~-6.06) | <0.001 | -13.73(-14.30~-13.17) | <0.001 | -4.54(-5.66~-3.42) | <0.001 |
| 年龄(以45~49岁为参照) | ||||||
| 50~59岁 | -3.58(-4.77~-2.39) | <0.001 | -3.20(-3.80~-2.60) | <0.001 | -4.43(-5.37~-3.49) | <0.001 |
| 60~69岁 | -8.37(-9.65~-7.08) | <0.001 | -6.35(-7.00~-5.70) | <0.001 | -6.75(-7.94~-5.57) | <0.001 |
| ≥70岁 | -14.90(-16.60~-13.20) | <0.001 | -12.53(-13.41~-11.65) | <0.001 | -15.76(-17.32~-14.19) | <0.001 |
| 婚姻状况(以未婚为参照) | ||||||
| 已婚 | 4.05(2.50~5.59) | <0.001 | 2.76(2.17~3.35) | <0.001 | 1.85(0.78~2.92) | 0.001 |
| 民族(以爪哇族为参照) | ||||||
| 巽他族 | 2.03(0.87~3.19) | 0.001 | ||||
| 其他 | -2.36(-3.20~-1.53) | <0.001 | ||||
| 种姓(以表列种姓和部落为参照) | ||||||
| 其他落后阶层 | 3.63(3.07~4.19) | <0.001 | ||||
| 其他 | 4.80(4.17~5.43) | <0.001 | ||||
| 家庭经济水平(以Q5为参照) | ||||||
| Q4 | -2.07(-3.44~-0.69) | 0.003 | -2.01(-2.79~-1.23) | <0.001 | -3.70(-4.94~-2.45) | <0.001 |
| Q3 | -3.33(-4.81~-1.85) | <0.001 | -2.92(-3.69~-2.15) | <0.001 | -5.88(-7.14~-4.61) | <0.001 |
| Q2 | -3.40(-4.80~-2.00) | <0.001 | -4.54(-5.29~-3.79) | <0.001 | -7.81(-9.11~-6.51) | <0.001 |
| Q1 | -6.49(-8.06~-4.92) | <0.001 | -5.21(-5.97~-4.46) | <0.001 | -9.87(-11.14~-8.60) | <0.001 |
| 就业情况(以失业为参照) | ||||||
| 在业 | -1.31(-2.37~-0.24) | 0.017 | 0.36(-0.17~0.88) | 0.184 | 0.64(-0.37~1.65) | 0.214 |
| 居住地区(以城市为参照) | ||||||
| 农村 | -9.26(-10.63~-7.88) | <0.001 | -9.00(-9.55~-8.46) | <0.001 | -7.26(-8.06~-6.46) | <0.001 |
| 吸烟(以不吸烟为参照) | ||||||
| 已戒烟 | -1.02(-2.50~0.46) | 0.177 | -2.34(-3.29~-1.38) | <0.001 | 0.08(-1.51~1.67) | 0.920 |
| 吸烟 | -1.82(-2.95~-0.70) | 0.002 | -2.73(-3.28~-2.19) | <0.001 | -1.55(-2.68~-0.41) | 0.008 |
| 饮酒(以不饮酒为参照) | ||||||
| 饮酒较少 | 1.42(0.42~2.42) | 0.005 | -2.64(-3.57~-1.71) | <0.001 | ||
| 饮酒较多 | 3.01(1.33~4.68) | <0.001 | -5.46(-6.56~-4.37) | <0.001 | ||
| BMI(以正常为参照) | ||||||
| 低 | -4.84(-7.07~-2.62) | <0.001 | -3.69(-4.29~-3.08) | <0.001 | -2.15(-3.59~-0.71) | 0.003 |
| 超重 | 1.77(0.63~2.91) | 0.003 | 2.58(1.90~3.26) | <0.001 | 2.65(1.50~3.80) | <0.001 |
| 肥胖 | 1.62(0.65~2.59) | 0.001 | 5.01(4.39~5.64) | <0.001 | 4.21(3.24~5.18) | <0.001 |
Table 2 Multivariable linear regression analysis of association between physical-mental multimorbidity and cognitive function among participants from China,India and Indonesia
| 变量 | 中国 | 印度 | 印度尼西亚 | |||
|---|---|---|---|---|---|---|
| β(95%CI) | P值 | β(95%CI) | P值 | β(95%CI) | P值 | |
| 慢性病类型(以无慢性病为参照) | ||||||
| 单一慢性病 | -1.03(-2.23~0.17) | 0.093 | -0.09(-0.79~0.60) | 0.797 | -0.30(-1.25~0.65) | 0.535 |
| 躯体共病 | -0.51(-1.73~0.70) | 0.405 | -0.02(-0.97~0.92) | 0.963 | 0.98(-0.36~2.31) | 0.151 |
| 仅抑郁症状 | -4.59(-6.29~-2.90) | <0.001 | -2.13(-2.84~-1.43) | <0.001 | -2.20(-3.82~-0.57) | 0.008 |
| 身心共病 | -6.99(-8.26~-5.71) | <0.001 | -2.76(-3.41~-2.11) | <0.001 | -2.75(-4.10~-1.41) | <0.001 |
| 性别(以男为参照) | ||||||
| 女 | -7.34(-8.63~-6.06) | <0.001 | -13.73(-14.30~-13.17) | <0.001 | -4.54(-5.66~-3.42) | <0.001 |
| 年龄(以45~49岁为参照) | ||||||
| 50~59岁 | -3.58(-4.77~-2.39) | <0.001 | -3.20(-3.80~-2.60) | <0.001 | -4.43(-5.37~-3.49) | <0.001 |
| 60~69岁 | -8.37(-9.65~-7.08) | <0.001 | -6.35(-7.00~-5.70) | <0.001 | -6.75(-7.94~-5.57) | <0.001 |
| ≥70岁 | -14.90(-16.60~-13.20) | <0.001 | -12.53(-13.41~-11.65) | <0.001 | -15.76(-17.32~-14.19) | <0.001 |
| 婚姻状况(以未婚为参照) | ||||||
| 已婚 | 4.05(2.50~5.59) | <0.001 | 2.76(2.17~3.35) | <0.001 | 1.85(0.78~2.92) | 0.001 |
| 民族(以爪哇族为参照) | ||||||
| 巽他族 | 2.03(0.87~3.19) | 0.001 | ||||
| 其他 | -2.36(-3.20~-1.53) | <0.001 | ||||
| 种姓(以表列种姓和部落为参照) | ||||||
| 其他落后阶层 | 3.63(3.07~4.19) | <0.001 | ||||
| 其他 | 4.80(4.17~5.43) | <0.001 | ||||
| 家庭经济水平(以Q5为参照) | ||||||
| Q4 | -2.07(-3.44~-0.69) | 0.003 | -2.01(-2.79~-1.23) | <0.001 | -3.70(-4.94~-2.45) | <0.001 |
| Q3 | -3.33(-4.81~-1.85) | <0.001 | -2.92(-3.69~-2.15) | <0.001 | -5.88(-7.14~-4.61) | <0.001 |
| Q2 | -3.40(-4.80~-2.00) | <0.001 | -4.54(-5.29~-3.79) | <0.001 | -7.81(-9.11~-6.51) | <0.001 |
| Q1 | -6.49(-8.06~-4.92) | <0.001 | -5.21(-5.97~-4.46) | <0.001 | -9.87(-11.14~-8.60) | <0.001 |
| 就业情况(以失业为参照) | ||||||
| 在业 | -1.31(-2.37~-0.24) | 0.017 | 0.36(-0.17~0.88) | 0.184 | 0.64(-0.37~1.65) | 0.214 |
| 居住地区(以城市为参照) | ||||||
| 农村 | -9.26(-10.63~-7.88) | <0.001 | -9.00(-9.55~-8.46) | <0.001 | -7.26(-8.06~-6.46) | <0.001 |
| 吸烟(以不吸烟为参照) | ||||||
| 已戒烟 | -1.02(-2.50~0.46) | 0.177 | -2.34(-3.29~-1.38) | <0.001 | 0.08(-1.51~1.67) | 0.920 |
| 吸烟 | -1.82(-2.95~-0.70) | 0.002 | -2.73(-3.28~-2.19) | <0.001 | -1.55(-2.68~-0.41) | 0.008 |
| 饮酒(以不饮酒为参照) | ||||||
| 饮酒较少 | 1.42(0.42~2.42) | 0.005 | -2.64(-3.57~-1.71) | <0.001 | ||
| 饮酒较多 | 3.01(1.33~4.68) | <0.001 | -5.46(-6.56~-4.37) | <0.001 | ||
| BMI(以正常为参照) | ||||||
| 低 | -4.84(-7.07~-2.62) | <0.001 | -3.69(-4.29~-3.08) | <0.001 | -2.15(-3.59~-0.71) | 0.003 |
| 超重 | 1.77(0.63~2.91) | 0.003 | 2.58(1.90~3.26) | <0.001 | 2.65(1.50~3.80) | <0.001 |
| 肥胖 | 1.62(0.65~2.59) | 0.001 | 5.01(4.39~5.64) | <0.001 | 4.21(3.24~5.18) | <0.001 |
| 项目 | 中国 | 印度 | 印度尼西亚 | |||||||||
|---|---|---|---|---|---|---|---|---|---|---|---|---|
| 男性 | 女性 | 男性 | 女性 | 男性 | 女性 | |||||||
| β(95%CI) | P值 | β(95%CI) | P值 | β(95%CI) | P值 | β(95%CI) | P值 | β(95%CI) | P值 | β(95%CI) | P值 | |
| 慢性病类型(无慢性病) | ||||||||||||
| 单一慢性病 | -0.44(-1.83~0.95) | 0.535 | -1.66(-3.70~0.38) | 0.111 | 0.52(-0.51~1.55) | 0.322 | -0.50(-1.42~0.42) | 0.290 | -0.16(-1.47~1.16) | 0.816 | -0.42(-1.77~0.94) | 0.545 |
| 躯体共病 | -0.31(-1.80~1.19) | 0.686 | -0.99(-2.84~0.87) | 0.297 | 0.77(-0.55~2.09) | 0.255 | -0.56(-1.91~0.79) | 0.413 | 3.02(1.09~4.95) | 0.002 | -0.32(-2.14~1.50) | 0.728 |
| 仅抑郁症状 | -4.90(-7.20~-2.61) | <0.001 | -4.86(-7.09~-2.62) | <0.001 | -2.15(-3.21~-1.10) | <0.001 | -2.02(-2.95~-1.09) | <0.001 | -2.63(-4.79~-0.48) | 0.017 | -2.05(-4.51~0.41) | 0.102 |
| 身心共病 | -5.38(-6.99~-3.76) | <0.001 | -7.95(-9.71~-6.19) | <0.001 | -2.68(-3.65~-1.71) | <0.001 | -2.69(-3.56~-1.83) | <0.001 | -2.39(-4.42~-0.36) | 0.021 | -3.21(-5.00~-1.41) | <0.001 |
Table 3 Multivariable linear regression analysis of association between physical-mental multimorbidity and cognitive function among participants from China,India and Indonesia(by gender)
| 项目 | 中国 | 印度 | 印度尼西亚 | |||||||||
|---|---|---|---|---|---|---|---|---|---|---|---|---|
| 男性 | 女性 | 男性 | 女性 | 男性 | 女性 | |||||||
| β(95%CI) | P值 | β(95%CI) | P值 | β(95%CI) | P值 | β(95%CI) | P值 | β(95%CI) | P值 | β(95%CI) | P值 | |
| 慢性病类型(无慢性病) | ||||||||||||
| 单一慢性病 | -0.44(-1.83~0.95) | 0.535 | -1.66(-3.70~0.38) | 0.111 | 0.52(-0.51~1.55) | 0.322 | -0.50(-1.42~0.42) | 0.290 | -0.16(-1.47~1.16) | 0.816 | -0.42(-1.77~0.94) | 0.545 |
| 躯体共病 | -0.31(-1.80~1.19) | 0.686 | -0.99(-2.84~0.87) | 0.297 | 0.77(-0.55~2.09) | 0.255 | -0.56(-1.91~0.79) | 0.413 | 3.02(1.09~4.95) | 0.002 | -0.32(-2.14~1.50) | 0.728 |
| 仅抑郁症状 | -4.90(-7.20~-2.61) | <0.001 | -4.86(-7.09~-2.62) | <0.001 | -2.15(-3.21~-1.10) | <0.001 | -2.02(-2.95~-1.09) | <0.001 | -2.63(-4.79~-0.48) | 0.017 | -2.05(-4.51~0.41) | 0.102 |
| 身心共病 | -5.38(-6.99~-3.76) | <0.001 | -7.95(-9.71~-6.19) | <0.001 | -2.68(-3.65~-1.71) | <0.001 | -2.69(-3.56~-1.83) | <0.001 | -2.39(-4.42~-0.36) | 0.021 | -3.21(-5.00~-1.41) | <0.001 |
| 项目 | 中国 | 印度 | 印度尼西亚 | |||||||||
|---|---|---|---|---|---|---|---|---|---|---|---|---|
| 城市 | 农村 | 城市 | 农村 | 城市 | 农村 | |||||||
| β(95%CI) | P值 | β(95%CI) | P值 | β(95%CI) | P值 | β(95%CI) | P值 | β(95%CI) | P值 | β(95%CI) | P值 | |
| 慢性病类型(无慢性病) | ||||||||||||
| 单一慢性病 | -0.58(-3.01~1.86) | 0.642 | -1.60(-3.22~0.03) | 0.054 | -0.29(-1.80~1.23) | 0.712 | 0.18(-0.96~1.33) | 0.752 | -0.37(-1.82~1.08) | 0.619 | -1.54(-3.68~0.59) | 0.534 |
| 躯体共病 | -0.18(-2.53~2.16) | 0.877 | -0.30(-2.19~1.60) | 0.758 | -0.72(-2.56~1.12) | 0.443 | -0.21(-1.74~1.32) | 0.792 | 1.62(-0.63~3.88) | 0.159 | 1.47(-1.35~4.28) | 0.569 |
| 仅抑郁症状 | -3.00(-6.32~0.31) | 0.076 | -5.60(-8.11~-3.09) | <0.001 | -2.28(-3.82~-0.74) | 0.004 | -2.11(-3.38~-0.84) | 0.001 | -0.56(-2.97~1.85) | 0.648 | -3.61(-6.88~-0.34) | 0.004 |
| 身心共病 | -6.12(-8.47~-3.78) | <0.001 | -8.14(-10.23~-6.05) | <0.001 | -2.33(-3.78~-0.88) | 0.002 | -3.28(-4.38~-2.18) | <0.001 | -1.43(-3.36~0.50) | 0.147 | -5.80(-8.99~-2.60) | 0.007 |
Table 4 Multivariable linear regression analysis of association between physical-mental multimorbidity and cognitive function among participants from China,India and Indonesia(by residency)
| 项目 | 中国 | 印度 | 印度尼西亚 | |||||||||
|---|---|---|---|---|---|---|---|---|---|---|---|---|
| 城市 | 农村 | 城市 | 农村 | 城市 | 农村 | |||||||
| β(95%CI) | P值 | β(95%CI) | P值 | β(95%CI) | P值 | β(95%CI) | P值 | β(95%CI) | P值 | β(95%CI) | P值 | |
| 慢性病类型(无慢性病) | ||||||||||||
| 单一慢性病 | -0.58(-3.01~1.86) | 0.642 | -1.60(-3.22~0.03) | 0.054 | -0.29(-1.80~1.23) | 0.712 | 0.18(-0.96~1.33) | 0.752 | -0.37(-1.82~1.08) | 0.619 | -1.54(-3.68~0.59) | 0.534 |
| 躯体共病 | -0.18(-2.53~2.16) | 0.877 | -0.30(-2.19~1.60) | 0.758 | -0.72(-2.56~1.12) | 0.443 | -0.21(-1.74~1.32) | 0.792 | 1.62(-0.63~3.88) | 0.159 | 1.47(-1.35~4.28) | 0.569 |
| 仅抑郁症状 | -3.00(-6.32~0.31) | 0.076 | -5.60(-8.11~-3.09) | <0.001 | -2.28(-3.82~-0.74) | 0.004 | -2.11(-3.38~-0.84) | 0.001 | -0.56(-2.97~1.85) | 0.648 | -3.61(-6.88~-0.34) | 0.004 |
| 身心共病 | -6.12(-8.47~-3.78) | <0.001 | -8.14(-10.23~-6.05) | <0.001 | -2.33(-3.78~-0.88) | 0.002 | -3.28(-4.38~-2.18) | <0.001 | -1.43(-3.36~0.50) | 0.147 | -5.80(-8.99~-2.60) | 0.007 |
| [1] |
United Nations Department of Economic and Social Affairs PD. World Population Prospects 2022:summary of results[EB/OL]. [2024-10-01].
|
| [2] |
|
| [3] |
|
| [4] |
GBD 2019 Dementia Forecasting Collaborators. Estimation of the global prevalence of dementia in 2019 and forecasted prevalence in 2050:an analysis for the Global Burden of Disease Study 2019[J]. Lancet Public Health,2022,7(2):e105-125.
|
| [5] |
World Health Organization. Global status report on the public health response to dementia[EB/OL]. [2024-10-01].
|
| [6] |
史路平,姚水洪,王薇. 中国老年人群轻度认知障碍患病率及发展趋势的Meta分析[J]. 中国全科医学,2022,25(1):109-114. DOI:10.12114/j.issn.1007-9572.2021.00.315.
|
| [7] |
|
| [8] |
|
| [9] |
|
| [10] |
|
| [11] |
|
| [12] |
|
| [13] |
|
| [14] |
|
| [15] |
|
| [16] |
International Institute for Population Sciences,NPHCE. Longitudinal Ageing Study in India(LASI)Wave 1,2017-18,India Report[EB/OL]. [2024-09-01].
|
| [17] |
|
| [18] |
|
| [19] |
|
| [20] |
|
| [21] |
|
| [22] |
|
| [23] |
|
| [24] |
|
| [25] |
|
| [26] |
Ministry of Health and Family Welfare,Government of India. National Programme for Prevention and Control of Cancer,Diabetes,Cardiovascular Disease and Stroke(2023-2030)[EB/OL]. [2024-02-02].
|
| [27] |
WHO–Ministry of Health and Family Welfare,Government of India. National action plan and monitoring framework for prevention and control of noncommunicable diseases(NCDs)in India[Z]. 2014.
|
| [28] |
|
| [29] |
|
| [30] |
|
| [31] |
|
| [32] |
|
| [33] |
|
| [34] |
Pandu PTM:a community intervention model on prevention and control of NCDs in Indonesia:directorate of non-communicable disease,directorate general of disease prevention and control[Z]. 2017.
|
| [35] |
|
| [36] |
|
| [37] |
张露文,陆翘楚,赵洋. 中国中老年人慢病共病组合及其健康结局差异[J]. 中山大学学报(医学科学版),2023,44(1):159-168.
|
| [38] |
何莉,张逸凡,沈雪纯,等. 中国大陆地区居民慢性病共病的流行趋势:一项meta分析[J]. 中国全科医学,2023,26(29):3599-3607. DOI:10.12114/j.issn.1007-9572.2023.0217.
|
| [1] | LI Wenping, CHEN Jianhua, XU Jiapei, JIN Xue, PAN Zihan, CHI Chunhua. A Scoping Review on the Empowerment of Community Elderly Health Services by Digital-Intelligent Health Management Platforms [J]. Chinese General Practice, 2026, 29(21): 2938-2949. |
| [2] | YU Haiyan, XIANG Tong, GAO Wenjuan, WU Hao. Research and Application of Digital Health Technologies in Multimorbidity Management [J]. Chinese General Practice, 2026, 29(21): 2933-2937. |
| [3] | CHAI Zhihao, ZHANG Weisen, LUO Jiaoling, ZHU Feng, ZHU Tong, JIN Yali, PAN Jing, LU Yingjun, JIANG Chaoqiang. The Mediation Effect of Socioeconomic Status in Childhood Parental Literacy and Cognitive Function in Middle-aged and Older People: Based on Guangzhou Biobank Cohort Study [J]. Chinese General Practice, 2026, 29(21): 2959-2966. |
| [4] | LI Feng, HU Changhao, LUO Xu. Progress in the Study of Influencing Factors and Intervention Strategies of Mental Health in Elderly Patients with Multiple Chronic Conditions [J]. Chinese General Practice, 2026, 29(20): 2816-2828. |
| [5] | WANG Xuan, SHEN Ying, XI Qian, ZHAO Can, MO Yunjian, ZHANG Wenting. Research on Treatment Burden and Influencing Factors of Patients with Multimorbidity in Rural Township Health Centers in Guangxi Zhuang Autonomous Region [J]. Chinese General Practice, 2026, 29(20): 2808-2815. |
| [6] | PANG Shu, SUN ying, JIANG Chunyan. Comparison of the Effectiveness of Fried's Frailty Phenotype and the FRAIL Scale in Assessing Pre-frailty among Community-dwelling Older Adults Undergoing Health Examinations [J]. Chinese General Practice, 2026, 29(19): 2664-2670. |
| [7] | YOU Lili, LIU Lu, CHEN Ying, KANG Qixue, WANG Yuxing, WANG Jingbo, ZHANG Bingli. Fifteen Years Review and Future Prospects of China's National Essential Public Health Services [J]. Chinese General Practice, 2026, 29(17): 2282-2295. |
| [8] | LI Simin, ZHANG Tingting, WANG Kunbo, YANG Jianzhou, PING Weiwei. Effects of Exercise Dosage on Elderly Patients with Sarcopenia: a Meta-analysis [J]. Chinese General Practice, 2026, 29(17): 2400-2409. |
| [9] | YANG Tingting, ZHENG Li, LIANG Daqiang, WU fan, YUAN Xianxian, WEI lai, HU Jin, WANG Junhua, WANG Ziyun. Association between Sleep Fragmentation and Arteriosclerosis among Population Aged 40-65 Years [J]. Chinese General Practice, 2026, 29(16): 2190-2197. |
| [10] | CHEN Yan, SHEN Dequan, SHENG Renlei, CHANG Yujie, YANG Jiaqi, DING Jie, SUN Zhifang, WANG Dahui. Influencing Factors and Importance Ranking of the Utilization of Primary-level Traditional Chinese Medicine Preventive and Health Care Services for the Elderly [J]. Chinese General Practice, 2026, 29(16): 2182-2189. |
| [11] | YU Shan, CHE Yajie, SUBIYINUER· Maimaiti, GUO Kaiyang, FENG Xingxing, YAN Ping. A Comparative Study on the Current Situation and Influencing Factors of Subjective Cognitive Decline among Urban and Rural Elderly People in Xinjiang [J]. Chinese General Practice, 2026, 29(16): 2227-2233. |
| [12] | GUO Jiao, ZHANG Gaojing, LIU Xincan. Quality Evaluation of TCM Clinical Practice Guidelines/Consensus: Based on Two Guideline Evaluation Tools [J]. Chinese General Practice, 2026, 29(15): 2100-2106. |
| [13] | LI Jiali, LIU Fan, KE Lixin, LI Huijuan, WANG Haibo, ZHAO Xiaoxiao, ZHAO Xinke, LU Cuncun. Disease Burden of Obesity among Individuals Aged 60 and above Globally and in China from 1990 to 2021: Trend Analysis and Model-based Projection [J]. Chinese General Practice, 2026, 29(15): 2067-2076. |
| [14] | YAN Wenxin, LIU Jue, LIANG Wannian. Perspectives on Key Issues of the General Practice Discipline Development in China [J]. Chinese General Practice, 2026, 29(13): 1649-1653. |
| [15] | LI Jing, JI Yan, SUN Liu, WANG Hanting, WU Jidong, LIU June. Summary of Best Evidence on the Management of Hearing Loss in Older Adults in Primary Health Care Settings [J]. Chinese General Practice, 2026, 29(13): 1713-1719. |
| Viewed | ||||||
|
Full text |
|
|||||
|
Abstract |
|
|||||