
Chinese General Practice ›› 2024, Vol. 27 ›› Issue (20): 2476-2482.DOI: 10.12114/j.issn.1007-9572.2023.0837
• Original Research • Previous Articles Next Articles
Received:2023-10-20
Revised:2024-03-03
Published:2024-07-15
Online:2024-04-08
Contact:
CHI Gefu
通讯作者:
迟戈夫
作者简介:作者贡献:
侯娜娜负责提出研究思路,设计研究方案,数据的收集,统计学分析,撰写论文并对论文整体负责;冯金章、刘锁红、冯俊芳负责论文修订;薛小艳、尹娜负责选取研究对象,数据收集;迟戈夫负责论文的质量控制与审查,对论文整体负责,监督管理。
基金资助:
Add to citation manager EndNote|Ris|BibTeX
URL: https://www.chinagp.net/EN/10.12114/j.issn.1007-9572.2023.0837
| 组别 | 例数 | 性别[例(%)] | 年龄( | WC ( | BMI ( | SBP ( | DBP ( | |
|---|---|---|---|---|---|---|---|---|
| 男 | 女 | |||||||
| 非MAFLD组 | 1 343 | 626(46.6) | 717(53.4) | 45.4±11.4 | 83.56±9.38 | 23.4±2.9 | 123±16 | 77±11 |
| MAFLD组 | 945 | 688(72.8) | 257(27.2) | 48.1±10.6 | 94.70±9.16 | 27.1±3.1 | 132±16 | 84±11 |
| 检验统计量值 | 155.651a | 5.793 | 28.361 | 29.531 | 12.766 | 15.045 | ||
| P值 | <0.001 | <0.001 | <0.001 | <0.001 | <0.001 | <0.001 | ||
| 组别 | ALT[M(P25,P75),U/L] | AST[M(P25,P75),U/L] | ALP ( | GGT[M(P25,P75),U/L] | Scr( | SUA( | TC( | |
| 非MAFLD组 | 17.0(12.7,24.2) | 16.5(14.2,20.0) | 61.03±17.41 | 20.00(14.40,31.70) | 68.37±13.79 | 323.67±84.88 | 4.80±0.98 | |
| MAFLD组 | 25.8(18.3,37.0) | 18.7(15.6,23.2) | 67.38±18.36 | 35.40(23.30,53.10) | 73.17±14.62 | 377.99±92.30 | 4.97±1.00 | |
| 检验统计量值 | -17.238b | -9.916b | 8.401 | -18.463b | 7.999 | 14.534 | 4.163 | |
| P值 | <0.001 | <0.001 | <0.001 | <0.001 | <0.001 | <0.001 | <0.001 | |
| 组别 | TG[M(P25,P75),mmol/L] | HDL-C( | LDL-C( | FBG[M(P25,P75),mmol/L] | HbA1c[M(P25,P75),%] | Hcy[M(P25,P75),μmol/L] | SUA/Cr[M(P25,P75)] | |
| 非MAFLD组 | 1.19(0.86,1.65) | 1.32±0.29 | 3.08±0.80 | 4.70(4.40,5.06) | 5.50(5.30,5.70) | 12.17(9.83,5.53) | 4.68(4.02,5.53) | |
| MAFLD组 | 1.85(1.33,2.65) | 1.13±0.22 | 3.36±0.82 | 4.99(4.60,5.63) | 5.70(5.50,6.10) | 13.22(10.79,16.93) | 5.11(4.36,6.13) | |
| 检验统计量值 | -18.864b | -18.750 | 8.070 | -12.288b | -12.871b | -6.006b | -8.728b | |
| P值 | <0.001 | <0.001 | <0.001 | <0.001 | <0.001 | <0.001 | <0.001 | |
Table 1 Comparison of general clinical data between MAFLD and non-MAFLD groups
| 组别 | 例数 | 性别[例(%)] | 年龄( | WC ( | BMI ( | SBP ( | DBP ( | |
|---|---|---|---|---|---|---|---|---|
| 男 | 女 | |||||||
| 非MAFLD组 | 1 343 | 626(46.6) | 717(53.4) | 45.4±11.4 | 83.56±9.38 | 23.4±2.9 | 123±16 | 77±11 |
| MAFLD组 | 945 | 688(72.8) | 257(27.2) | 48.1±10.6 | 94.70±9.16 | 27.1±3.1 | 132±16 | 84±11 |
| 检验统计量值 | 155.651a | 5.793 | 28.361 | 29.531 | 12.766 | 15.045 | ||
| P值 | <0.001 | <0.001 | <0.001 | <0.001 | <0.001 | <0.001 | ||
| 组别 | ALT[M(P25,P75),U/L] | AST[M(P25,P75),U/L] | ALP ( | GGT[M(P25,P75),U/L] | Scr( | SUA( | TC( | |
| 非MAFLD组 | 17.0(12.7,24.2) | 16.5(14.2,20.0) | 61.03±17.41 | 20.00(14.40,31.70) | 68.37±13.79 | 323.67±84.88 | 4.80±0.98 | |
| MAFLD组 | 25.8(18.3,37.0) | 18.7(15.6,23.2) | 67.38±18.36 | 35.40(23.30,53.10) | 73.17±14.62 | 377.99±92.30 | 4.97±1.00 | |
| 检验统计量值 | -17.238b | -9.916b | 8.401 | -18.463b | 7.999 | 14.534 | 4.163 | |
| P值 | <0.001 | <0.001 | <0.001 | <0.001 | <0.001 | <0.001 | <0.001 | |
| 组别 | TG[M(P25,P75),mmol/L] | HDL-C( | LDL-C( | FBG[M(P25,P75),mmol/L] | HbA1c[M(P25,P75),%] | Hcy[M(P25,P75),μmol/L] | SUA/Cr[M(P25,P75)] | |
| 非MAFLD组 | 1.19(0.86,1.65) | 1.32±0.29 | 3.08±0.80 | 4.70(4.40,5.06) | 5.50(5.30,5.70) | 12.17(9.83,5.53) | 4.68(4.02,5.53) | |
| MAFLD组 | 1.85(1.33,2.65) | 1.13±0.22 | 3.36±0.82 | 4.99(4.60,5.63) | 5.70(5.50,6.10) | 13.22(10.79,16.93) | 5.11(4.36,6.13) | |
| 检验统计量值 | -18.864b | -18.750 | 8.070 | -12.288b | -12.871b | -6.006b | -8.728b | |
| P值 | <0.001 | <0.001 | <0.001 | <0.001 | <0.001 | <0.001 | <0.001 | |
| 组别 | 例数 | 性别[例(%)] | 年龄( | WC ( | BMI ( | SBP ( | DBP ( | |
|---|---|---|---|---|---|---|---|---|
| 男 | 女 | |||||||
| Q1组 | 574 | 298(22.7) | 276(28.3) | 48.7±10.9 | 85.36±10.41 | 24.0±3.2 | 126±17 | 79±11 |
| Q2组 | 573 | 341(26.0) | 232(23.8) | 46.7±10.8c | 87.36±10.37c | 24.7±3.4c | 127±16 | 80±12 |
| Q3组 | 570 | 341(26.0) | 229(23.5) | 46.4±11.2c | 88.55±10.00c | 25.0±3.3c | 127±16 | 80±12 |
| Q4组 | 571 | 334(25.4) | 237(24.3) | 44.2±11.1cd | 91.38±11.45cde | 26.0±3.7cde | 127±17 | 81±12c |
| 检验统计量值 | 4.714a | 15.468b | 32.454b | 34.756b | 0.747b | 2.889b | ||
| P值 | 0.030 | <0.001 | <0.001 | <0.001 | 0.524 | 0.034 | ||
| 组别 | ALT [M(P25,P75),U/L] | AST [M(P25,P75),U/L] | ALP ( | GGT [M(P25,P75),U/L] | Scr ( | SUA ( | TC ( | |
| Q1组 | 16.4(12.4,23.5) | 16.6(14.1,20.0) | 62.08±17.90 | 20.25(13.90,33.15) | 74.97±15.70 | 267.24±64.05 | 4.71±0.96 | |
| Q2组 | 18.8(13.5,26.8)c | 16.9(14.3,20.8) | 62.92±18.60 | 23.30(15.65,39.35)c | 72.24±13.53 | 324.83±63.21c | 4.75±0.99 | |
| Q3组 | 21.5(15.2,29.7)cd | 17.8(15.2,21.7)cd | 64.61±17.22 | 26.55(18.25,44.28)cd | 69.93±13.25cd | 367.22±70.07cd | 4.93±0.96cd | |
| Q4组 | 25.5(17.5,35.9)cde | 18.4(15.2,23.1)cd | 65.02±18.44c | 33.60(21.30,53.50)cde | 64.24±12.43cde | 425.66±86.05cde | 5.10±1.01cde | |
| 检验统计量值 | 168.886 | 46.385 | 3.386b | 150.397 | 158.306 | 927.158 | 18.853b | |
| P值 | <0.001 | <0.001 | 0.017 | <0.001 | <0.001 | <0.001 | <0.001 | |
| 组别 | TG [M(P25,P75),mmol/L] | HDL-C ( | LDL-C ( | FBG [M(P25,P75),mmol/L] | HbA1c [M(P25,P75),%] | Hcy [M(P25,P75),μmol/L] | ||
| Q1组 | 1.20(0.87,1.69) | 1.30±0.30 | 3.17±0.86 | 4.82(4.50,5.23) | 5.60(5.40,5.80) | 12.66(10.15,16.90) | ||
| Q2组 | 1.32(0.94,1.91)c | 1.25±0.28c | 3.16±0.82 | 4.79(4.49,5.21) | 5.60(5.40,5.80) | 12.48(9.98,15.72) | ||
| Q3组 | 1.48(1.06,2.19)cd | 1.23±0.27c | 3.23±0.81 | 4.75(4.45,5.19) | 5.60(5.40,5.90) | 12.73(10.20,15.79) | ||
| Q4组 | 1.70(1.19,2.54)cde | 1.18±0.26cde | 3.20±0.80 | 4.82(4.44,5.43) | 5.60(5.40,5.90)c | 12.34(10.07,16.07) | ||
| 检验统计量值 | 138.296 | 60.732b | 0.967b | 2.889 | 9.775 | 1.670 | ||
| P值 | <0.001 | <0.001 | 0.407 | 0.409 | 0.021 | 0.644 | ||
Table 2 Comparison of general clinical data in SUA/Cr quartile groupings
| 组别 | 例数 | 性别[例(%)] | 年龄( | WC ( | BMI ( | SBP ( | DBP ( | |
|---|---|---|---|---|---|---|---|---|
| 男 | 女 | |||||||
| Q1组 | 574 | 298(22.7) | 276(28.3) | 48.7±10.9 | 85.36±10.41 | 24.0±3.2 | 126±17 | 79±11 |
| Q2组 | 573 | 341(26.0) | 232(23.8) | 46.7±10.8c | 87.36±10.37c | 24.7±3.4c | 127±16 | 80±12 |
| Q3组 | 570 | 341(26.0) | 229(23.5) | 46.4±11.2c | 88.55±10.00c | 25.0±3.3c | 127±16 | 80±12 |
| Q4组 | 571 | 334(25.4) | 237(24.3) | 44.2±11.1cd | 91.38±11.45cde | 26.0±3.7cde | 127±17 | 81±12c |
| 检验统计量值 | 4.714a | 15.468b | 32.454b | 34.756b | 0.747b | 2.889b | ||
| P值 | 0.030 | <0.001 | <0.001 | <0.001 | 0.524 | 0.034 | ||
| 组别 | ALT [M(P25,P75),U/L] | AST [M(P25,P75),U/L] | ALP ( | GGT [M(P25,P75),U/L] | Scr ( | SUA ( | TC ( | |
| Q1组 | 16.4(12.4,23.5) | 16.6(14.1,20.0) | 62.08±17.90 | 20.25(13.90,33.15) | 74.97±15.70 | 267.24±64.05 | 4.71±0.96 | |
| Q2组 | 18.8(13.5,26.8)c | 16.9(14.3,20.8) | 62.92±18.60 | 23.30(15.65,39.35)c | 72.24±13.53 | 324.83±63.21c | 4.75±0.99 | |
| Q3组 | 21.5(15.2,29.7)cd | 17.8(15.2,21.7)cd | 64.61±17.22 | 26.55(18.25,44.28)cd | 69.93±13.25cd | 367.22±70.07cd | 4.93±0.96cd | |
| Q4组 | 25.5(17.5,35.9)cde | 18.4(15.2,23.1)cd | 65.02±18.44c | 33.60(21.30,53.50)cde | 64.24±12.43cde | 425.66±86.05cde | 5.10±1.01cde | |
| 检验统计量值 | 168.886 | 46.385 | 3.386b | 150.397 | 158.306 | 927.158 | 18.853b | |
| P值 | <0.001 | <0.001 | 0.017 | <0.001 | <0.001 | <0.001 | <0.001 | |
| 组别 | TG [M(P25,P75),mmol/L] | HDL-C ( | LDL-C ( | FBG [M(P25,P75),mmol/L] | HbA1c [M(P25,P75),%] | Hcy [M(P25,P75),μmol/L] | ||
| Q1组 | 1.20(0.87,1.69) | 1.30±0.30 | 3.17±0.86 | 4.82(4.50,5.23) | 5.60(5.40,5.80) | 12.66(10.15,16.90) | ||
| Q2组 | 1.32(0.94,1.91)c | 1.25±0.28c | 3.16±0.82 | 4.79(4.49,5.21) | 5.60(5.40,5.80) | 12.48(9.98,15.72) | ||
| Q3组 | 1.48(1.06,2.19)cd | 1.23±0.27c | 3.23±0.81 | 4.75(4.45,5.19) | 5.60(5.40,5.90) | 12.73(10.20,15.79) | ||
| Q4组 | 1.70(1.19,2.54)cde | 1.18±0.26cde | 3.20±0.80 | 4.82(4.44,5.43) | 5.60(5.40,5.90)c | 12.34(10.07,16.07) | ||
| 检验统计量值 | 138.296 | 60.732b | 0.967b | 2.889 | 9.775 | 1.670 | ||
| P值 | <0.001 | <0.001 | 0.407 | 0.409 | 0.021 | 0.644 | ||
| 项目 | MAFLD组 | 非MAFLD组 | ||
|---|---|---|---|---|
| rs值 | P值 | rs值 | P值 | |
| 性别 | 0.063 | 0.055 | -0.030 | 0.264 |
| 年龄 | -0.217 | <0.001 | -0.123 | <0.001 |
| WC | 0.084 | 0.010 | 0.150 | <0.001 |
| BMI | 0.074 | 0.023 | 0.159 | <0.001 |
| SBP | -0.001 | 0.985 | -0.011 | 0.678 |
| DBP | 0.012 | 0.714 | -0.013 | 0.635 |
| ALT | 0.252 | <0.001 | 0.207 | <0.001 |
| AST | 0.147 | <0.001 | 0.074 | 0.007 |
| ALP | 0.019 | 0.557 | 0.056 | 0.041 |
| GGT | 0.212 | <0.001 | 0.216 | <0.001 |
| Scr | -0.381 | <0.001 | -0.259 | <0.001 |
| SUA | 0.648 | <0.001 | 0.664 | <0.001 |
| TC | 0.191 | <0.001 | 0.121 | <0.001 |
| TG | 0.165 | <0.001 | 0.207 | <0.001 |
| HDL-C | -0.050 | 0.121 | -0.142 | <0.001 |
| LDL-C | 0.023 | 0.489 | -0.018 | 0.520 |
| FBG | -0.050 | 0.122 | -0.061 | 0.024 |
| HbA1c | -0.022 | 0.490 | 0.017 | 0.533 |
| Hcy | -0.083 | 0.011 | -0.010 | 0.726 |
Table 3 Correlation analysis of SUA/Cr with clinical data of study participants
| 项目 | MAFLD组 | 非MAFLD组 | ||
|---|---|---|---|---|
| rs值 | P值 | rs值 | P值 | |
| 性别 | 0.063 | 0.055 | -0.030 | 0.264 |
| 年龄 | -0.217 | <0.001 | -0.123 | <0.001 |
| WC | 0.084 | 0.010 | 0.150 | <0.001 |
| BMI | 0.074 | 0.023 | 0.159 | <0.001 |
| SBP | -0.001 | 0.985 | -0.011 | 0.678 |
| DBP | 0.012 | 0.714 | -0.013 | 0.635 |
| ALT | 0.252 | <0.001 | 0.207 | <0.001 |
| AST | 0.147 | <0.001 | 0.074 | 0.007 |
| ALP | 0.019 | 0.557 | 0.056 | 0.041 |
| GGT | 0.212 | <0.001 | 0.216 | <0.001 |
| Scr | -0.381 | <0.001 | -0.259 | <0.001 |
| SUA | 0.648 | <0.001 | 0.664 | <0.001 |
| TC | 0.191 | <0.001 | 0.121 | <0.001 |
| TG | 0.165 | <0.001 | 0.207 | <0.001 |
| HDL-C | -0.050 | 0.121 | -0.142 | <0.001 |
| LDL-C | 0.023 | 0.489 | -0.018 | 0.520 |
| FBG | -0.050 | 0.122 | -0.061 | 0.024 |
| HbA1c | -0.022 | 0.490 | 0.017 | 0.533 |
| Hcy | -0.083 | 0.011 | -0.010 | 0.726 |
| 变量 | B | SE | Waldχ2值 | P值 | OR(95%CI) |
|---|---|---|---|---|---|
| WC | 0.034 | 0.009 | 13.305 | <0.001 | 1.034(1.016~1.053) |
| BMI | 0.292 | 0.029 | 101.876 | <0.001 | 1.340(1.266~1.418) |
| GGT | 0.006 | 0.002 | 14.117 | <0.001 | 1.006(1.003~1.010) |
| SUA | 0.002 | 0.001 | 6.651 | 0.010 | 1.002(1.000~1.003) |
| TG | 0.277 | 0.057 | 24.051 | <0.001 | 1.319(1.181~1.474) |
| HDL-C | -1.097 | 0.248 | 19.486 | <0.001 | 0.334(0.205~0.543) |
| HbA1c | 0.299 | 0.066 | 20.301 | <0.001 | 1.348(1.184~1.536) |
Table 4 Multivariate Logistic regression analysis of factors affecting the prevalence of MAFLD
| 变量 | B | SE | Waldχ2值 | P值 | OR(95%CI) |
|---|---|---|---|---|---|
| WC | 0.034 | 0.009 | 13.305 | <0.001 | 1.034(1.016~1.053) |
| BMI | 0.292 | 0.029 | 101.876 | <0.001 | 1.340(1.266~1.418) |
| GGT | 0.006 | 0.002 | 14.117 | <0.001 | 1.006(1.003~1.010) |
| SUA | 0.002 | 0.001 | 6.651 | 0.010 | 1.002(1.000~1.003) |
| TG | 0.277 | 0.057 | 24.051 | <0.001 | 1.319(1.181~1.474) |
| HDL-C | -1.097 | 0.248 | 19.486 | <0.001 | 0.334(0.205~0.543) |
| HbA1c | 0.299 | 0.066 | 20.301 | <0.001 | 1.348(1.184~1.536) |
| 组别 | 模型1 | 模型2 | 模型3 | |||
|---|---|---|---|---|---|---|
| OR(95%CI) | P值 | OR(95%CI) | P值 | OR(95%CI) | P值 | |
| Q1组 | 1.000 | — | 1.000 | — | 1.000 | — |
| Q2组 | 1.339(1.047~1.712) | 0.020 | 1.140(0.847~1.533) | 0.388 | 1.116(0.816~1.527) | 0.491 |
| Q3组 | 1.769(1.387~2.255) | <0.001 | 1.452(1.084~1.945) | 0.012 | 1.386(1.009~1.904) | 0.044 |
| Q4组 | 2.689(2.111~3.426) | <0.001 | 1.935(1.435~2.610) | <0.001 | 1.734(1.220~2.465) | 0.002 |
Table 5 Multivariate Logistic regression analysis of the risk of prevalence of MAFLD in subgroups with different SUA/Cr levels
| 组别 | 模型1 | 模型2 | 模型3 | |||
|---|---|---|---|---|---|---|
| OR(95%CI) | P值 | OR(95%CI) | P值 | OR(95%CI) | P值 | |
| Q1组 | 1.000 | — | 1.000 | — | 1.000 | — |
| Q2组 | 1.339(1.047~1.712) | 0.020 | 1.140(0.847~1.533) | 0.388 | 1.116(0.816~1.527) | 0.491 |
| Q3组 | 1.769(1.387~2.255) | <0.001 | 1.452(1.084~1.945) | 0.012 | 1.386(1.009~1.904) | 0.044 |
| Q4组 | 2.689(2.111~3.426) | <0.001 | 1.935(1.435~2.610) | <0.001 | 1.734(1.220~2.465) | 0.002 |
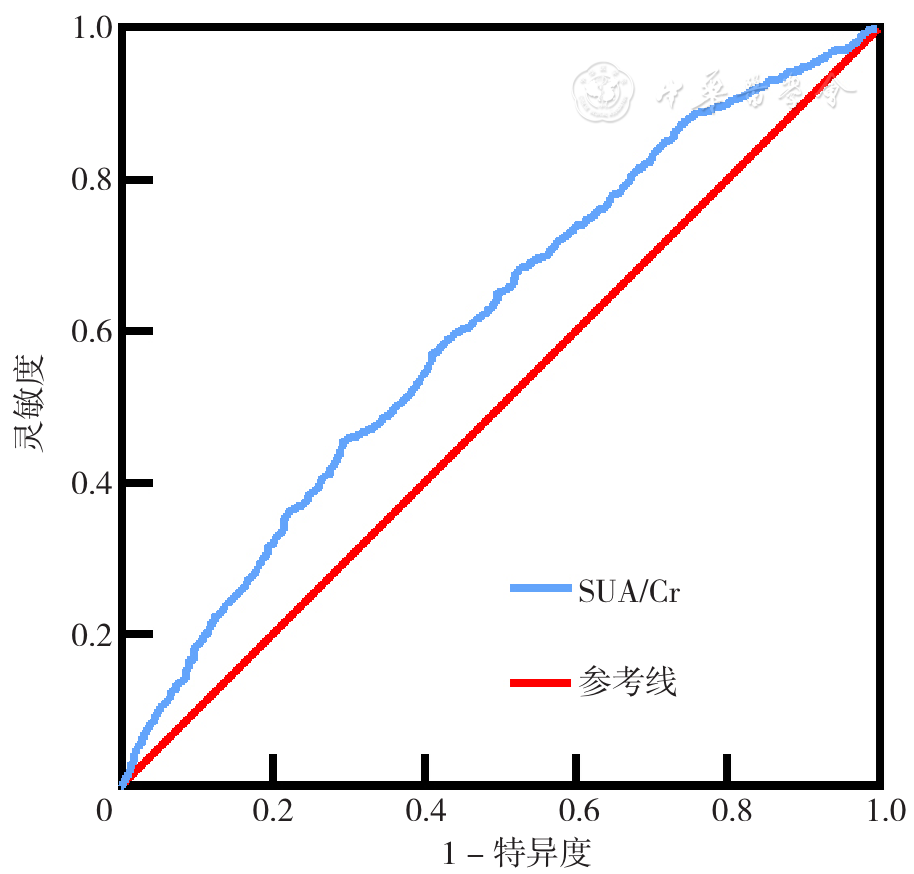
Figure 1 ROC curve of SUA/Cr to predict MAFLD
| [1] |
|
| [2] |
|
| [3] |
|
| [4] |
|
| [5] |
|
| [6] |
秦迁,闫肃,杨阳,等. 血尿酸轨迹与代谢相关脂肪性肝病的相关性纵向数据研究[J]. 中国预防医学杂志,2023,24(8):814-819. DOI:10.16506/j.1009-6639.2023.08.011.
|
| [7] |
|
| [8] |
|
| [9] |
|
| [10] |
郑盼盼,赵维丽,胡庆山,等. 2型糖尿病合并代谢相关脂肪性肝病影响因素的研究[J]. 中国糖尿病杂志,2023,31(2):99-103. DOI:10.3969/j.issn.1006-6187.2023.02.004.
|
| [11] |
|
| [12] |
|
| [13] |
|
| [14] |
|
| [15] |
|
| [16] |
|
| [17] |
|
| [1] | LIU Xin, WEI Yanan, LIU Jie, WANG Jingtong. Research of Influencing Factors for Physical Impairment Combined with Cognitive Impairment in the Elderly [J]. Chinese General Practice, 2024, 27(26): 3281-3288. |
| [2] | FENG Zihang, ZHU Yaning, SUN Ying, LUO Ruzhen, CHEN Hongbo, LIU Jingying, CHENG Ranran, LIU Yanhui. Latent Class Analysis and Influence Factors Study of Cognitive Function among Older People with Chronic Diseases in Community [J]. Chinese General Practice, 2024, 27(26): 3289-3296. |
| [3] | FENG Yuhui, LI Shanshan, TAO Jianwen, HUANG Yanyan. Cognitive Impairment in the Elderly: a Survey and Analysis of Influencing Factors [J]. Chinese General Practice, 2024, 27(26): 3297-3303. |
| [4] | HU Guiping, LIN Ping, ZHAO Zhenjuan, WANG Yini, YAN Mingqiang, SUN Xiao. Relationship between Dietary Inflammatory Potential and Severity of Coronary Artery Disease in Acute Coronary Syndrome Patients [J]. Chinese General Practice, 2024, 27(24): 3000-3006. |
| [5] | LIU Xiaogang, YANG Shicheng, FU Naikuan, SHAO Dujing, ZHANG Peng. The Impact of Dapagliflozin on the Incidence of Contrast-induced Nephropathy in Patients with Type 2 Diabetes Mellitus Underwent Percutaneous Coronary Intervention [J]. Chinese General Practice, 2024, 27(24): 2994-2999. |
| [6] | TU Shuting, LIN Jiaying, ZHUANG Jinyang, XIANG Jingnan, WEI Dongshuai, XIE Yong, JIA Jie. Incidence and Related Factors of Post-stroke Cognitive Impairment: a Multicenter Cross-sectional Study Based on Full-cycle Rehabilitation in Stroke [J]. Chinese General Practice, 2024, 27(23): 2829-2837. |
| [7] | LI Mingzhe, TIAN Yichuan, WANG Chenglong, WANG Jingjing. Study on the Independent and Joint Effects of Physical Activity and Sleep on Low Back Pain in Middle-aged and Elderly Adults [J]. Chinese General Practice, 2024, 27(23): 2869-2874. |
| [8] | QIAO Xue, YIN Yongtian, LUO Wenjun, LI Yinghui, YANG Jinguang, LI Jingwei, CHEN Hongzhi. Root Cause Analysis of the Influencing Factors of Professional Identity in Rural Order-oriented Medical Students: a Qualitative Research [J]. Chinese General Practice, 2024, 27(22): 2752-2758. |
| [9] | SHEN Lijun, LI Hange, WANG Peicheng, ZHU Jiming. Association between Burnout, Workplace Violence, and Turnover Intention among Medical Graduates from a National Compulsory Service Programme [J]. Chinese General Practice, 2024, 27(22): 2766-2772. |
| [10] | OU Yanchen, XIE Yueying, WANG Zhenbang, ZHAO Yue, ZHANG Xin, ZUO Yanli. Family Doctor Teams' Evaluation for Contracted Family Doctor Services and Influencing Factors [J]. Chinese General Practice, 2024, 27(22): 2773-2779. |
| [11] | XIE Kexin, DU Fang, ZHANG Dan. Influencing Factors for the Effectiveness of Family Doctor Contract Services for Elderly Patients with Multimorbidity in Communities [J]. Chinese General Practice, 2024, 27(20): 2512-2519. |
| [12] | LI Xingyang, SUN Wanqi, YIN Mengjie, DOU Tingting, LYU Yili, XU Wei, ZHA Zhenqiu. Sleep Quality and Anxiety and Depression in Patients with Chronic Obstructive Pulmonary Disease and Their Influencing Factors: a Multicenter Cross-sectional Study [J]. Chinese General Practice, 2024, 27(20): 2437-2444. |
| [13] | GUAN Xinyue, WANG Xiaoran, ZHANG Dan. Study of Medication Adherence and Its Influencing Factors among Elderly Patients with Multimorbidity [J]. Chinese General Practice, 2024, 27(20): 2520-2526. |
| [14] | LIAO Yanping, LI Yunyi, ZHOU Zhiheng, WANG Haoxiang. Prevalence and Root Cause Analysis of Adiposity-based Chronic Disease in Older Adults Aged 65 Years and Older [J]. Chinese General Practice, 2024, 27(19): 2357-2363. |
| [15] | JING Guanning, ZOU Ying, ZHUO Xiaoqi, SHI Siyan, SONG Yingliu, YAO Mi, CHI Chunhua, LI Junxia. The Current Status and Factors Influencing Long-term Proton Pump Inhibitor Use and Deprescribing among Community Residents [J]. Chinese General Practice, 2024, 27(19): 2344-2351. |
| Viewed | ||||||
|
Full text |
|
|||||
|
Abstract |
|
|||||