
Chinese General Practice ›› 2022, Vol. 25 ›› Issue (33): 4159-4167.DOI: 10.12114/j.issn.1007-9572.2022.0292
Special Issue: 心血管最新文章合辑; 心肌梗死最新文章合辑
• Article • Previous Articles Next Articles
Received:2022-05-05
Revised:2022-06-22
Published:2022-11-20
Online:2022-08-11
Contact:
JIA Yongping
About author:
通讯作者:
贾永平
作者简介:基金资助:
Add to citation manager EndNote|Ris|BibTeX
URL: https://www.chinagp.net/EN/10.12114/j.issn.1007-9572.2022.0292
| 组别 | 只数 | 初始BW(g) | 最终BW(g) | HW(g) | 标准化HMI |
|---|---|---|---|---|---|
| Sham组 | 7 | 236.0±4.9 | 367.8±20.7 | 1.22±0.27 | 1.00±1.95 |
| MI-SED组 | 7 | 236.3±4.8 | 354.8±34.5 | 1.37±0.19 | 1.18±0.20a |
| MI-HIIT组 | 7 | 237.3±3.7 | 331.2±13.8 | 1.48±0.49 | 1.48±0.05ab |
| MI-MICT组 | 7 | 234.5±4.1 | 345.0±43.0 | 1.32±0.50 | 1.16±0.11c |
| F值 | 0.424 | 1.553 | 2.402 | 4.920 | |
| P值 | 0.738 | 0.232 | 0.098 | 0.010 |
Table 1 Comparison of body weight,heart weight and standardized cardiac mass index of four groups of rats at the end of 4 weeks of intervention
| 组别 | 只数 | 初始BW(g) | 最终BW(g) | HW(g) | 标准化HMI |
|---|---|---|---|---|---|
| Sham组 | 7 | 236.0±4.9 | 367.8±20.7 | 1.22±0.27 | 1.00±1.95 |
| MI-SED组 | 7 | 236.3±4.8 | 354.8±34.5 | 1.37±0.19 | 1.18±0.20a |
| MI-HIIT组 | 7 | 237.3±3.7 | 331.2±13.8 | 1.48±0.49 | 1.48±0.05ab |
| MI-MICT组 | 7 | 234.5±4.1 | 345.0±43.0 | 1.32±0.50 | 1.16±0.11c |
| F值 | 0.424 | 1.553 | 2.402 | 4.920 | |
| P值 | 0.738 | 0.232 | 0.098 | 0.010 |
| 组别 | 只数 | 初始BW(g) | 最终BW(g) | HW(g) | 标准化HMI |
|---|---|---|---|---|---|
| Sham组 | 7 | 236.0±4.9 | 441.7±16.3 | 1.30±0.08 | 0.82±0.15 |
| MI-SED组 | 7 | 235.0±4.8 | 426.7±27.9 | 1.14±0.15 | 1.15±0.15a |
| MI-HIIT组 | 7 | 234.0±3.2 | 384.2±35.1ab | 1.52±0.06ab | 1.20±0.13a |
| MI-MICT组 | 7 | 234.7±2.9 | 391.3±27.5ab | 1.33±0.04bc | 1.12±0.06ac |
| F值 | 0.264 | 6.058 | 16.808 | 13.803 | |
| P值 | 0.850 | 0.004 | <0.001 | <0.001 |
Table 2 Comparison of body weight,heart weight and standardized cardiac mass index of four groups of rats at the end of 8 weeks of intervention
| 组别 | 只数 | 初始BW(g) | 最终BW(g) | HW(g) | 标准化HMI |
|---|---|---|---|---|---|
| Sham组 | 7 | 236.0±4.9 | 441.7±16.3 | 1.30±0.08 | 0.82±0.15 |
| MI-SED组 | 7 | 235.0±4.8 | 426.7±27.9 | 1.14±0.15 | 1.15±0.15a |
| MI-HIIT组 | 7 | 234.0±3.2 | 384.2±35.1ab | 1.52±0.06ab | 1.20±0.13a |
| MI-MICT组 | 7 | 234.7±2.9 | 391.3±27.5ab | 1.33±0.04bc | 1.12±0.06ac |
| F值 | 0.264 | 6.058 | 16.808 | 13.803 | |
| P值 | 0.850 | 0.004 | <0.001 | <0.001 |
| 组别 | 只数 | EF(%) | FS(%) | LVDs(mm) | LVDd(mm) | LVPWs(mm) | LVAWs(mm) |
|---|---|---|---|---|---|---|---|
| Sham组 | 7 | 74.62±2.11 | 46.10±2.51 | 3.02±0.62 | 5.57±1.02 | 2.10±0.45 | 3.05±0.36 |
| MI-SED组 | 7 | 42.64±6.02a | 17.05±1.09a | 6.90±2.25a | 8.32±2.70a | 2.17±1.47 | 1.07±0.43a |
| MI-HIIT组 | 7 | 69.77±7.53ab | 31.71±2.67ab | 5.02±0.21ab | 7.35±0.27a | 2.59±0.09 | 2.54±0.23ab |
| MI-MICT组 | 7 | 65.88±2.82ab | 30.83±2.84ab | 4.47±0.27ab | 6.46±0.23b | 1.93±0.03 | 2.14±0.17ab |
| F值 | 159.750 | 148.918 | 11.187 | 3.970 | 0.785 | 42.698 | |
| P值 | <0.001 | <0.001 | <0.001 | <0.001 | 0.516 | <0.001 |
Table 3 Comparison of cardiac ultrasound results in four groups of rats at the end of 4 weeks of intervention
| 组别 | 只数 | EF(%) | FS(%) | LVDs(mm) | LVDd(mm) | LVPWs(mm) | LVAWs(mm) |
|---|---|---|---|---|---|---|---|
| Sham组 | 7 | 74.62±2.11 | 46.10±2.51 | 3.02±0.62 | 5.57±1.02 | 2.10±0.45 | 3.05±0.36 |
| MI-SED组 | 7 | 42.64±6.02a | 17.05±1.09a | 6.90±2.25a | 8.32±2.70a | 2.17±1.47 | 1.07±0.43a |
| MI-HIIT组 | 7 | 69.77±7.53ab | 31.71±2.67ab | 5.02±0.21ab | 7.35±0.27a | 2.59±0.09 | 2.54±0.23ab |
| MI-MICT组 | 7 | 65.88±2.82ab | 30.83±2.84ab | 4.47±0.27ab | 6.46±0.23b | 1.93±0.03 | 2.14±0.17ab |
| F值 | 159.750 | 148.918 | 11.187 | 3.970 | 0.785 | 42.698 | |
| P值 | <0.001 | <0.001 | <0.001 | <0.001 | 0.516 | <0.001 |
| 组别 | 只数 | EF(%) | FS(%) | LVDs(mm) | LVDd(mm) | LVPWs(mm) | LVAWs(mm) |
|---|---|---|---|---|---|---|---|
| Sham组 | 7 | 76.13±4.35 | 50.27±1.69 | 2.74±0.12 | 5.52±0.10 | 2.60±1.10 | 2.36±0.12 |
| MI-SED组 | 7 | 28.73±8.02a | 19.34±7.03a | 2.65±0.27 | 3.29±0.25a | 1.30±0.16a | 2.35±0.58 |
| MI-HIIT组 | 7 | 79.13±5.20ab | 35.00±2.12ab | 4.71±1.19ab | 7.24±0.18ab | 2.92±0.29b | 2.96±0.34ab |
| MI-MICT组 | 7 | 72.11±2.89ab | 34.13±3.31ab | 4.34±1.08ab | 6.58±1.58b | 2.17±0.27bc | 2.24±0.74c |
| F值 | 32.873 | 56.913 | 21.079 | 27.511 | 60.218 | 20.680 | |
| P值 | <0.001 | <0.001 | <0.001 | <0.001 | <0.001 | <0.001 |
Table 4 Comparison of cardiac ultrasound results in four groups of rats at the end of 8 weeks of intervention
| 组别 | 只数 | EF(%) | FS(%) | LVDs(mm) | LVDd(mm) | LVPWs(mm) | LVAWs(mm) |
|---|---|---|---|---|---|---|---|
| Sham组 | 7 | 76.13±4.35 | 50.27±1.69 | 2.74±0.12 | 5.52±0.10 | 2.60±1.10 | 2.36±0.12 |
| MI-SED组 | 7 | 28.73±8.02a | 19.34±7.03a | 2.65±0.27 | 3.29±0.25a | 1.30±0.16a | 2.35±0.58 |
| MI-HIIT组 | 7 | 79.13±5.20ab | 35.00±2.12ab | 4.71±1.19ab | 7.24±0.18ab | 2.92±0.29b | 2.96±0.34ab |
| MI-MICT组 | 7 | 72.11±2.89ab | 34.13±3.31ab | 4.34±1.08ab | 6.58±1.58b | 2.17±0.27bc | 2.24±0.74c |
| F值 | 32.873 | 56.913 | 21.079 | 27.511 | 60.218 | 20.680 | |
| P值 | <0.001 | <0.001 | <0.001 | <0.001 | <0.001 | <0.001 |
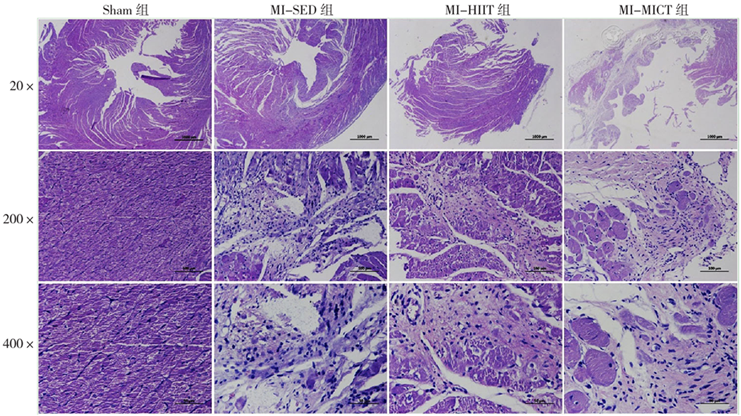
Figure 1 H&E staining results of heart tissues in four groups of rats after 4 weeks of training
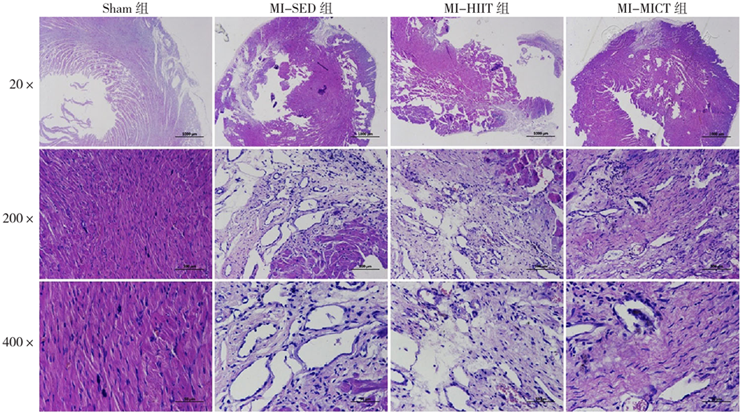
Figure 2 H&E staining results of heart tissues in four groups of rats after 8 weeks of training
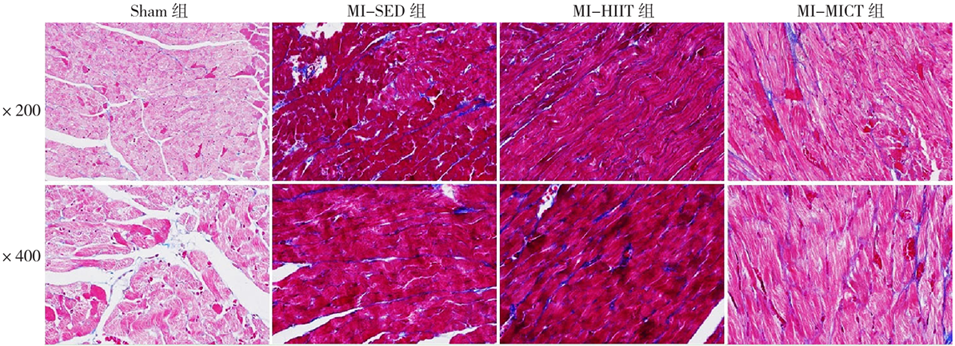
Figure 3 Masson's Trichrome staining results of heart tissues in four groups of rats after 4 weeks of training
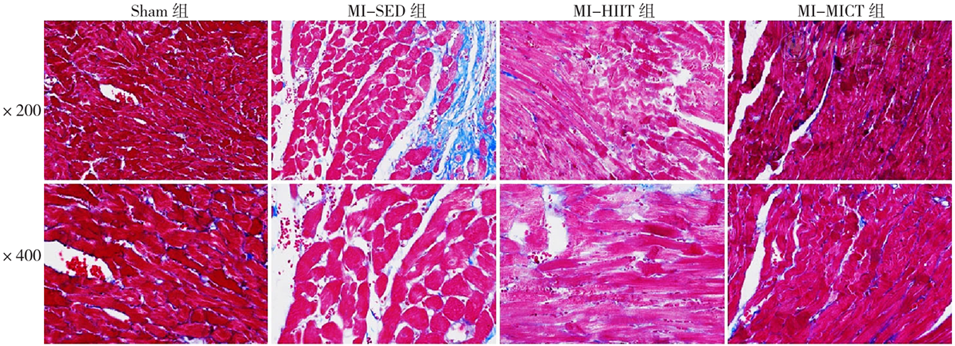
Figure 4 Masson's Trichrome staining results of heart tissues in four groups of rats after 8 weeks of training
| 组别 | 只数 | 胶原纤维占比(%) | 血管新生数(个/mm2) | TNF-α (pg/ml) |
|---|---|---|---|---|
| Sham组 | 7 | 0.7±0.3 | 229.2±52.1 | 8.2±2.0 |
| MI-SED组 | 7 | 3.5±1.1a | 569.4±136.3a | 20.4±5.6a |
| MI-HIIT组 | 7 | 2.3±0.9a | 1 035.0±152.3ab | 31.0±7.9ab |
| MI-MICT组 | 7 | 2.6±0.7a | 883.0±398.8ab | 25.7±8.1a |
| F值 | 12.539 | 15.039 | 14.118 | |
| P值 | <0.001 | <0.001 | <0.001 |
Table 5 Comparison of the proportion of myocardial fibrillar collagen(Masson's Trichrome staining),angiogenesis (CD31immunohistochemistry staining)and serum TNF-α in four groups of rats at the end of 4 weeks of intervention
| 组别 | 只数 | 胶原纤维占比(%) | 血管新生数(个/mm2) | TNF-α (pg/ml) |
|---|---|---|---|---|
| Sham组 | 7 | 0.7±0.3 | 229.2±52.1 | 8.2±2.0 |
| MI-SED组 | 7 | 3.5±1.1a | 569.4±136.3a | 20.4±5.6a |
| MI-HIIT组 | 7 | 2.3±0.9a | 1 035.0±152.3ab | 31.0±7.9ab |
| MI-MICT组 | 7 | 2.6±0.7a | 883.0±398.8ab | 25.7±8.1a |
| F值 | 12.539 | 15.039 | 14.118 | |
| P值 | <0.001 | <0.001 | <0.001 |
| 组别 | 只数 | 胶原纤维占比(%) | 血管新生数(个/mm2) | TNF-α (pg/ml) |
|---|---|---|---|---|
| Sham组 | 7 | 1.0±2.0 | 275.0±50.1 | 6.2±1.9 |
| MI-SED组 | 7 | 6.6±2.9a | 513.9±155.0a | 14.3±2.9a |
| MI-HIIT组 | 7 | 1.6±0.5b | 1 252.1±236.9ab | 18.8±3.8a |
| MI-MICT组 | 7 | 2.4±1.1b | 1 022.9±134.4abc | 9.7±2.1c |
| F值 | 15.817 | 48.189 | 23.506 | |
| P值 | <0.001 | <0.001 | <0.001 |
Table 6 Comparison of the proportion of myocardial fibrillar collagen(Masson's Trichrome staining),angiogenesis (CD31 immunohistochemistry staining)and serum TNF-α in four groups of rats at the end of 8 weeks of intervention
| 组别 | 只数 | 胶原纤维占比(%) | 血管新生数(个/mm2) | TNF-α (pg/ml) |
|---|---|---|---|---|
| Sham组 | 7 | 1.0±2.0 | 275.0±50.1 | 6.2±1.9 |
| MI-SED组 | 7 | 6.6±2.9a | 513.9±155.0a | 14.3±2.9a |
| MI-HIIT组 | 7 | 1.6±0.5b | 1 252.1±236.9ab | 18.8±3.8a |
| MI-MICT组 | 7 | 2.4±1.1b | 1 022.9±134.4abc | 9.7±2.1c |
| F值 | 15.817 | 48.189 | 23.506 | |
| P值 | <0.001 | <0.001 | <0.001 |
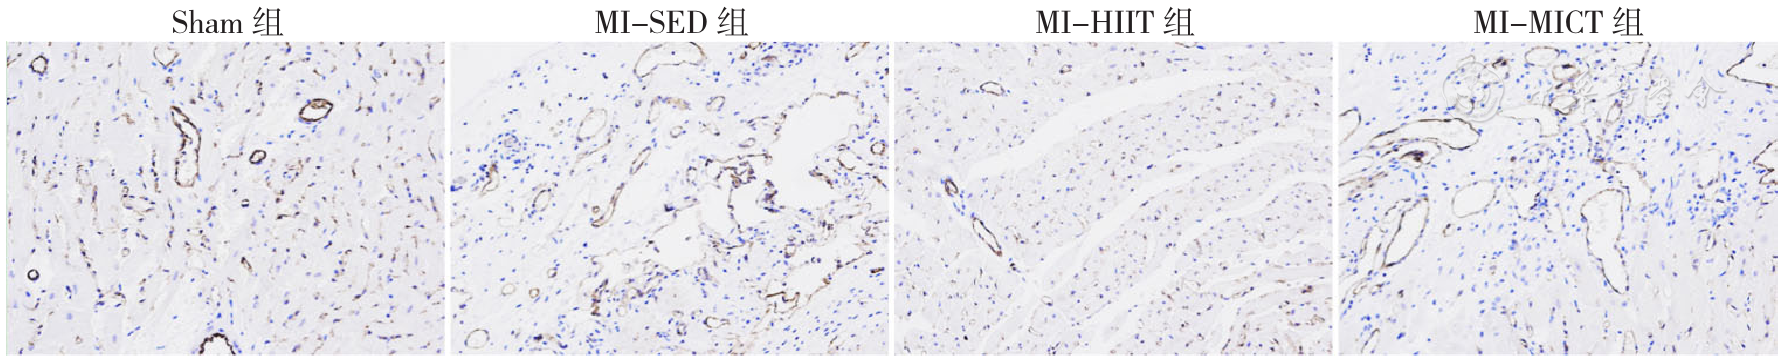
Figure 5 Immunohistochemical results of heart tissues in four groups of rats after 4 weeks of training
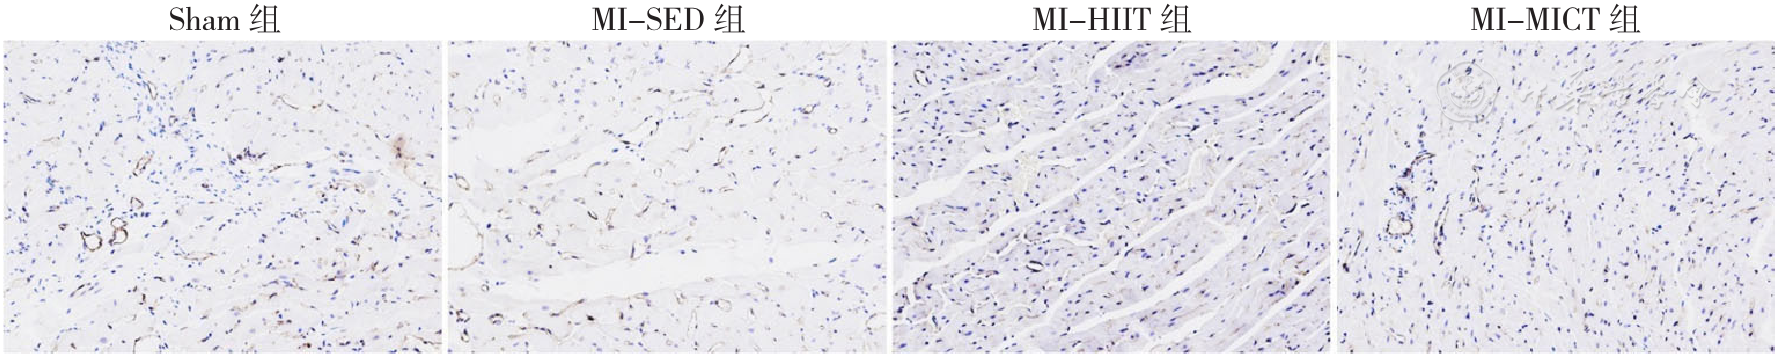
Figure 6 Immunohistochemical results of heart tissues in four groups of rats after 8 weeks of training
| [1] |
COLLABORATORS G B D 2 S. Global,regional,and national burden of stroke and its risk factors,1990-2019:a systematic analysis for the Global Burden of Disease Study 2019[J]. Lancet Neurol,2021,20(10):795-820. DOI:10.1016/S1474-4422(21)00252-0.
|
| [2] |
|
| [3] |
|
| [4] |
|
| [5] |
|
| [6] |
|
| [7] |
|
| [8] |
|
| [9] |
|
| [10] |
|
| [11] |
|
| [12] |
|
| [13] |
|
| [14] |
|
| [15] |
|
| [16] |
|
| [17] |
|
| [18] |
|
| [19] |
|
| [20] |
|
| [21] |
|
| [22] |
|
| [23] |
|
| [24] |
|
| [25] |
|
| [26] |
|
| [1] | WANG Yang, ZHAO Shiting, CHEN Yingying, SUN Zilin, QIU Shanhu. Key Points of Exercise Intervention and Implementation for People with Complications of Type 2 Diabetes Mellitus [J]. Chinese General Practice, 2026, 29(21): 2989-2994. |
| [2] | YUAN Yujuan, TAO Jing, WANG Ying, PENG Hui, YANG Yining. Elevated Neutrophil Percentage to Albumin Ratio is Associated with In-hospital Outcomes in Patients with Acute Myocardial Infarction [J]. Chinese General Practice, 2026, 29(18): 2489-2497. |
| [3] | LI Simin, ZHANG Tingting, WANG Kunbo, YANG Jianzhou, PING Weiwei. Effects of Exercise Dosage on Elderly Patients with Sarcopenia: a Meta-analysis [J]. Chinese General Practice, 2026, 29(17): 2400-2409. |
| [4] | JIN Chunhua, ZHANG Yawen, LI Lianxi. Association between Serum Bilirubin Within the Normal Range and Carotid Plaques in Elderly Patients with Type 2 Diabetes Mellitus [J]. Chinese General Practice, 2026, 29(15): 1986-1991. |
| [5] | LI Zhen, WANG Chengyong. Association of Neutrophil-to-lymphocyte Ratio, Systemic Immune-inflammation Index, and Monocyte-to-lymphocyte Ratio with Disease Prognosis in Patients with Advanced Prostate Cancer [J]. Chinese General Practice, 2026, 29(14): 1878-1882. |
| [6] | XIANG Tong, HUANG Yafang, WU Hao. Investigation Study on Older People's Willingness to Use Webcast Exercise Guidance: Based on the UTAUT Model and the Perceived Risk Theory [J]. Chinese General Practice, 2026, 29(13): 1720-1725. |
| [7] | CHEN Zhang, QIU Shanjiao, LI Anchun, HE Zhiguang, HUANG Wenjing. Interpretation and Discussion of the RACGP Guidelines for Preventive Activities: Promoting Physical Activity among the Working Population in General Practice [J]. Chinese General Practice, 2026, 29(13): 1645-1648. |
| [8] | LI Chunlian, ZHANG Ying, GUO Mingzhao, HE Meichen, XU Lingling, WANG Yongchen. General Practitioners Prescribe Medical Exercise to Promote the Integration of Sports and Medicine [J]. Chinese General Practice, 2026, 29(12): 1618-1623. |
| [9] | LI Li, XU Tianchao, DONG Xiaomei, HUANG Hongfei, CUI Gang, LI Dongdong, ZHANG Ou, FAN Lin, WANG Qi. The Effect of Kidney Tonifying and Brain Strengthening Acupuncture Combined with Sertraline in the Treatment of Elderly Depression: a Randomized Controlled Trial [J]. Chinese General Practice, 2026, 29(11): 1399-1404. |
| [10] | ZHANG Ling, HUANG Shuangying, XU Hui, MEI Huiting, HONG Yongping. Effects of Different Exercise Types on Fall Efficacy in the Elderly: a Network Meta-analysis [J]. Chinese General Practice, 2026, 29(06): 741-751. |
| [11] | WANG Lina, LEI Jingshu, LI Kuibao, WANG Ruiying, LI Xinmiao, WANG Fangfang, GUO Xiaorong, NIU Ruihao, ZHAO Wei, ZHOU Fangfang, ZHAO Jingjing, LEE CHONGYOU. Review on Inflammatory Response in Patients with Acute Myocardial Infarction [J]. Chinese General Practice, 2026, 29(06): 790-801. |
| [12] | JING Tao, QIU Xiaorong, LI Shensen, LIU Jiawei, ZHU Jingyou, WANG Xueqian, SUN Xinyuan, WANG Kan, CAO Yanjun, JI Yelinfan, BAI Yujie. Efficacy Assessment of Exercise Prescription Intervention Based on the New Version of Eyesight Improving Qigong for Visual Fatigue in College Students [J]. Chinese General Practice, 2026, 29(06): 752-759. |
| [13] | CEN Kaiyuan, FATIMAH Ahmedy, CHEN Hong, SHAO Mingchen, MEXMOLLEN Marcus, MOHD Fadzli Shukor. Exercise-based Cardiac Rehabilitation in Acute Myocardial Infarction Management: Global Perspectives, Multimodal Interventions, and Personalized Strategies [J]. Chinese General Practice, 2025, 28(36): 4627-4639. |
| [14] | LIU Yan, YUAN Yanling, LING Rong, WANG Lanyun, SUN Li. Scoping Review of Telemedicine Application in Cardiac Rehabilitation for Coronary Heart Disease Patients [J]. Chinese General Practice, 2025, 28(36): 4640-4647. |
| [15] | NI Mingzhu, WANG Li, XU Zhenjing, SHI Qiao, HOU Zhifeng. Alterations in Serum RAGE/NF-κB Pathway Expression Levels and Their Association with Cognitive Function in Wilson's Disease Patients with Mild Cognitive Impairment [J]. Chinese General Practice, 2025, 28(35): 4430-4434. |
| Viewed | ||||||
|
Full text |
|
|||||
|
Abstract |
|
|||||