
Chinese General Practice ›› 2025, Vol. 28 ›› Issue (03): 305-312.DOI: 10.12114/j.issn.1007-9572.2024.0253
• Article • Previous Articles Next Articles
Received:2024-07-20
Revised:2024-08-18
Published:2025-01-20
Online:2024-10-28
Contact:
RANG Weiqing
通讯作者:
让蔚清
作者简介:作者贡献:
吴霞负责文章构思、撰写和修改;吴霞、张译匀负责资料的收集、整理以及图表的绘制;姚承志、赵湘玲负责分析与讨论、数据校对;熊文婧、让蔚清负责研究设计、数据核准及全文修订。
基金资助:CLC Number:
Add to citation manager EndNote|Ris|BibTeX
URL: https://www.chinagp.net/EN/10.12114/j.issn.1007-9572.2024.0253
| 地区 | 标化死亡率(1/10万) | 标化DALY率(1/10万) | ||||||
|---|---|---|---|---|---|---|---|---|
| 1990年 | 2021年 | AAPC(95%CI)(%) | P值 | 1990年 | 2021年 | AAPC(95%CI)(%) | P值 | |
| 中国 | 46.71 | 44.26 | -0.17(-0.23~-0.11) | <0.001 | 959.47 | 820.87 | -0.50(-0.56~-0.46) | <0.001 |
| 全球 | 75.05 | 46.76 | -1.51(-1.53~-1.47) | <0.001 | 1 608.14 | 1 049.02 | -1.37(-1.40~-1.34) | <0.001 |
| 高SDI地区 | 68.84 | 23.54 | -3.46(-3.50~-3.41) | <0.001 | 1 391.05 | 509.89 | -3.21(-3.26~-3.15) | <0.001 |
| 中高SDI地区 | 95.89 | 53.79 | -1.79(-1.86~-1.70) | <0.001 | 1 940.11 | 1 060.83 | -1.87(-1.96~-1.77) | <0.001 |
| 中SDI地区 | 60.33 | 49.49 | -0.66(-0.69~-0.62) | <0.001 | 1 344.27 | 1 077.41 | -0.72(-0.74~-0.69) | <0.001 |
| 中低SDI地区 | 71.27 | 64.72 | -0.30(-0.35~-0.24) | <0.001 | 1 765.92 | 1 560.06 | -0.37(-0.41~-0.33) | <0.001 |
| 低SDI地区 | 59.36 | 54.75 | -0.26(-0.32~-0.21) | <0.001 | 1 434.74 | 1 258.79 | -0.42(-0.47~-0.38) | <0.001 |
Table 1 Disease burden and the trends of IHD attributable to dietary factors in China,the global and five categories of SDI regions,1990-2021
| 地区 | 标化死亡率(1/10万) | 标化DALY率(1/10万) | ||||||
|---|---|---|---|---|---|---|---|---|
| 1990年 | 2021年 | AAPC(95%CI)(%) | P值 | 1990年 | 2021年 | AAPC(95%CI)(%) | P值 | |
| 中国 | 46.71 | 44.26 | -0.17(-0.23~-0.11) | <0.001 | 959.47 | 820.87 | -0.50(-0.56~-0.46) | <0.001 |
| 全球 | 75.05 | 46.76 | -1.51(-1.53~-1.47) | <0.001 | 1 608.14 | 1 049.02 | -1.37(-1.40~-1.34) | <0.001 |
| 高SDI地区 | 68.84 | 23.54 | -3.46(-3.50~-3.41) | <0.001 | 1 391.05 | 509.89 | -3.21(-3.26~-3.15) | <0.001 |
| 中高SDI地区 | 95.89 | 53.79 | -1.79(-1.86~-1.70) | <0.001 | 1 940.11 | 1 060.83 | -1.87(-1.96~-1.77) | <0.001 |
| 中SDI地区 | 60.33 | 49.49 | -0.66(-0.69~-0.62) | <0.001 | 1 344.27 | 1 077.41 | -0.72(-0.74~-0.69) | <0.001 |
| 中低SDI地区 | 71.27 | 64.72 | -0.30(-0.35~-0.24) | <0.001 | 1 765.92 | 1 560.06 | -0.37(-0.41~-0.33) | <0.001 |
| 低SDI地区 | 59.36 | 54.75 | -0.26(-0.32~-0.21) | <0.001 | 1 434.74 | 1 258.79 | -0.42(-0.47~-0.38) | <0.001 |
| 分类 | 指标 | 时间 | 变化值(95%CI)(%) | P值 |
|---|---|---|---|---|
| 标化死亡率 | APC | 1990—1998年 | -0.63(-1.15~-0.12) | 0.039 |
| 1998—2001年 | 3.39(-1.18~3.98) | 0.180 | ||
| 2001—2004年 | 5.33(2.86~5.98) | 0.034 | ||
| 2004—2007年 | -2.75(-3.35~4.94) | 0.091 | ||
| 2007—2011年 | 1.25(-2.62~2.14) | 0.091 | ||
| 2011—2017年 | -2.63(-3.39~0.87) | 0.058 | ||
| 2017—2021年 | -1.60(-2.25~-0.49) | 0.009 | ||
| AAPC | 1990—2021年 | -0.17(-0.23~-0.11) | <0.001 | |
| 标化DALY率 | APC | 1990—1998年 | -0.93(-1.29~-0.61) | 0.015 |
| 1998—2001年 | 2.32(-1.31~2.77) | 0.187 | ||
| 2001—2004年 | 3.85(1.85~4.34) | 0.038 | ||
| 2004—2007年 | -2.69(-3.14~3.56) | 0.092 | ||
| 2007—2011年 | 0.81(-2.52~1.41) | 0.092 | ||
| 2011—2018年 | -2.41(-2.95~0.49) | 0.056 | ||
| 2018—2021年 | -1.44(-2.17~-0.52) | 0.002 | ||
| AAPC | 1990—2021年 | -0.50(-0.56~-0.46) | <0.001 |
Table 2 Disease burden and the trends of IHD attributable to dietary factors in China,1990-2021
| 分类 | 指标 | 时间 | 变化值(95%CI)(%) | P值 |
|---|---|---|---|---|
| 标化死亡率 | APC | 1990—1998年 | -0.63(-1.15~-0.12) | 0.039 |
| 1998—2001年 | 3.39(-1.18~3.98) | 0.180 | ||
| 2001—2004年 | 5.33(2.86~5.98) | 0.034 | ||
| 2004—2007年 | -2.75(-3.35~4.94) | 0.091 | ||
| 2007—2011年 | 1.25(-2.62~2.14) | 0.091 | ||
| 2011—2017年 | -2.63(-3.39~0.87) | 0.058 | ||
| 2017—2021年 | -1.60(-2.25~-0.49) | 0.009 | ||
| AAPC | 1990—2021年 | -0.17(-0.23~-0.11) | <0.001 | |
| 标化DALY率 | APC | 1990—1998年 | -0.93(-1.29~-0.61) | 0.015 |
| 1998—2001年 | 2.32(-1.31~2.77) | 0.187 | ||
| 2001—2004年 | 3.85(1.85~4.34) | 0.038 | ||
| 2004—2007年 | -2.69(-3.14~3.56) | 0.092 | ||
| 2007—2011年 | 0.81(-2.52~1.41) | 0.092 | ||
| 2011—2018年 | -2.41(-2.95~0.49) | 0.056 | ||
| 2018—2021年 | -1.44(-2.17~-0.52) | 0.002 | ||
| AAPC | 1990—2021年 | -0.50(-0.56~-0.46) | <0.001 |
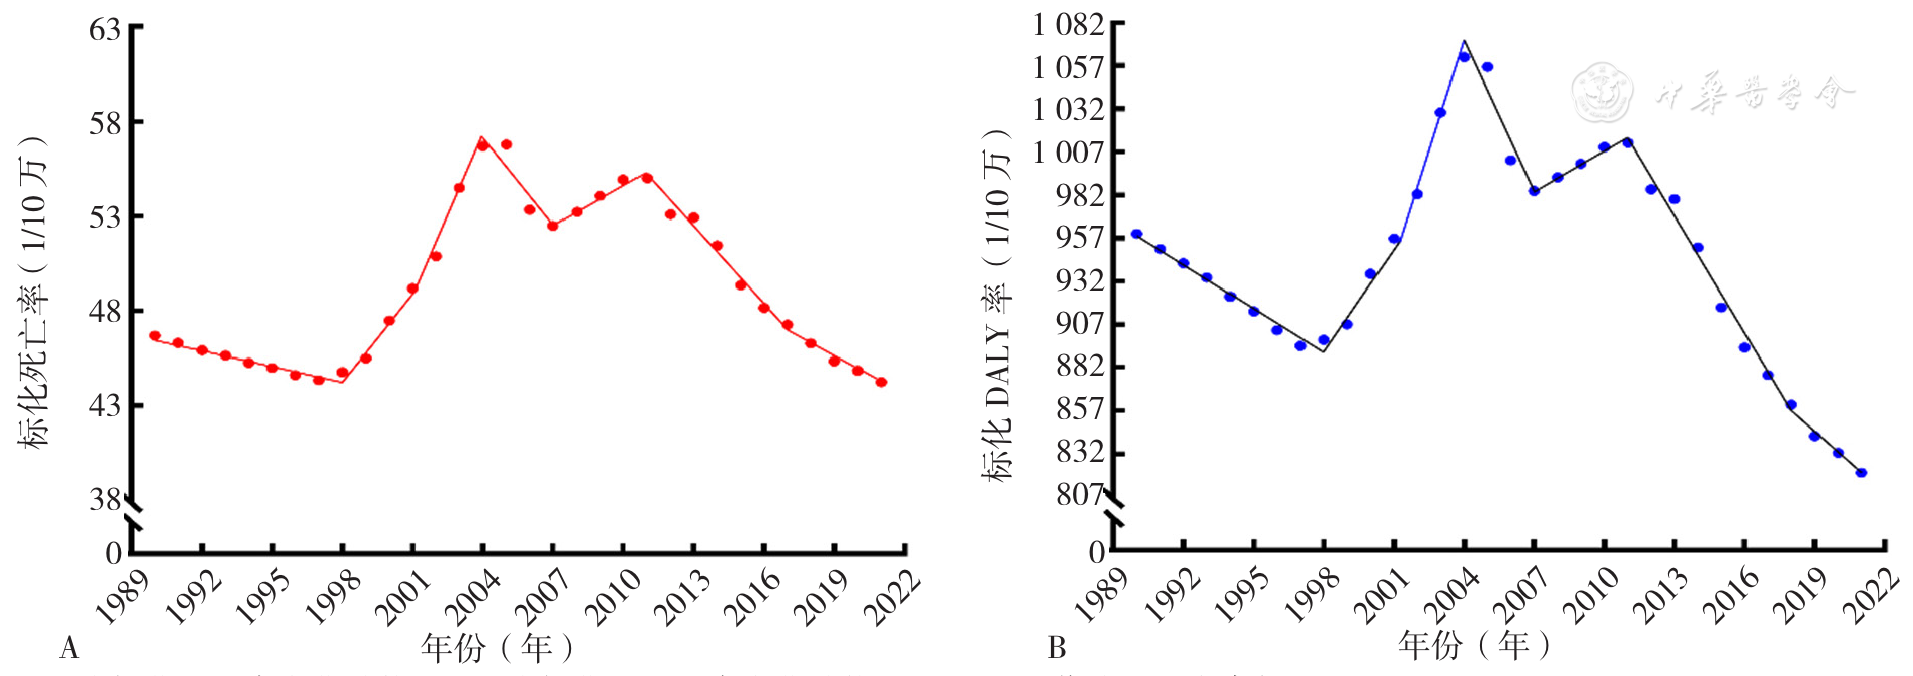
Figure 1 The trends of standardized mortality rate and standardized DALY rate of IHD attributable to dietary factors in China,1990-2021
| 性别 | 标化死亡率(1/10万) | 标化DALY率(1/10万) | ||||||
|---|---|---|---|---|---|---|---|---|
| 1990年 | 2021年 | AAPC(95%CI)(%) | P值 | 1990年 | 2021年 | AAPC(95%CI)(%) | P值 | |
| 男性 | 55.06 | 60.32 | 0.25(0.18~0.31) | <0.001 | 1 118.95 | 1 121.13 | -0.03(-0.08~0.01) | 0.131 |
| 女性 | 41.15 | 32.93 | -0.71(-0.77~-0.65) | <0.001 | 822.71 | 563.17 | -1.23(-1.27~-1.18) | <0.001 |
Table 3 Disease burden and the trends of IHD attributable to dietary factors in Chinese males and females,1990-2021
| 性别 | 标化死亡率(1/10万) | 标化DALY率(1/10万) | ||||||
|---|---|---|---|---|---|---|---|---|
| 1990年 | 2021年 | AAPC(95%CI)(%) | P值 | 1990年 | 2021年 | AAPC(95%CI)(%) | P值 | |
| 男性 | 55.06 | 60.32 | 0.25(0.18~0.31) | <0.001 | 1 118.95 | 1 121.13 | -0.03(-0.08~0.01) | 0.131 |
| 女性 | 41.15 | 32.93 | -0.71(-0.77~-0.65) | <0.001 | 822.71 | 563.17 | -1.23(-1.27~-1.18) | <0.001 |
| 年龄组 | 死亡率(1/10万) | DALY率(1/10万) | ||||||
|---|---|---|---|---|---|---|---|---|
| 1990年 | 2021年 | AAPC(95%CI)(%) | P值 | 1990年 | 2021年 | AAPC(95%CI)(%) | P值 | |
| 15~49岁 | 6.11 | 6.94 | 0.40(0.36~0.45) | <0.001 | 307.95 | 342.94 | 0.34(0.30~0.38) | <0.001 |
| 50~69岁 | 76.23 | 55.31 | -1.07(-1.13~-1.02) | <0.001 | 2 344.48 | 1 687.62 | -1.09(-1.15~-1.05) | <0.001 |
| ≥70岁 | 361.62 | 459.67 | 0.79(0.74~0.84) | <0.001 | 5 619.68 | 6 263.14 | 0.34(0.29~0.39) | <0.001 |
Table 4 Disease burden and the trends of IHD attributable to dietary factors in the Chinese population of different age groups,1990-2021
| 年龄组 | 死亡率(1/10万) | DALY率(1/10万) | ||||||
|---|---|---|---|---|---|---|---|---|
| 1990年 | 2021年 | AAPC(95%CI)(%) | P值 | 1990年 | 2021年 | AAPC(95%CI)(%) | P值 | |
| 15~49岁 | 6.11 | 6.94 | 0.40(0.36~0.45) | <0.001 | 307.95 | 342.94 | 0.34(0.30~0.38) | <0.001 |
| 50~69岁 | 76.23 | 55.31 | -1.07(-1.13~-1.02) | <0.001 | 2 344.48 | 1 687.62 | -1.09(-1.15~-1.05) | <0.001 |
| ≥70岁 | 361.62 | 459.67 | 0.79(0.74~0.84) | <0.001 | 5 619.68 | 6 263.14 | 0.34(0.29~0.39) | <0.001 |
| 饮食因素 | 1990年 | 2021年 | 1990—2021年AAPC(95%CI)(%) | P值 | ||
|---|---|---|---|---|---|---|
| 标化死亡率(1/10万) | 排位 | 标化死亡率(1/10万) | 排位 | |||
| 钠摄入过量 | 12.77 | 1 | 13.60 | 1 | 0.16(0.08~0.23) | 0.005 |
| 全谷物摄入不足 | 11.01 | 2 | 12.47 | 2 | 0.37(0.31~0.42) | <0.001 |
| 坚果和种子摄入不足 | 9.50 | 3 | 6.47 | 4 | -1.24(-1.33~-1.18) | <0.001 |
| 海鲜ω-3脂肪酸摄入不足 | 8.82 | 4 | 4.12 | 6 | -2.45(-2.51~-2.39) | <0.001 |
| ω-6多不饱和脂肪酸摄入不足 | 8.58 | 5 | 9.05 | 3 | 0.16(0.09~0.22) | <0.001 |
| 水果摄入不足 | 8.01 | 6 | 4.30 | 5 | -2.01(-2.05~-1.96) | <0.001 |
| 膳食纤维摄入不足 | 6.34 | 7 | 3.06 | 9 | -2.34(-2.41~-2.27) | <0.001 |
| 豆类摄入不足 | 3.58 | 8 | 3.08 | 8 | -0.50(-0.56~-0.44) | <0.001 |
| 蔬菜摄入不足 | 2.85 | 9 | 0.51 | 10 | -5.44(-5.53~-5.35) | <0.001 |
| 红肉摄入过量 | 1.50 | 10 | 3.66 | 7 | 2.94(2.88~3.01) | <0.001 |
| 反式脂肪酸摄入过量 | 0.57 | 11 | 0.30 | 11 | -2.10(-2.17~-2.04) | <0.001 |
| 加工肉摄入过量 | 0.03 | 12 | 0.07 | 12 | 2.61(2.55~2.66) | <0.001 |
| 含糖饮料摄入过量 | 0.01 | 13 | 0.04 | 13 | 3.85(3.77~3.92) | <0.001 |
Table 5 Changes in the standardized mortality rate of IHD attributable to 13 dietary factors in China,1990-2021
| 饮食因素 | 1990年 | 2021年 | 1990—2021年AAPC(95%CI)(%) | P值 | ||
|---|---|---|---|---|---|---|
| 标化死亡率(1/10万) | 排位 | 标化死亡率(1/10万) | 排位 | |||
| 钠摄入过量 | 12.77 | 1 | 13.60 | 1 | 0.16(0.08~0.23) | 0.005 |
| 全谷物摄入不足 | 11.01 | 2 | 12.47 | 2 | 0.37(0.31~0.42) | <0.001 |
| 坚果和种子摄入不足 | 9.50 | 3 | 6.47 | 4 | -1.24(-1.33~-1.18) | <0.001 |
| 海鲜ω-3脂肪酸摄入不足 | 8.82 | 4 | 4.12 | 6 | -2.45(-2.51~-2.39) | <0.001 |
| ω-6多不饱和脂肪酸摄入不足 | 8.58 | 5 | 9.05 | 3 | 0.16(0.09~0.22) | <0.001 |
| 水果摄入不足 | 8.01 | 6 | 4.30 | 5 | -2.01(-2.05~-1.96) | <0.001 |
| 膳食纤维摄入不足 | 6.34 | 7 | 3.06 | 9 | -2.34(-2.41~-2.27) | <0.001 |
| 豆类摄入不足 | 3.58 | 8 | 3.08 | 8 | -0.50(-0.56~-0.44) | <0.001 |
| 蔬菜摄入不足 | 2.85 | 9 | 0.51 | 10 | -5.44(-5.53~-5.35) | <0.001 |
| 红肉摄入过量 | 1.50 | 10 | 3.66 | 7 | 2.94(2.88~3.01) | <0.001 |
| 反式脂肪酸摄入过量 | 0.57 | 11 | 0.30 | 11 | -2.10(-2.17~-2.04) | <0.001 |
| 加工肉摄入过量 | 0.03 | 12 | 0.07 | 12 | 2.61(2.55~2.66) | <0.001 |
| 含糖饮料摄入过量 | 0.01 | 13 | 0.04 | 13 | 3.85(3.77~3.92) | <0.001 |
| 饮食因素 | 1990年 | 2021年 | 1990—2021年AAPC(95%CI)(%) | P值 | ||
|---|---|---|---|---|---|---|
| 标化DALY率(1/10万) | 排位 | 标化DALY率(1/10万) | 排位 | |||
| 钠摄入过量 | 264.63 | 1 | 260.14 | 1 | -0.10(-0.16~-0.05) | 0.007 |
| 全谷物摄入不足 | 245.16 | 2 | 249.26 | 2 | 0.02(-0.02~0.06) | 0.342 |
| 坚果和种子摄入不足 | 205.77 | 3 | 122.30 | 4 | -1.69(-1.77~-1.64) | <0.001 |
| 海鲜ω-3脂肪酸摄入不足 | 190.45 | 4 | 74.90 | 7 | -3.00(-3.05~-2.95) | <0.001 |
| ω-6多不饱和脂肪酸摄入不足 | 185.85 | 5 | 172.54 | 3 | -0.25(-0.30~-0.20) | <0.001 |
| 水果摄入不足 | 185.35 | 6 | 84.79 | 6 | -2.52(-2.56~-2.49) | <0.001 |
| 膳食纤维摄入不足 | 146.57 | 7 | 65.32 | 8 | -2.61(-2.68~-2.55) | <0.001 |
| 豆类摄入不足 | 77.49 | 8 | 58.48 | 9 | -0.94(-1.00~-0.90) | <0.001 |
| 蔬菜摄入不足 | 62.48 | 9 | 7.56 | 10 | -6.61(-6.71~-6.52) | <0.001 |
| 红肉摄入过量 | 40.49 | 10 | 85.99 | 5 | 2.50(2.44~2.55) | <0.001 |
| 反式脂肪酸摄入过量 | 11.66 | 11 | 5.27 | 11 | -2.55(-2.61~-2.49) | <0.001 |
| 加工肉摄入过量 | 0.78 | 12 | 1.81 | 12 | 2.81(2.75~2.85) | <0.001 |
| 含糖饮料摄入过量 | 0.35 | 13 | 1.05 | 13 | 3.71(3.64~3.78) | <0.001 |
Table 6 Changes in the standardized DALY rate of IHD attributable to 13 dietary factors in China,1990-2021
| 饮食因素 | 1990年 | 2021年 | 1990—2021年AAPC(95%CI)(%) | P值 | ||
|---|---|---|---|---|---|---|
| 标化DALY率(1/10万) | 排位 | 标化DALY率(1/10万) | 排位 | |||
| 钠摄入过量 | 264.63 | 1 | 260.14 | 1 | -0.10(-0.16~-0.05) | 0.007 |
| 全谷物摄入不足 | 245.16 | 2 | 249.26 | 2 | 0.02(-0.02~0.06) | 0.342 |
| 坚果和种子摄入不足 | 205.77 | 3 | 122.30 | 4 | -1.69(-1.77~-1.64) | <0.001 |
| 海鲜ω-3脂肪酸摄入不足 | 190.45 | 4 | 74.90 | 7 | -3.00(-3.05~-2.95) | <0.001 |
| ω-6多不饱和脂肪酸摄入不足 | 185.85 | 5 | 172.54 | 3 | -0.25(-0.30~-0.20) | <0.001 |
| 水果摄入不足 | 185.35 | 6 | 84.79 | 6 | -2.52(-2.56~-2.49) | <0.001 |
| 膳食纤维摄入不足 | 146.57 | 7 | 65.32 | 8 | -2.61(-2.68~-2.55) | <0.001 |
| 豆类摄入不足 | 77.49 | 8 | 58.48 | 9 | -0.94(-1.00~-0.90) | <0.001 |
| 蔬菜摄入不足 | 62.48 | 9 | 7.56 | 10 | -6.61(-6.71~-6.52) | <0.001 |
| 红肉摄入过量 | 40.49 | 10 | 85.99 | 5 | 2.50(2.44~2.55) | <0.001 |
| 反式脂肪酸摄入过量 | 11.66 | 11 | 5.27 | 11 | -2.55(-2.61~-2.49) | <0.001 |
| 加工肉摄入过量 | 0.78 | 12 | 1.81 | 12 | 2.81(2.75~2.85) | <0.001 |
| 含糖饮料摄入过量 | 0.35 | 13 | 1.05 | 13 | 3.71(3.64~3.78) | <0.001 |
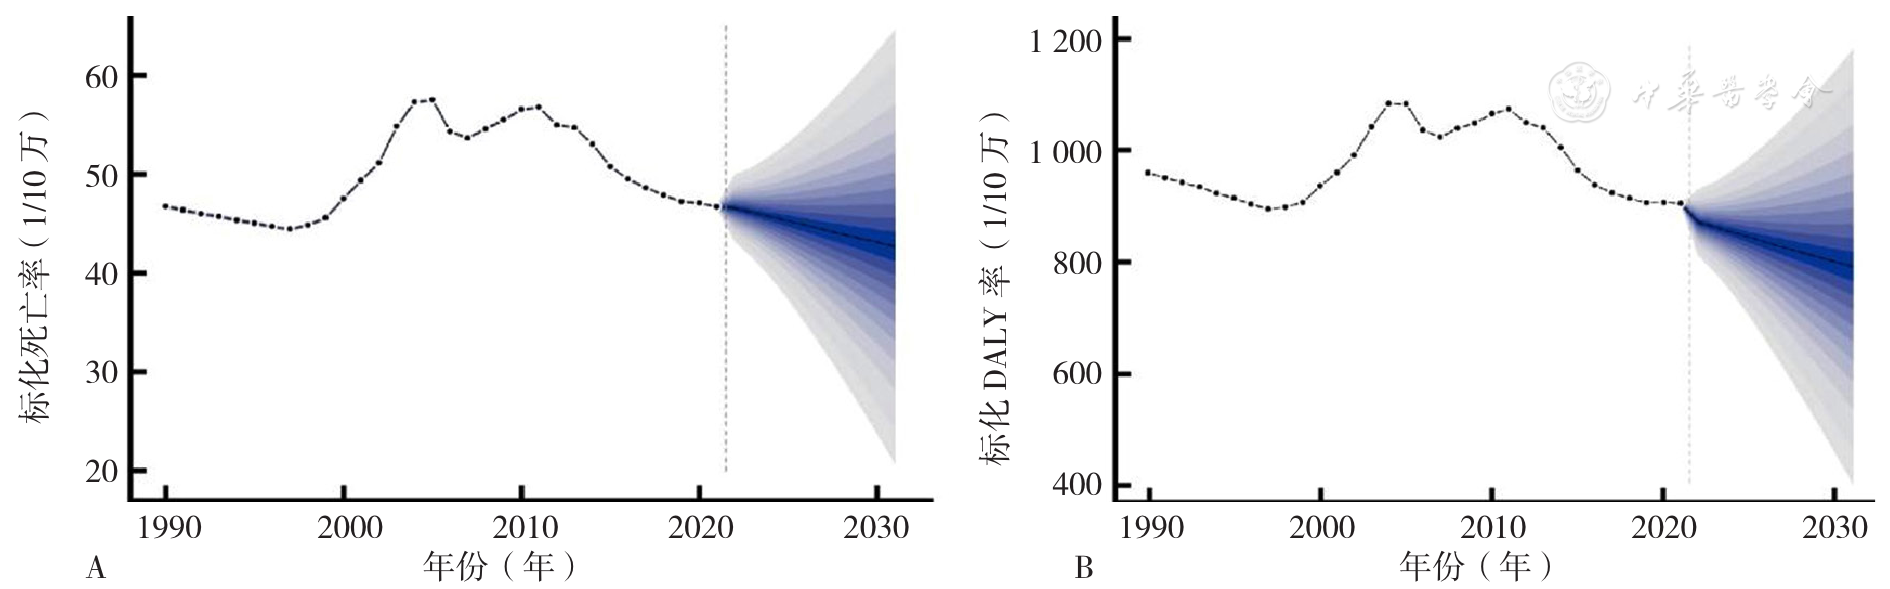
Figure 2 The predictions of standardized mortality rate and standardized DALY rate of IHD attributable to dietary factors in China by the BAPC model,2022-2031
| [1] |
|
| [2] |
|
| [3] |
|
| [4] |
World Health Organization. Global Health Estimates:Life expectancy and leading causes of death and disability[EB/OL]. [2024-08-07].
|
| [5] |
中国心血管病预防指南写作组,中华心血管病杂志编辑委员会. 中国心血管病预防指南(2017)[J]. 中华心血管病杂志,2018,46(1):10-25. DOI:10.3760/cma.j.issn.0253-3758.2018.01.004.
|
| [6] |
GBD Diseases and Injuries Collaborators. Global incidence,prevalence,years lived with disability(YLDs),disability-adjusted life-years(DALYs),and healthy life expectancy(HALE)for 371 diseases and injuries in 204 countries and territories and 811 subnational locations,1990-2021:a systematic analysis for the Global Burden of Disease Study 2021[J]. Lancet,2024,403(10440):2133-2161. DOI:10.1016/S0140-6736(24)00757-8.
|
| [7] |
GBD Risk Factors Collaborators. Global burden and strength of evidence for 88 risk factors in 204 countries and 811 subnational locations,1990-2021:a systematic analysis for the Global Burden of Disease Study 2021[J]. Lancet,2024,403(10440):2162-2203. DOI:10.1016/S0140-6736(24)00933-4.
|
| [8] |
宇传华,白建军. 社会人口指数(SDI)的概念及其应用[J]. 公共卫生与预防医学,2020,31(1):5-10. DOI:10.3969/j.issn.1006-2483.2020.01.002.
|
| [9] |
GBD Healthcare Access and Quality Collaborators. Measuring performance on the Healthcare Access and Quality Index for 195 countries and territories and selected subnational locations:a systematic analysis from the Global Burden of Disease Study 2016[J]. Lancet,2018,391(10136):2236-2271. DOI:10.1016/S0140-6736(18)30994-2.
|
| [10] |
|
| [11] |
吴瑞君,薛琪薪,罗志华. 我国人口迁移和城镇化格局的转折性变化:2000—2020年[J]. 上海行政学院学报,2022,23(1):74-86. DOI:10.3969/j.issn.1009-3176.2022.01.007.
|
| [12] |
中华医学会心血管病学分会,中华心血管病杂志编辑委员会. 中国心血管病预防指南[J]. 中华心血管病杂志,2011,39(1):3-22. DOI:10.3760/cma.j.issn.0253-3758.2011.01.002.
|
| [13] |
杨继,张垚,马腾,等. 1990—2019年中国心血管疾病流行现状、疾病负担及发病预测分析[J]. 中国全科医学,2024,27(2):233-244. DOI:10.12114/j.issn.1007-9572.2023.0470.
|
| [14] |
|
| [15] |
GBD Causes of Death Collaborators. Global,regional,and national age-sex specific mortality for 264 causes of death,1980-2016:a systematic analysis for the Global Burden of Disease Study 2016[J]. Lancet,2017,390(10100):1151-1210. DOI:10.1016/S0140-6736(17)32152-9.
|
| [16] |
|
| [17] |
陆杰华,林嘉琪. 重度老龄化社会的人口特征、风险识别与战略应对[J]. 中国特色社会主义研究,2023(1):59-68.
|
| [18] |
|
| [19] |
|
| [20] |
王雪,祁华清. 新时代中国居民食物消费结构变化与中国食物安全[J]. 农村经济与科技,2021,32(1):104-107. DOI:10.3969/j.issn.1007-7103.2021.01.044.
|
| [21] |
李凡. 中国畜禽肉类生产的时空演变及影响因素[D]. 兰州:兰州大学,2022.
|
| [22] |
逯晓娣,房玥晖,连怡遥,等. 2030年中国成年居民畜肉摄入量预测[J]. 中国食物与营养,2022,28(3):81-85. DOI:10.3969/j.issn.1006-9577.2022.03.016.
|
| [23] |
中国居民营养与慢性病状况报告(2020年)[J]. 营养学报,2020,42(6):521.
|
| [24] |
|
| [25] |
|
| [26] |
|
| [27] |
|
| [28] |
|
| [1] | ZHEN Rui, GU Xufang, GAO Shengwei, ZHANG Bowen, REN Zhenjuan, YANG Ruixuan. Burden of Cardiovascular Diseases Attributable to Metabolic Risk Factors in China 1990—2021 and Projected Trends from 2022 to 2035 [J]. Chinese General Practice, 2026, 29(15): 2077-2083. |
| [2] | ZHANG Sanhua, CHEN Xiaolong, ZHANG Yanfeng. BMI Percentile Reference Curves and Trends in Thinness, Overweight, and Obesity among Preschool Children in Macao [J]. Chinese General Practice, 2026, 29(09): 1146-1154. |
| [3] | ZHANG Yanjing, ZHOU Chunhua, LI Xiaodong, LIU Yan, WANG Jing, YU Jing. Study on the Clinical Value of a Risk Prediction Model for Venlafaxine Plasma Concentration Exceeding the Safety Threshold [J]. Chinese General Practice, 2026, 29(06): 777-782. |
| [4] | LEI Yingying, ZHENG Siying, WANG Wenxin, JIANG Hong. Prevalence Trend and Prediction of Hypertensive Heart Disease in the World and China from 1990 to 2021 [J]. Chinese General Practice, 2026, 29(05): 641-648. |
| [5] | YANG Qinghui, HU Yingxue, NI Pingwei, LIU Xiao. Analysis of the Incidence and Mortality Trends of Lung Cancer in China from 1990 to 2021 and Prediction for 2035 [J]. Chinese General Practice, 2026, 29(02): 256-263. |
| [6] | LI Shunan, ZHANG Shiyan, DENG Yanan, HU Danqing, ZHENG Yuxin, LI Danyang, LI Candong. An Analysis of Trends and Prediction of Disease Burden for Type 2 Diabetic Nephropathy from 1990 to 2021 in China [J]. Chinese General Practice, 2025, 28(33): 4214-4226. |
| [7] | ZHANG Yuan, CHEN Guanhua, LYU Shanshan, JING Yali. Relationship between Thyroid Hormone Sensitivity Indices and Osteoporosis in Patients with Normal Thyroid Function Type 2 Diabetes Mellitus [J]. Chinese General Practice, 2025, 28(29): 3653-3659. |
| [8] | YIN Jiahui, YANG Xinhui, WANG Jingjing, ZHANG Yajing, WANG Lijuan, FU Zuodi, KONG Xiangshuang, GUO Guangxia, LI Yufeng. Predictive Value Waist-to-height Ratio, Waist-to-hip Ratio and Body Mass Index for Metabolic Syndrome [J]. Chinese General Practice, 2025, 28(26): 3258-3263. |
| [9] | WEI Jiaohua, PENG Huiru, PENG Jianye, TAN Wenting, HUANG Jine, FANG Li. Expression of the Serum MOTS-c and Its Correlation with Atrial Remodeling in Patients with Atrial Fibrillation [J]. Chinese General Practice, 2025, 28(26): 3271-3276. |
| [10] | LI Jiaxin, LIU Zhonghui, XIE Shuo, FU Zhifang, SUN Dan, JIAO Hongmei. Trajectory in Biomarkers of Metabolic and Inflammatory States as Early Predictors of Chronic Critical Illness in Aging Patients [J]. Chinese General Practice, 2025, 28(24): 2993-2999. |
| [11] | ZHANG Zhidong, JIN Hua, HU Jihong, JIANG Lu, WANG Li, LONG Kaichong, ZHANG Ronghua. Analysis and Prediction of the Incidence and Mortality Trends of Hypertensive Nephropathy in China from 1990 to 2021 [J]. Chinese General Practice, 2025, 28(18): 2262-2269. |
| [12] | ZHANG Bingqing, WANG Zhongkai, WU Changyong, SUN Huang, LI Ruijie, LIU Wenjie, LUO Yihua, ZHENG Lihui, PENG Yunzhu. Changes and Trend Prediction in the Global Burden of Congenital Heart Defects, 1990-2021 [J]. Chinese General Practice, 2025, 28(18): 2253-2261. |
| [13] | LING Yao, ZHANG Wenbin, WANG Shihong, CHEN Yongze, DONG Wenjiao, DENG Xingyu, DING Yuanlin. Trend Analysis and Forecasting Study on the Changing Disease Burden of Rheumatoid Arthritis in China, 1990-2021 [J]. Chinese General Practice, 2025, 28(15): 1914-1922. |
| [14] | LI Xin, LUO Sha, WANG Hongping, XU Hanqing. Research on the Burden of Migraine among Chinese Young People Aged 10-24 from 1990 to 2021 [J]. Chinese General Practice, 2025, 28(15): 1923-1931. |
| [15] | SUN Qinyu, DENG Yifan, HE Shenghu, ZHANG Jing. Study of the Predictive Value of Neutrophil/Lymphocyte Ratio, Monocyte/High-density Lipoprotein Cholesterol Ratio, and the Combination of the Two for Contrast Nephropathy after Emergency PCI in Patients with Acute ST-segment Elevation Myocardial Infarction [J]. Chinese General Practice, 2025, 28(15): 1891-1897. |
| Viewed | ||||||
|
Full text |
|
|||||
|
Abstract |
|
|||||
