
中国全科医学 ›› 2025, Vol. 28 ›› Issue (16): 1992-2000.DOI: 10.12114/j.issn.1007-9572.2023.0800
所属专题: 全科医生最新文章合辑
刘志扬, 李红艳*( ), 杨创豪
收稿日期:2024-06-11
修回日期:2024-12-07
出版日期:2025-06-05
发布日期:2025-04-22
通讯作者:
李红艳
作者贡献:
刘志扬提出研究思路,设计研究方案,负责研究命题的提出、数据收集、数据处理与初稿撰写;李红艳对文章的结构逻辑、可行性、数据和文字内容进行指导、审查,负责文章的质量控制与审校、论文最终版本的修订,对文章整体负责;杨创豪负责对文章进行审查,并提出修改意见。
基金资助:
LIU Zhiyang, LI Hongyan*(), YANG Chuanghao
Received:2024-06-11
Revised:2024-12-07
Published:2025-06-05
Online:2025-04-22
Contact:
LI Hongyan
摘要: 背景 在提高基层卫生服务能力、推进分级诊疗、实现医防融合的进程下,国家陆续出台了一系列政策支持全科医生的培养,促进全科医生资源合理布局,而现阶段对全科医生分布均衡性的研究仍不够全面,缺少对基层医疗和疾病预防两个方面的关注。 目的 在以往研究的基础上更加全面地设置指标以评价我国省际全科医生的分布特征与均衡性,为全科医生资源优化分布提供理论支持。 方法 研究者于2023年4月自国家卫生健康委员会网站、国家统计局网站以及线下图书馆分别收集2018—2022年《中国卫生健康统计年鉴》、2018—2022年《中国统计年鉴》和2021年《中国城市统计年鉴》的数据,使用每万人全科医生数、每十平方千米全科医生数、全科医生-居民可支配收入比、全科医生-基层医疗卫生机构比、全科医生-疾病预防机构比5项指标,结合描述性统计衡量绝对层面上省际全科医生分布情况;使用人口、面积、收入、基层医疗、疾病预防5个维度的基尼系数,结合洛伦兹曲线衡量省际全科医生在相对层面上的分布差距;使用DAGUM分解基尼系数中的组间基尼系数、组内基尼系数、各区域内部组间基尼系数,结合人口、面积两个方面的集聚度分析进一步衡量省际全科医生分布的均衡性。 结果 2017—2021年,我国全科医生数量在快速增长,2021年每万人口全科医生数均值为2.93人,中位数为2.80人,标准差为0.87;5年内人口维度基尼系数为(0.195±0.047),面积维度为(0.608±0.019),收入维度为(0.401±0.015),基层医疗维度为(0.318±0.058),疾病预防维度为(0.393±0.033);人口维度各年度洛伦兹曲线偏离45度线幅度较小,面积维度和收入维度偏离幅度较大,基层医疗维度和疾病预防维度洛伦兹曲线偏离程度中等;DAGUM分解基尼系数结果中,组间基尼系数贡献率为(59.863%±8.785%),组间差距是造成总体差距的主要原因,超变密度为(25.959%±10.052%),各区域内部差距不可忽视,进一步分解结果显示,2021年华东和华北地区面积维度区域内组间基尼系数较高,分别为0.570和0.504,华北地区收入维度组间基尼系数较高(0.413),差距主要来源于京津沪与区域内其他省份;集聚度分析结果显示,青海省、河南省、安徽省、广东省和吉林省5个省份数值更接近最优值1,其余省份数值高低不一,除天津市、山西省、内蒙古自治区、福建省、湖北省、宁夏回族自治区、新疆维吾尔自治区7个省份外均在向1靠拢。 结论 我国全科医生数量在绝对层面上已经达到既定发展目标,全科医生建设取得了显著成就,但在相对层面上各省份差距仍然较大,集聚度两极分化现象虽在改善,但依旧存在,全科医生分布的均衡性有待进一步优化,应该继续加大培养力度以促进全科医生数量增长,同时依靠信息技术手段鼓励跨区域协作与资源共享。
中图分类号:
| 省份 | 每万人口全科医生数(人) | 每十平方千米全科医生数(人) | 全科医生-居民可支配收入比 | 全科医生-基层医疗机构比 | 全科医生-疾病预防机构比 |
|---|---|---|---|---|---|
| 北京市 | 4.25 | 5.67 | 0.12 | 1.85 | 725.12 |
| 天津市 | 4.09 | 4.69 | 0.12 | 1.59 | 435.30 |
| 河北省 | 3.28 | 1.28 | 0.83 | 0.35 | 158.82 |
| 山西省 | 2.14 | 0.47 | 0.27 | 0.32 | 94.53 |
| 内蒙古自治区 | 2.54 | 0.09 | 0.18 | 0.45 | 88.39 |
| 辽宁省 | 2.82 | 0.80 | 0.34 | 0.64 | 182.10 |
| 吉林省 | 3.48 | 0.56 | 0.30 | 0.52 | 189.41 |
| 黑龙江省 | 2.21 | 0.18 | 0.25 | 0.65 | 83.77 |
| 上海市 | 4.29 | 16.83 | 0.14 | 3.28 | 976.47 |
| 江苏省 | 5.81 | 4.67 | 1.04 | 2.86 | 829.52 |
| 浙江省 | 3.59 | 2.22 | 0.41 | 1.62 | 518.96 |
| 安徽省 | 2.80 | 1.22 | 0.55 | 1.01 | 229.78 |
| 福建省 | 2.78 | 0.94 | 0.29 | 0.63 | 173.39 |
| 江西省 | 2.13 | 0.58 | 0.31 | 0.35 | 85.59 |
| 山东省 | 3.53 | 2.27 | 1.01 | 0.47 | 201.36 |
| 河南省 | 3.42 | 2.06 | 1.26 | 0.58 | 236.39 |
| 湖北省 | 2.17 | 0.83 | 0.41 | 0.68 | 204.48 |
| 湖南省 | 2.71 | 0.91 | 0.56 | 0.48 | 177.79 |
| 广东省 | 3.08 | 2.17 | 0.87 | 1.08 | 419.63 |
| 广西壮族自治区 | 2.60 | 0.55 | 0.49 | 0.57 | 152.62 |
| 海南省 | 2.80 | 3.80 | 0.09 | 0.56 | 114.07 |
| 重庆市 | 2.78 | 1.09 | 0.26 | 0.71 | 352.80 |
| 四川省 | 2.48 | 1.08 | 0.71 | 0.41 | 147.37 |
| 贵州省 | 2.41 | 0.90 | 0.39 | 0.46 | 127.04 |
| 云南省 | 1.97 | 0.47 | 0.36 | 0.61 | 101.29 |
| 西藏自治区 | 1.28 | 0.01 | 0.02 | 0.15 | 12.12 |
| 陕西省 | 3.35 | 0.65 | 0.46 | 0.31 | 86.38 |
| 甘肃省 | 2.98 | 0.19 | 0.34 | 0.44 | 105.14 |
| 青海省 | 2.84 | 0.94 | 0.07 | 0.47 | 51.44 |
| 宁夏回族自治区 | 2.24 | 0.27 | 0.06 | 0.66 | 111.16 |
| 新疆维吾尔自治区 | 1.93 | 0.22 | 0.19 | 0.68 | 69.06 |
| 均值 | 2.93 | 1.89 | 0.41 | 0.82 | 240.04 |
| 中位数 | 2.80 | 0.91 | 0.34 | 0.58 | 158.82 |
| 标准差 | 0.87 | 3.08 | 0.31 | 0.71 | 230.11 |
表1 省际全科医生绝对数量分布的衡量结果
Table 1 The measurement results of the absolute number distrbution of general practitioners in each province
| 省份 | 每万人口全科医生数(人) | 每十平方千米全科医生数(人) | 全科医生-居民可支配收入比 | 全科医生-基层医疗机构比 | 全科医生-疾病预防机构比 |
|---|---|---|---|---|---|
| 北京市 | 4.25 | 5.67 | 0.12 | 1.85 | 725.12 |
| 天津市 | 4.09 | 4.69 | 0.12 | 1.59 | 435.30 |
| 河北省 | 3.28 | 1.28 | 0.83 | 0.35 | 158.82 |
| 山西省 | 2.14 | 0.47 | 0.27 | 0.32 | 94.53 |
| 内蒙古自治区 | 2.54 | 0.09 | 0.18 | 0.45 | 88.39 |
| 辽宁省 | 2.82 | 0.80 | 0.34 | 0.64 | 182.10 |
| 吉林省 | 3.48 | 0.56 | 0.30 | 0.52 | 189.41 |
| 黑龙江省 | 2.21 | 0.18 | 0.25 | 0.65 | 83.77 |
| 上海市 | 4.29 | 16.83 | 0.14 | 3.28 | 976.47 |
| 江苏省 | 5.81 | 4.67 | 1.04 | 2.86 | 829.52 |
| 浙江省 | 3.59 | 2.22 | 0.41 | 1.62 | 518.96 |
| 安徽省 | 2.80 | 1.22 | 0.55 | 1.01 | 229.78 |
| 福建省 | 2.78 | 0.94 | 0.29 | 0.63 | 173.39 |
| 江西省 | 2.13 | 0.58 | 0.31 | 0.35 | 85.59 |
| 山东省 | 3.53 | 2.27 | 1.01 | 0.47 | 201.36 |
| 河南省 | 3.42 | 2.06 | 1.26 | 0.58 | 236.39 |
| 湖北省 | 2.17 | 0.83 | 0.41 | 0.68 | 204.48 |
| 湖南省 | 2.71 | 0.91 | 0.56 | 0.48 | 177.79 |
| 广东省 | 3.08 | 2.17 | 0.87 | 1.08 | 419.63 |
| 广西壮族自治区 | 2.60 | 0.55 | 0.49 | 0.57 | 152.62 |
| 海南省 | 2.80 | 3.80 | 0.09 | 0.56 | 114.07 |
| 重庆市 | 2.78 | 1.09 | 0.26 | 0.71 | 352.80 |
| 四川省 | 2.48 | 1.08 | 0.71 | 0.41 | 147.37 |
| 贵州省 | 2.41 | 0.90 | 0.39 | 0.46 | 127.04 |
| 云南省 | 1.97 | 0.47 | 0.36 | 0.61 | 101.29 |
| 西藏自治区 | 1.28 | 0.01 | 0.02 | 0.15 | 12.12 |
| 陕西省 | 3.35 | 0.65 | 0.46 | 0.31 | 86.38 |
| 甘肃省 | 2.98 | 0.19 | 0.34 | 0.44 | 105.14 |
| 青海省 | 2.84 | 0.94 | 0.07 | 0.47 | 51.44 |
| 宁夏回族自治区 | 2.24 | 0.27 | 0.06 | 0.66 | 111.16 |
| 新疆维吾尔自治区 | 1.93 | 0.22 | 0.19 | 0.68 | 69.06 |
| 均值 | 2.93 | 1.89 | 0.41 | 0.82 | 240.04 |
| 中位数 | 2.80 | 0.91 | 0.34 | 0.58 | 158.82 |
| 标准差 | 0.87 | 3.08 | 0.31 | 0.71 | 230.11 |
| 年份(年) | 人口维度下的全科医生基尼系数 | 面积维度下的全科医生基尼系数 | 收入维度下的全科医生基尼系数 | 基层医疗维度下的全科医生基尼系数 | 疾病预防维度下的全科医生基尼系数 |
|---|---|---|---|---|---|
| 2017 | 0.242 | 0.617 | 0.386 | 0.372 | 0.420 |
| 2018 | 0.238 | 0.619 | 0.412 | 0.375 | 0.425 |
| 2019 | 0.189 | 0.595 | 0.402 | 0.319 | 0.385 |
| 2020 | 0.157 | 0.590 | 0.403 | 0.287 | 0.364 |
| 2021 | 0.147 | 0.589 | 0.416 | 0.260 | 0.360 |
表2 五个维度下的基尼系数
Table 2 GINI coefficients of five dimensions
| 年份(年) | 人口维度下的全科医生基尼系数 | 面积维度下的全科医生基尼系数 | 收入维度下的全科医生基尼系数 | 基层医疗维度下的全科医生基尼系数 | 疾病预防维度下的全科医生基尼系数 |
|---|---|---|---|---|---|
| 2017 | 0.242 | 0.617 | 0.386 | 0.372 | 0.420 |
| 2018 | 0.238 | 0.619 | 0.412 | 0.375 | 0.425 |
| 2019 | 0.189 | 0.595 | 0.402 | 0.319 | 0.385 |
| 2020 | 0.157 | 0.590 | 0.403 | 0.287 | 0.364 |
| 2021 | 0.147 | 0.589 | 0.416 | 0.260 | 0.360 |
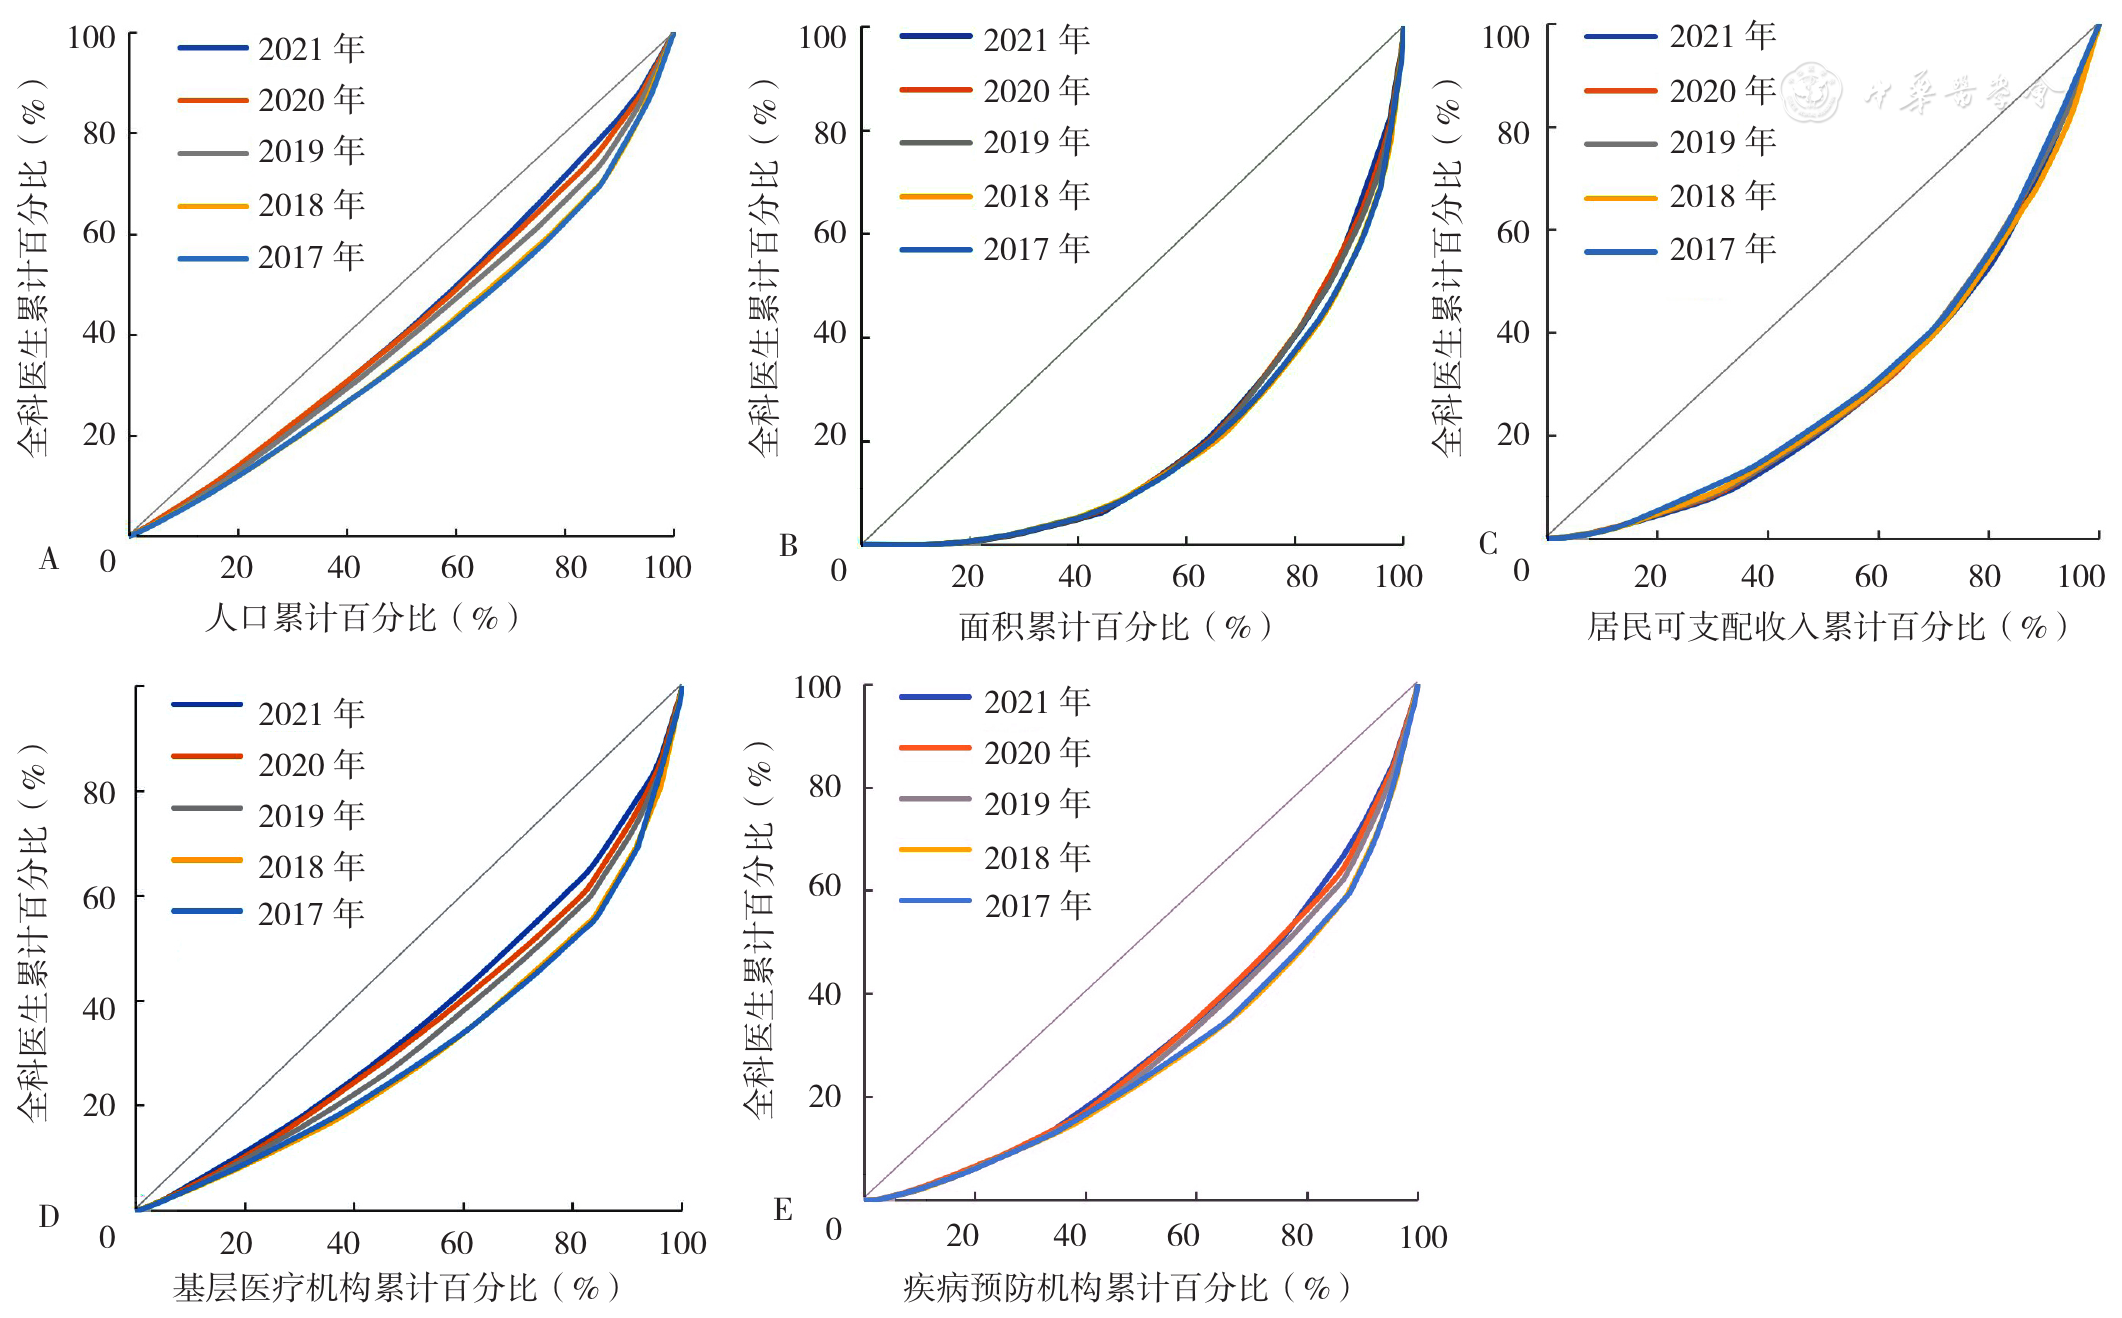
图1 5个维度下2017—2021年洛伦兹曲线注:A为人口维度的各年度洛伦兹曲线,B为面积维度的各年度洛伦兹曲线,C为收入维度的各年度洛伦兹曲线,D为基层医疗维度的各年度洛伦兹曲线,E为疾病预防维度的各年度洛伦兹曲线;横轴代表人口/面积/居民可支配收入/基层医疗机构/疾病预防机构累计百分比,纵轴代表全科医生累计百分比。
Figure 1 Annual Lorentz curve from 2017 to 2021 under five dimensions
| 年份(年) | 维度 | DAGUM分解基尼系数 | 贡献率(%) | |||
|---|---|---|---|---|---|---|
| Gjj | Gjh | Gw | Gnb | Gt | ||
| 2017 | 人口 | 0.036 | 0.160 | 14.364 | 63.425 | 22.211 |
| 面积 | 0.103 | 0.460 | 15.446 | 68.647 | 15.907 | |
| 收入 | 0.047 | 0.209 | 12.543 | 55.523 | 31.934 | |
| 基层医疗机构 | 0.065 | 0.304 | 14.519 | 68.200 | 17.282 | |
| 疾病预防机构 | 0.067 | 0.329 | 13.818 | 67.940 | 18.242 | |
| 2018 | 人口 | 0.034 | 0.134 | 14.931 | 59.147 | 25.922 |
| 面积 | 0.099 | 0.442 | 15.309 | 68.187 | 16.504 | |
| 收入 | 0.051 | 0.223 | 12.939 | 56.504 | 30.557 | |
| 基层医疗机构 | 0.062 | 0.279 | 14.536 | 65.356 | 20.108 | |
| 疾病预防机构 | 0.064 | 0.304 | 13.750 | 64.920 | 21.330 | |
| 2019 | 人口 | 0.027 | 0.099 | 14.759 | 54.510 | 30.731 |
| 面积 | 0.096 | 0.424 | 15.288 | 67.499 | 17.212 | |
| 收入 | 0.049 | 0.212 | 12.572 | 54.788 | 32.641 | |
| 基层医疗机构 | 0.055 | 0.240 | 14.619 | 63.316 | 22.065 | |
| 疾病预防机构 | 0.060 | 0.270 | 13.707 | 61.956 | 24.338 | |
| 2020 | 人口 | 0.022 | 0.079 | 14.547 | 51.382 | 34.072 |
| 面积 | 0.092 | 0.401 | 14.946 | 65.507 | 19.547 | |
| 收入 | 0.049 | 0.210 | 12.609 | 54.309 | 33.083 | |
| 基层医疗机构 | 0.048 | 0.221 | 13.921 | 63.834 | 22.245 | |
| 疾病预防机构 | 0.056 | 0.250 | 13.597 | 60.697 | 25.706 | |
| 2021 | 人口 | 0.022 | 0.088 | 13.917 | 56.023 | 30.060 |
| 面积 | 0.091 | 0.403 | 14.920 | 66.263 | 18.817 | |
| 收入 | 0.052 | 0.206 | 12.911 | 51.078 | 36.011 | |
| 基层医疗机构 | 0.046 | 0.211 | 14.102 | 64.140 | 21.759 | |
| 疾病预防机构 | 0.057 | 0.249 | 13.831 | 60.238 | 25.931 | |
表3 DAGUM分解基尼系数及贡献率结果
Table 3 The results of DAGUM decomposition GINI coefficient and contribution rate
| 年份(年) | 维度 | DAGUM分解基尼系数 | 贡献率(%) | |||
|---|---|---|---|---|---|---|
| Gjj | Gjh | Gw | Gnb | Gt | ||
| 2017 | 人口 | 0.036 | 0.160 | 14.364 | 63.425 | 22.211 |
| 面积 | 0.103 | 0.460 | 15.446 | 68.647 | 15.907 | |
| 收入 | 0.047 | 0.209 | 12.543 | 55.523 | 31.934 | |
| 基层医疗机构 | 0.065 | 0.304 | 14.519 | 68.200 | 17.282 | |
| 疾病预防机构 | 0.067 | 0.329 | 13.818 | 67.940 | 18.242 | |
| 2018 | 人口 | 0.034 | 0.134 | 14.931 | 59.147 | 25.922 |
| 面积 | 0.099 | 0.442 | 15.309 | 68.187 | 16.504 | |
| 收入 | 0.051 | 0.223 | 12.939 | 56.504 | 30.557 | |
| 基层医疗机构 | 0.062 | 0.279 | 14.536 | 65.356 | 20.108 | |
| 疾病预防机构 | 0.064 | 0.304 | 13.750 | 64.920 | 21.330 | |
| 2019 | 人口 | 0.027 | 0.099 | 14.759 | 54.510 | 30.731 |
| 面积 | 0.096 | 0.424 | 15.288 | 67.499 | 17.212 | |
| 收入 | 0.049 | 0.212 | 12.572 | 54.788 | 32.641 | |
| 基层医疗机构 | 0.055 | 0.240 | 14.619 | 63.316 | 22.065 | |
| 疾病预防机构 | 0.060 | 0.270 | 13.707 | 61.956 | 24.338 | |
| 2020 | 人口 | 0.022 | 0.079 | 14.547 | 51.382 | 34.072 |
| 面积 | 0.092 | 0.401 | 14.946 | 65.507 | 19.547 | |
| 收入 | 0.049 | 0.210 | 12.609 | 54.309 | 33.083 | |
| 基层医疗机构 | 0.048 | 0.221 | 13.921 | 63.834 | 22.245 | |
| 疾病预防机构 | 0.056 | 0.250 | 13.597 | 60.697 | 25.706 | |
| 2021 | 人口 | 0.022 | 0.088 | 13.917 | 56.023 | 30.060 |
| 面积 | 0.091 | 0.403 | 14.920 | 66.263 | 18.817 | |
| 收入 | 0.052 | 0.206 | 12.911 | 51.078 | 36.011 | |
| 基层医疗机构 | 0.046 | 0.211 | 14.102 | 64.140 | 21.759 | |
| 疾病预防机构 | 0.057 | 0.249 | 13.831 | 60.238 | 25.931 | |
| 年份(年) | 维度 | 组内基尼系数分解 | ||||||
|---|---|---|---|---|---|---|---|---|
| 东北 | 华东 | 华中 | 华北 | 华南 | 西北 | 西南 | ||
| 2017 | 人口 | 0.104 | 0.295 | 0.096 | 0.221 | 0.119 | 0.142 | 0.110 |
| 面积 | 0.232 | 0.612 | 0.207 | 0.559 | 0.274 | 0.369 | 0.306 | |
| 收入 | 0.028 | 0.293 | 0.214 | 0.302 | 0.404 | 0.293 | 0.369 | |
| 基层医疗机构 | 0.071 | 0.439 | 0.144 | 0.413 | 0.209 | 0.168 | 0.219 | |
| 疾病预防机构 | 0.216 | 0.421 | 0.122 | 0.439 | 0.307 | 0.136 | 0.343 | |
| 2018 | 人口 | 0.071 | 0.289 | 0.108 | 0.213 | 0.120 | 0.087 | 0.127 |
| 面积 | 0.284 | 0.594 | 0.221 | 0.555 | 0.267 | 0.322 | 0.316 | |
| 收入 | 0.074 | 0.352 | 0.228 | 0.301 | 0.399 | 0.287 | 0.330 | |
| 基层医疗机构 | 0.061 | 0.428 | 0.126 | 0.408 | 0.194 | 0.150 | 0.244 | |
| 疾病预防机构 | 0.149 | 0.404 | 0.134 | 0.421 | 0.299 | 0.168 | 0.395 | |
| 2019 | 人口 | 0.126 | 0.254 | 0.024 | 0.168 | 0.067 | 0.090 | 0.077 |
| 面积 | 0.266 | 0.595 | 0.117 | 0.531 | 0.298 | 0.318 | 0.324 | |
| 收入 | 0.050 | 0.331 | 0.165 | 0.381 | 0.368 | 0.302 | 0.342 | |
| 基层医疗机构 | 0.015 | 0.415 | 0.048 | 0.367 | 0.144 | 0.150 | 0.230 | |
| 疾病预防机构 | 0.185 | 0.399 | 0.022 | 0.388 | 0.269 | 0.174 | 0.395 | |
| 2020 | 人口 | 0.092 | 0.209 | 0.047 | 0.162 | 0.026 | 0.059 | 0.097 |
| 面积 | 0.271 | 0.573 | 0.112 | 0.531 | 0.342 | 0.322 | 0.353 | |
| 收入 | 0.057 | 0.329 | 0.151 | 0.366 | 0.346 | 0.301 | 0.387 | |
| 基层医疗机构 | 0.028 | 0.365 | 0.040 | 0.366 | 0.120 | 0.098 | 0.201 | |
| 疾病预防机构 | 0.174 | 0.377 | 0.020 | 0.391 | 0.230 | 0.162 | 0.388 | |
| 2021 | 人口 | 0.099 | 0.170 | 0.100 | 0.142 | 0.038 | 0.107 | 0.129 |
| 面积 | 0.271 | 0.570 | 0.215 | 0.504 | 0.333 | 0.338 | 0.312 | |
| 收入 | 0.064 | 0.335 | 0.254 | 0.413 | 0.355 | 0.388 | 0.347 | |
| 基层医疗机构 | 0.026 | 0.354 | 0.066 | 0.348 | 0.128 | 0.075 | 0.226 | |
| 疾病预防机构 | 0.184 | 0.363 | 0.121 | 0.390 | 0.245 | 0.258 | 0.387 | |
表4 DAGUM分解基尼系数差异结果(组内部分)
Table 4 The results of DAGUM decomposition GINI coefficient differential decomposition(the intra-group part)
| 年份(年) | 维度 | 组内基尼系数分解 | ||||||
|---|---|---|---|---|---|---|---|---|
| 东北 | 华东 | 华中 | 华北 | 华南 | 西北 | 西南 | ||
| 2017 | 人口 | 0.104 | 0.295 | 0.096 | 0.221 | 0.119 | 0.142 | 0.110 |
| 面积 | 0.232 | 0.612 | 0.207 | 0.559 | 0.274 | 0.369 | 0.306 | |
| 收入 | 0.028 | 0.293 | 0.214 | 0.302 | 0.404 | 0.293 | 0.369 | |
| 基层医疗机构 | 0.071 | 0.439 | 0.144 | 0.413 | 0.209 | 0.168 | 0.219 | |
| 疾病预防机构 | 0.216 | 0.421 | 0.122 | 0.439 | 0.307 | 0.136 | 0.343 | |
| 2018 | 人口 | 0.071 | 0.289 | 0.108 | 0.213 | 0.120 | 0.087 | 0.127 |
| 面积 | 0.284 | 0.594 | 0.221 | 0.555 | 0.267 | 0.322 | 0.316 | |
| 收入 | 0.074 | 0.352 | 0.228 | 0.301 | 0.399 | 0.287 | 0.330 | |
| 基层医疗机构 | 0.061 | 0.428 | 0.126 | 0.408 | 0.194 | 0.150 | 0.244 | |
| 疾病预防机构 | 0.149 | 0.404 | 0.134 | 0.421 | 0.299 | 0.168 | 0.395 | |
| 2019 | 人口 | 0.126 | 0.254 | 0.024 | 0.168 | 0.067 | 0.090 | 0.077 |
| 面积 | 0.266 | 0.595 | 0.117 | 0.531 | 0.298 | 0.318 | 0.324 | |
| 收入 | 0.050 | 0.331 | 0.165 | 0.381 | 0.368 | 0.302 | 0.342 | |
| 基层医疗机构 | 0.015 | 0.415 | 0.048 | 0.367 | 0.144 | 0.150 | 0.230 | |
| 疾病预防机构 | 0.185 | 0.399 | 0.022 | 0.388 | 0.269 | 0.174 | 0.395 | |
| 2020 | 人口 | 0.092 | 0.209 | 0.047 | 0.162 | 0.026 | 0.059 | 0.097 |
| 面积 | 0.271 | 0.573 | 0.112 | 0.531 | 0.342 | 0.322 | 0.353 | |
| 收入 | 0.057 | 0.329 | 0.151 | 0.366 | 0.346 | 0.301 | 0.387 | |
| 基层医疗机构 | 0.028 | 0.365 | 0.040 | 0.366 | 0.120 | 0.098 | 0.201 | |
| 疾病预防机构 | 0.174 | 0.377 | 0.020 | 0.391 | 0.230 | 0.162 | 0.388 | |
| 2021 | 人口 | 0.099 | 0.170 | 0.100 | 0.142 | 0.038 | 0.107 | 0.129 |
| 面积 | 0.271 | 0.570 | 0.215 | 0.504 | 0.333 | 0.338 | 0.312 | |
| 收入 | 0.064 | 0.335 | 0.254 | 0.413 | 0.355 | 0.388 | 0.347 | |
| 基层医疗机构 | 0.026 | 0.354 | 0.066 | 0.348 | 0.128 | 0.075 | 0.226 | |
| 疾病预防机构 | 0.184 | 0.363 | 0.121 | 0.390 | 0.245 | 0.258 | 0.387 | |
| 省份 | 2017年 | 2018年 | 2019年 | 2020年 | 2021年 |
|---|---|---|---|---|---|
| 内蒙古自治区&北京市 | 0.006 | 0.097 | 0.163 | 0.146 | 0.181 |
| 内蒙古自治区&天津市 | 0.201 | 0.244 | 0.276 | 0.250 | 0.204 |
| 内蒙古自治区&山西省 | 0.345 | 0.222 | 0.180 | 0.185 | 0.205 |
| 内蒙古自治区&河北省 | 0.508 | 0.473 | 0.581 | 0.570 | 0.646 |
| 北京市&天津市 | 0.194 | 0.151 | 0.119 | 0.107 | 0.024 |
| 北京市&山西省 | 0.350 | 0.312 | 0.333 | 0.323 | 0.373 |
| 北京市&河北省 | 0.513 | 0.544 | 0.680 | 0.661 | 0.740 |
| 天津市&山西省 | 0.510 | 0.443 | 0.435 | 0.416 | 0.393 |
| 天津市&河北省 | 0.643 | 0.643 | 0.739 | 0.717 | 0.751 |
| 山西省&河北省 | 0.198 | 0.280 | 0.448 | 0.430 | 0.508 |
表5 华北地区收入维度组间基尼系数
Table 5 The inter-group GINI coefficient in the income dimensions in North China region
| 省份 | 2017年 | 2018年 | 2019年 | 2020年 | 2021年 |
|---|---|---|---|---|---|
| 内蒙古自治区&北京市 | 0.006 | 0.097 | 0.163 | 0.146 | 0.181 |
| 内蒙古自治区&天津市 | 0.201 | 0.244 | 0.276 | 0.250 | 0.204 |
| 内蒙古自治区&山西省 | 0.345 | 0.222 | 0.180 | 0.185 | 0.205 |
| 内蒙古自治区&河北省 | 0.508 | 0.473 | 0.581 | 0.570 | 0.646 |
| 北京市&天津市 | 0.194 | 0.151 | 0.119 | 0.107 | 0.024 |
| 北京市&山西省 | 0.350 | 0.312 | 0.333 | 0.323 | 0.373 |
| 北京市&河北省 | 0.513 | 0.544 | 0.680 | 0.661 | 0.740 |
| 天津市&山西省 | 0.510 | 0.443 | 0.435 | 0.416 | 0.393 |
| 天津市&河北省 | 0.643 | 0.643 | 0.739 | 0.717 | 0.751 |
| 山西省&河北省 | 0.198 | 0.280 | 0.448 | 0.430 | 0.508 |
| 省份 | 2017年 | 2018年 | 2019年 | 2020年 | 2021年 |
|---|---|---|---|---|---|
| 内蒙古自治区&北京市 | 0.977 | 0.973 | 0.970 | 0.970 | 0.968 |
| 内蒙古自治区&天津市 | 0.962 | 0.958 | 0.955 | 0.958 | 0.962 |
| 内蒙古自治区&山西省 | 0.743 | 0.675 | 0.653 | 0.663 | 0.675 |
| 内蒙古自治区&河北省 | 0.795 | 0.779 | 0.834 | 0.833 | 0.866 |
| 北京市&天津市 | 0.251 | 0.219 | 0.193 | 0.178 | 0.094 |
| 北京市&山西省 | 0.856 | 0.869 | 0.863 | 0.862 | 0.846 |
| 北京市&河北省 | 0.817 | 0.802 | 0.708 | 0.717 | 0.631 |
| 天津市&山西省 | 0.771 | 0.802 | 0.804 | 0.808 | 0.816 |
| 天津市&河北省 | 0.712 | 0.707 | 0.596 | 0.618 | 0.571 |
| 山西省&河北省 | 0.129 | 0.219 | 0.399 | 0.380 | 0.460 |
表6 华北地区面积维度组间基尼系数
Table 6 The inter-group GINI coefficient in the area dimension of North China region
| 省份 | 2017年 | 2018年 | 2019年 | 2020年 | 2021年 |
|---|---|---|---|---|---|
| 内蒙古自治区&北京市 | 0.977 | 0.973 | 0.970 | 0.970 | 0.968 |
| 内蒙古自治区&天津市 | 0.962 | 0.958 | 0.955 | 0.958 | 0.962 |
| 内蒙古自治区&山西省 | 0.743 | 0.675 | 0.653 | 0.663 | 0.675 |
| 内蒙古自治区&河北省 | 0.795 | 0.779 | 0.834 | 0.833 | 0.866 |
| 北京市&天津市 | 0.251 | 0.219 | 0.193 | 0.178 | 0.094 |
| 北京市&山西省 | 0.856 | 0.869 | 0.863 | 0.862 | 0.846 |
| 北京市&河北省 | 0.817 | 0.802 | 0.708 | 0.717 | 0.631 |
| 天津市&山西省 | 0.771 | 0.802 | 0.804 | 0.808 | 0.816 |
| 天津市&河北省 | 0.712 | 0.707 | 0.596 | 0.618 | 0.571 |
| 山西省&河北省 | 0.129 | 0.219 | 0.399 | 0.380 | 0.460 |
| 省份 | 2017年 | 2018年 | 2019年 | 2020年 | 2021年 | 省份 | 2017年 | 2018年 | 2019年 | 2020年 | 2021年 |
|---|---|---|---|---|---|---|---|---|---|---|---|
| 上海市&安徽省 | 0.895 | 0.873 | 0.871 | 0.844 | 0.865 | 山东省&江苏省 | 0.505 | 0.608 | 0.544 | 0.500 | 0.346 |
| 上海市&山东省 | 0.880 | 0.850 | 0.844 | 0.818 | 0.763 | 山东省&江西省 | 0.461 | 0.531 | 0.536 | 0.529 | 0.595 |
| 上海市&江苏省 | 0.674 | 0.502 | 0.554 | 0.537 | 0.566 | 山东省&浙江省 | 0.542 | 0.383 | 0.323 | 0.252 | 0.011 |
| 上海市&江西省 | 0.954 | 0.952 | 0.950 | 0.940 | 0.934 | 山东省&福建省 | 0.213 | 0.249 | 0.284 | 0.312 | 0.413 |
| 上海市&浙江省 | 0.646 | 0.693 | 0.716 | 0.713 | 0.767 | 江苏省&江西省 | 0.784 | 0.861 | 0.836 | 0.814 | 0.780 |
| 上海市&福建省 | 0.920 | 0.907 | 0.910 | 0.900 | 0.894 | 江苏省&浙江省 | 0.051 | 0.294 | 0.268 | 0.284 | 0.356 |
| 安徽省&山东省 | 0.070 | 0.088 | 0.104 | 0.084 | 0.300 | 江苏省&福建省 | 0.648 | 0.744 | 0.717 | 0.702 | 0.665 |
| 安徽省&江苏省 | 0.556 | 0.661 | 0.613 | 0.561 | 0.586 | 江西省&浙江省 | 0.803 | 0.760 | 0.732 | 0.689 | 0.588 |
| 安徽省&江西省 | 0.404 | 0.465 | 0.457 | 0.466 | 0.358 | 江西省&福建省 | 0.276 | 0.325 | 0.297 | 0.261 | 0.240 |
| 安徽省&浙江省 | 0.590 | 0.456 | 0.413 | 0.329 | 0.290 | 浙江省&福建省 | 0.677 | 0.577 | 0.556 | 0.523 | 0.404 |
| 安徽省&福建省 | 0.145 | 0.164 | 0.186 | 0.234 | 0.129 |
表7 华东地区面积维度组间基尼系数
Table 7 The inter-group GINI coefficient in the area dimension of East China region
| 省份 | 2017年 | 2018年 | 2019年 | 2020年 | 2021年 | 省份 | 2017年 | 2018年 | 2019年 | 2020年 | 2021年 |
|---|---|---|---|---|---|---|---|---|---|---|---|
| 上海市&安徽省 | 0.895 | 0.873 | 0.871 | 0.844 | 0.865 | 山东省&江苏省 | 0.505 | 0.608 | 0.544 | 0.500 | 0.346 |
| 上海市&山东省 | 0.880 | 0.850 | 0.844 | 0.818 | 0.763 | 山东省&江西省 | 0.461 | 0.531 | 0.536 | 0.529 | 0.595 |
| 上海市&江苏省 | 0.674 | 0.502 | 0.554 | 0.537 | 0.566 | 山东省&浙江省 | 0.542 | 0.383 | 0.323 | 0.252 | 0.011 |
| 上海市&江西省 | 0.954 | 0.952 | 0.950 | 0.940 | 0.934 | 山东省&福建省 | 0.213 | 0.249 | 0.284 | 0.312 | 0.413 |
| 上海市&浙江省 | 0.646 | 0.693 | 0.716 | 0.713 | 0.767 | 江苏省&江西省 | 0.784 | 0.861 | 0.836 | 0.814 | 0.780 |
| 上海市&福建省 | 0.920 | 0.907 | 0.910 | 0.900 | 0.894 | 江苏省&浙江省 | 0.051 | 0.294 | 0.268 | 0.284 | 0.356 |
| 安徽省&山东省 | 0.070 | 0.088 | 0.104 | 0.084 | 0.300 | 江苏省&福建省 | 0.648 | 0.744 | 0.717 | 0.702 | 0.665 |
| 安徽省&江苏省 | 0.556 | 0.661 | 0.613 | 0.561 | 0.586 | 江西省&浙江省 | 0.803 | 0.760 | 0.732 | 0.689 | 0.588 |
| 安徽省&江西省 | 0.404 | 0.465 | 0.457 | 0.466 | 0.358 | 江西省&福建省 | 0.276 | 0.325 | 0.297 | 0.261 | 0.240 |
| 安徽省&浙江省 | 0.590 | 0.456 | 0.413 | 0.329 | 0.290 | 浙江省&福建省 | 0.677 | 0.577 | 0.556 | 0.523 | 0.404 |
| 安徽省&福建省 | 0.145 | 0.164 | 0.186 | 0.234 | 0.129 |
| 省份 | 全科医生资源集聚度 | 人口集聚度 | H RAD/PAD | ||||||||||||
|---|---|---|---|---|---|---|---|---|---|---|---|---|---|---|---|
| 2017年 | 2018年 | 2019年 | 2020年 | 2021年 | 2017年 | 2018年 | 2019年 | 2020年 | 2021年 | 2017年 | 2018年 | 2019年 | 2020年 | 2021年 | |
| 北京市 | 12.04 | 10.17 | 8.99 | 8.59 | 7.58 | 5.54 | 5.46 | 5.45 | 5.50 | 5.50 | 2.17 | 1.86 | 1.65 | 1.56 | 1.38 |
| 天津市 | 7.21 | 6.51 | 6.08 | 6.00 | 6.27 | 5.45 | 5.43 | 5.42 | 4.78 | 4.73 | 1.32 | 1.20 | 1.12 | 1.26 | 1.33 |
| 河北省 | 1.21 | 1.12 | 1.54 | 1.42 | 1.71 | 1.65 | 1.65 | 1.65 | 1.62 | 1.61 | 0.73 | 0.68 | 0.93 | 0.88 | 1.06 |
| 山西省 | 0.93 | 0.72 | 0.66 | 0.64 | 0.63 | 0.99 | 0.99 | 0.99 | 0.92 | 0.91 | 0.95 | 0.73 | 0.67 | 0.69 | 0.69 |
| 内蒙古自治区 | 0.14 | 0.14 | 0.14 | 0.13 | 0.12 | 0.16 | 0.16 | 0.16 | 0.15 | 0.15 | 0.87 | 0.87 | 0.88 | 0.87 | 0.82 |
| 辽宁省 | 0.97 | 1.14 | 1.16 | 1.13 | 1.07 | 1.23 | 1.22 | 1.22 | 1.18 | 1.17 | 0.79 | 0.93 | 0.96 | 0.95 | 0.91 |
| 吉林省 | 0.80 | 0.63 | 0.81 | 0.77 | 0.75 | 0.77 | 0.76 | 0.67 | 0.67 | 0.66 | 1.04 | 0.83 | 1.21 | 1.14 | 1.13 |
| 黑龙江省 | 0.26 | 0.27 | 0.27 | 0.25 | 0.24 | 0.41 | 0.40 | 0.40 | 0.34 | 0.33 | 0.65 | 0.68 | 0.67 | 0.75 | 0.72 |
| 上海市 | 30.81 | 25.62 | 24.92 | 22.15 | 22.50 | 15.97 | 15.91 | 15.89 | 16.17 | 16.18 | 1.93 | 1.61 | 1.57 | 1.37 | 1.39 |
| 江苏省 | 5.99 | 8.50 | 7.16 | 6.67 | 6.24 | 3.18 | 3.17 | 3.16 | 3.30 | 3.31 | 1.89 | 2.69 | 2.26 | 2.02 | 1.89 |
| 浙江省 | 6.63 | 4.64 | 4.13 | 3.72 | 2.97 | 2.24 | 2.26 | 2.30 | 2.52 | 2.55 | 2.96 | 2.05 | 1.80 | 1.48 | 1.16 |
| 安徽省 | 1.71 | 1.73 | 1.72 | 1.88 | 1.63 | 1.87 | 1.88 | 1.88 | 1.80 | 1.80 | 0.92 | 0.92 | 0.91 | 1.05 | 0.91 |
| 福建省 | 1.28 | 1.25 | 1.18 | 1.17 | 1.26 | 1.32 | 1.33 | 1.33 | 1.38 | 1.39 | 0.97 | 0.94 | 0.88 | 0.84 | 0.90 |
| 江西省 | 0.73 | 0.63 | 0.64 | 0.68 | 0.77 | 1.16 | 1.16 | 1.16 | 1.12 | 1.11 | 0.63 | 0.55 | 0.55 | 0.61 | 0.69 |
| 山东省 | 1.97 | 2.07 | 2.11 | 2.22 | 3.03 | 2.64 | 2.64 | 2.64 | 2.64 | 2.65 | 0.74 | 0.78 | 0.80 | 0.84 | 1.15 |
| 河南省 | 2.18 | 2.35 | 2.21 | 2.11 | 2.76 | 2.44 | 2.44 | 2.44 | 2.50 | 2.48 | 0.89 | 0.97 | 0.91 | 0.85 | 1.11 |
| 湖北省 | 1.36 | 1.35 | 1.35 | 1.30 | 1.11 | 1.63 | 1.62 | 1.62 | 1.57 | 1.58 | 0.83 | 0.83 | 0.83 | 0.83 | 0.70 |
| 湖南省 | 0.82 | 0.85 | 1.36 | 1.42 | 1.22 | 1.46 | 1.46 | 1.46 | 1.39 | 1.39 | 0.56 | 0.58 | 0.93 | 1.02 | 0.88 |
| 广东省 | 2.91 | 2.89 | 2.83 | 2.94 | 2.90 | 2.60 | 2.63 | 2.66 | 2.89 | 2.91 | 1.12 | 1.10 | 1.06 | 1.02 | 1.00 |
| 广西壮族自治区 | 0.60 | 0.63 | 0.71 | 0.78 | 0.73 | 0.86 | 0.86 | 0.86 | 0.86 | 0.87 | 0.71 | 0.73 | 0.82 | 0.90 | 0.84 |
| 海南省 | 3.47 | 3.40 | 4.15 | 5.52 | 5.08 | 5.17 | 5.18 | 5.23 | 5.54 | 5.60 | 0.67 | 0.66 | 0.79 | 1.00 | 0.91 |
| 重庆市 | 1.08 | 1.45 | 1.57 | 1.51 | 1.45 | 1.56 | 1.57 | 1.57 | 1.60 | 1.61 | 0.69 | 0.93 | 1.00 | 0.94 | 0.90 |
| 四川省 | 1.35 | 1.31 | 1.47 | 1.86 | 1.44 | 1.80 | 1.80 | 1.80 | 1.79 | 1.79 | 0.75 | 0.73 | 0.82 | 1.04 | 0.80 |
| 贵州省 | 1.12 | 1.14 | 1.00 | 1.05 | 1.20 | 1.46 | 1.46 | 1.46 | 1.55 | 1.54 | 0.77 | 0.78 | 0.68 | 0.68 | 0.78 |
| 云南省 | 0.62 | 0.61 | 0.72 | 0.69 | 0.63 | 1.03 | 1.03 | 1.03 | 1.00 | 0.99 | 0.60 | 0.60 | 0.70 | 0.69 | 0.64 |
| 西藏自治区 | 0.01 | 0.01 | 0.01 | 0.01 | 0.01 | 0.02 | 0.02 | 0.02 | 0.02 | 0.02 | 0.40 | 0.46 | 0.70 | 0.69 | 0.41 |
| 陕西省 | 0.40 | 0.46 | 0.41 | 0.56 | 0.86 | 0.78 | 0.78 | 0.78 | 0.79 | 0.79 | 0.51 | 0.58 | 0.52 | 0.71 | 1.09 |
| 甘肃省 | 0.23 | 0.24 | 0.25 | 0.24 | 0.26 | 0.29 | 0.29 | 0.29 | 0.27 | 0.27 | 0.80 | 0.83 | 0.87 | 0.90 | 0.97 |
| 青海省 | 1.58 | 1.38 | 1.34 | 1.29 | 1.26 | 1.40 | 1.40 | 1.41 | 1.36 | 1.36 | 1.13 | 0.99 | 0.96 | 0.95 | 0.92 |
| 宁夏回族自治区 | 0.36 | 0.41 | 0.40 | 0.39 | 0.37 | 0.48 | 0.48 | 0.49 | 0.50 | 0.50 | 0.75 | 0.84 | 0.83 | 0.78 | 0.73 |
| 新疆维吾尔自治区 | 0.45 | 0.42 | 0.38 | 0.36 | 0.29 | 0.45 | 0.45 | 0.46 | 0.47 | 0.47 | 1.00 | 0.93 | 0.83 | 0.78 | 0.63 |
表8 2017—2021各年度省际集聚度分析结果
Table 8 Analysis results of agglomeration degree of each province in 2021
| 省份 | 全科医生资源集聚度 | 人口集聚度 | H RAD/PAD | ||||||||||||
|---|---|---|---|---|---|---|---|---|---|---|---|---|---|---|---|
| 2017年 | 2018年 | 2019年 | 2020年 | 2021年 | 2017年 | 2018年 | 2019年 | 2020年 | 2021年 | 2017年 | 2018年 | 2019年 | 2020年 | 2021年 | |
| 北京市 | 12.04 | 10.17 | 8.99 | 8.59 | 7.58 | 5.54 | 5.46 | 5.45 | 5.50 | 5.50 | 2.17 | 1.86 | 1.65 | 1.56 | 1.38 |
| 天津市 | 7.21 | 6.51 | 6.08 | 6.00 | 6.27 | 5.45 | 5.43 | 5.42 | 4.78 | 4.73 | 1.32 | 1.20 | 1.12 | 1.26 | 1.33 |
| 河北省 | 1.21 | 1.12 | 1.54 | 1.42 | 1.71 | 1.65 | 1.65 | 1.65 | 1.62 | 1.61 | 0.73 | 0.68 | 0.93 | 0.88 | 1.06 |
| 山西省 | 0.93 | 0.72 | 0.66 | 0.64 | 0.63 | 0.99 | 0.99 | 0.99 | 0.92 | 0.91 | 0.95 | 0.73 | 0.67 | 0.69 | 0.69 |
| 内蒙古自治区 | 0.14 | 0.14 | 0.14 | 0.13 | 0.12 | 0.16 | 0.16 | 0.16 | 0.15 | 0.15 | 0.87 | 0.87 | 0.88 | 0.87 | 0.82 |
| 辽宁省 | 0.97 | 1.14 | 1.16 | 1.13 | 1.07 | 1.23 | 1.22 | 1.22 | 1.18 | 1.17 | 0.79 | 0.93 | 0.96 | 0.95 | 0.91 |
| 吉林省 | 0.80 | 0.63 | 0.81 | 0.77 | 0.75 | 0.77 | 0.76 | 0.67 | 0.67 | 0.66 | 1.04 | 0.83 | 1.21 | 1.14 | 1.13 |
| 黑龙江省 | 0.26 | 0.27 | 0.27 | 0.25 | 0.24 | 0.41 | 0.40 | 0.40 | 0.34 | 0.33 | 0.65 | 0.68 | 0.67 | 0.75 | 0.72 |
| 上海市 | 30.81 | 25.62 | 24.92 | 22.15 | 22.50 | 15.97 | 15.91 | 15.89 | 16.17 | 16.18 | 1.93 | 1.61 | 1.57 | 1.37 | 1.39 |
| 江苏省 | 5.99 | 8.50 | 7.16 | 6.67 | 6.24 | 3.18 | 3.17 | 3.16 | 3.30 | 3.31 | 1.89 | 2.69 | 2.26 | 2.02 | 1.89 |
| 浙江省 | 6.63 | 4.64 | 4.13 | 3.72 | 2.97 | 2.24 | 2.26 | 2.30 | 2.52 | 2.55 | 2.96 | 2.05 | 1.80 | 1.48 | 1.16 |
| 安徽省 | 1.71 | 1.73 | 1.72 | 1.88 | 1.63 | 1.87 | 1.88 | 1.88 | 1.80 | 1.80 | 0.92 | 0.92 | 0.91 | 1.05 | 0.91 |
| 福建省 | 1.28 | 1.25 | 1.18 | 1.17 | 1.26 | 1.32 | 1.33 | 1.33 | 1.38 | 1.39 | 0.97 | 0.94 | 0.88 | 0.84 | 0.90 |
| 江西省 | 0.73 | 0.63 | 0.64 | 0.68 | 0.77 | 1.16 | 1.16 | 1.16 | 1.12 | 1.11 | 0.63 | 0.55 | 0.55 | 0.61 | 0.69 |
| 山东省 | 1.97 | 2.07 | 2.11 | 2.22 | 3.03 | 2.64 | 2.64 | 2.64 | 2.64 | 2.65 | 0.74 | 0.78 | 0.80 | 0.84 | 1.15 |
| 河南省 | 2.18 | 2.35 | 2.21 | 2.11 | 2.76 | 2.44 | 2.44 | 2.44 | 2.50 | 2.48 | 0.89 | 0.97 | 0.91 | 0.85 | 1.11 |
| 湖北省 | 1.36 | 1.35 | 1.35 | 1.30 | 1.11 | 1.63 | 1.62 | 1.62 | 1.57 | 1.58 | 0.83 | 0.83 | 0.83 | 0.83 | 0.70 |
| 湖南省 | 0.82 | 0.85 | 1.36 | 1.42 | 1.22 | 1.46 | 1.46 | 1.46 | 1.39 | 1.39 | 0.56 | 0.58 | 0.93 | 1.02 | 0.88 |
| 广东省 | 2.91 | 2.89 | 2.83 | 2.94 | 2.90 | 2.60 | 2.63 | 2.66 | 2.89 | 2.91 | 1.12 | 1.10 | 1.06 | 1.02 | 1.00 |
| 广西壮族自治区 | 0.60 | 0.63 | 0.71 | 0.78 | 0.73 | 0.86 | 0.86 | 0.86 | 0.86 | 0.87 | 0.71 | 0.73 | 0.82 | 0.90 | 0.84 |
| 海南省 | 3.47 | 3.40 | 4.15 | 5.52 | 5.08 | 5.17 | 5.18 | 5.23 | 5.54 | 5.60 | 0.67 | 0.66 | 0.79 | 1.00 | 0.91 |
| 重庆市 | 1.08 | 1.45 | 1.57 | 1.51 | 1.45 | 1.56 | 1.57 | 1.57 | 1.60 | 1.61 | 0.69 | 0.93 | 1.00 | 0.94 | 0.90 |
| 四川省 | 1.35 | 1.31 | 1.47 | 1.86 | 1.44 | 1.80 | 1.80 | 1.80 | 1.79 | 1.79 | 0.75 | 0.73 | 0.82 | 1.04 | 0.80 |
| 贵州省 | 1.12 | 1.14 | 1.00 | 1.05 | 1.20 | 1.46 | 1.46 | 1.46 | 1.55 | 1.54 | 0.77 | 0.78 | 0.68 | 0.68 | 0.78 |
| 云南省 | 0.62 | 0.61 | 0.72 | 0.69 | 0.63 | 1.03 | 1.03 | 1.03 | 1.00 | 0.99 | 0.60 | 0.60 | 0.70 | 0.69 | 0.64 |
| 西藏自治区 | 0.01 | 0.01 | 0.01 | 0.01 | 0.01 | 0.02 | 0.02 | 0.02 | 0.02 | 0.02 | 0.40 | 0.46 | 0.70 | 0.69 | 0.41 |
| 陕西省 | 0.40 | 0.46 | 0.41 | 0.56 | 0.86 | 0.78 | 0.78 | 0.78 | 0.79 | 0.79 | 0.51 | 0.58 | 0.52 | 0.71 | 1.09 |
| 甘肃省 | 0.23 | 0.24 | 0.25 | 0.24 | 0.26 | 0.29 | 0.29 | 0.29 | 0.27 | 0.27 | 0.80 | 0.83 | 0.87 | 0.90 | 0.97 |
| 青海省 | 1.58 | 1.38 | 1.34 | 1.29 | 1.26 | 1.40 | 1.40 | 1.41 | 1.36 | 1.36 | 1.13 | 0.99 | 0.96 | 0.95 | 0.92 |
| 宁夏回族自治区 | 0.36 | 0.41 | 0.40 | 0.39 | 0.37 | 0.48 | 0.48 | 0.49 | 0.50 | 0.50 | 0.75 | 0.84 | 0.83 | 0.78 | 0.73 |
| 新疆维吾尔自治区 | 0.45 | 0.42 | 0.38 | 0.36 | 0.29 | 0.45 | 0.45 | 0.46 | 0.47 | 0.47 | 1.00 | 0.93 | 0.83 | 0.78 | 0.63 |
| [1] |
国务院办公厅. 关于改革完善全科医生培养与使用激励机制的意见[EB/OL]. (2018-01-24)[2023-07-15].
|
| [2] |
黄丽娟,方力争,朱文华,等. 县域-综合医院合作框架下区域全科医生分层递进式培训成效与展望[J]. 中国全科医学,2023,26(19):2417-2422. DOI:10.12114/j.issn.1007-9572.2023.0076.
|
| [3] |
黄文娟,
|
| [4] |
郝立晓,王婷,陈丽芬,等. 全科医学学科知识和技能体系研究[J]. 中国全科医学,2018,21(19):2269-2276. DOI:10.12114/j.issn.1007-9572.2018.19.001.
|
| [5] |
李红艳,皇甫慧慧. 基于知识图谱的全科医生研究可视化分析与展望[J]. 中国全科医学,2019,22(27):3387-3394. DOI:10.12114/j.issn.1007-9572.2019.00.348.
|
| [6] |
袁文辉,苏婉敏,王培席. 广东省全科医生配置公平性分析[J]. 卫生经济研究,2023,40(2):85-88,93. DOI:10.14055/j.cnki.33-1056/f.2023.02.010.
|
| [7] |
徐景菊,黄静雯,李伟,等. 山东省全科医生资源配置公平性研究[J]. 现代预防医学,2021,48(8):1408-1412.
|
| [8] |
李婉,韩彩欣. 我国西部地区全科医生配置公平性研究——基于基尼系数和集聚度[J]. 卫生经济研究,2020,37(9):29-32. DOI:10.14055/j.cnki.33-1056/f.2020.09.008.
|
| [9] |
付英杰,王健,孟彦,等. 中国全科医生发展趋势及公平性研究[J]. 中国全科医学,2020,23(1):7-13. DOI:10.12114/j.issn.1007-9572.2019.00.787.
|
| [10] |
张华宇,苗豫东,屈晓远,等. 基于洛伦兹曲线和基尼系数的中国全科医生资源配置公平性研究[J]. 中国全科医学,2020,23(4):409-413.
|
| [11] |
沈华福,王海港. 收入不平等的比较研究——基于洛伦兹占优方法[J]. 经济与管理评论,2019,35(3):24-36.
|
| [12] |
徐景菊,黄静雯,李伟,等. 山东省全科医生资源配置公平性研究[J]. 现代预防医学,2021,48(8):1408-1412.
|
| [13] |
韦森. 入世的政治—经济学家阿尔伯特·赫希曼的思想之旅[J]. 复旦学报(社会科学版),2015,57(6):117-129. DOI:10.3969/j.issn.0257-0289.2015.06.013.
|
| [14] |
|
| [15] |
严静,覃娴静,韩记娣,等. 2015—2020年广西全科医生资源配置状况及公平性研究[J]. 中国卫生经济,2023,42(1):52-56.
|
| [16] |
夏云峰,张红培,段秀娥,等. 近十年我国基层医疗卫生资源配置公平性研究[J]. 卫生经济研究,2023,40(6):1-6. DOI:10.14055/j.cnki.33-1056/f.2023.06.005.
|
| [17] |
国家发展和改革委员会. 关于开展农村订单定向医学生免费培养工作的实施意见[EB/OL].(2010-06-04)[2023-07-15].
|
| [18] | |
| [19] |
蒲海峰,王寅生,余昌胤,等. 贵州省农村订单定向全科医生继续医学教育现状、问题及对策分析[J]. 中国全科医学,2023,26(28):3551-3558. DOI:10.12114/j.issn.1007-9572.2023.0090.
|
| [20] |
付英杰,王健,孟彦,等. 中国全科医生发展趋势及公平性研究[J]. 中国全科医学,2020,23(1):7-13. DOI:10.12114/j.issn.1007-9572.2019.00.787.
|
| [21] |
皇甫慧慧,李红艳. 我国全科医生资源配置公平性研究——基于泰尔指数和灰色预测方法[J]. 卫生经济研究,2018(11):57-61. DOI:10.14055/j.cnki.33-1056/f.2018.11.016.
|
| [22] |
| [1] | 李震宇, 竺琼, 陈榕, 陆静, 虞智杰, 沈福来, 沈怡, 冯雨, 刘梅. 基于单组社区干预试验的医防"微"融合强化服务包提升签约居民服务能效研究[J]. 中国全科医学, 2026, 29(21): 3020-3027. |
| [2] | 刘洪亚, 郭爱珍, 金花, 付强强, 石建军, 张含之, 杨森, 于德华. 我国全科医生细分领域拓展职责的必要性和培养策略:基于德尔菲法的全科医生亚专长持续发展研究[J]. 中国全科医学, 2026, 29(20): 2781-2789. |
| [3] | 颜文, 张含之, 金花, 钱洁, 于德华. 上海市社区卫生服务机构抑郁障碍诊疗能力研究[J]. 中国全科医学, 2026, 29(20): 2790-2799. |
| [4] | 庞姝, 孙颖, 姜春燕. Fried衰弱表型量表与FRAIL量表在社区体检老年人衰弱前期评估中的效能比较[J]. 中国全科医学, 2026, 29(19): 2664-2670. |
| [5] | 赵欣欣, 孙小婷, 罗欣昊, 孙金, 彭德荣, 郑加麟. 以患者为中心的医疗之家模式中国本土化研究:适配度、挑战与路径分析[J]. 中国全科医学, 2026, 29(19): 2608-2613. |
| [6] | 安贤, 黄鹏, 任菁菁. 全科医生对未分化疾病多学科诊疗的认知与开展现状调查研究[J]. 中国全科医学, 2026, 29(18): 2472-2481. |
| [7] | 刘芳, 刘伟楠, 项渊月, 陆琤, 朱滨海. 江苏省"3+2"订单定向助理全科医生工作惬意感影响因素研究[J]. 中国全科医学, 2026, 29(18): 2454-2460. |
| [8] | 黄蛟灵, 康力, 葛敏, 潘志刚, 梁鸿. 中国家庭医生签约服务发展的十五年及未来展望[J]. 中国全科医学, 2026, 29(17): 2296-2302. |
| [9] | 相彤, 于海燕, 李明月, 高文娟, 朱夏媛, 吴浩. 基层医护人员糖尿病前期管理行为的影响因素分析:一项质性研究[J]. 中国全科医学, 2026, 29(16): 2259-2263. |
| [10] | 姚丁烨, 罗桂平, 孙俊生, 李慧. 初级保健视角下双相Ⅱ型情感障碍与抑郁障碍的鉴别诊断研究进展[J]. 中国全科医学, 2026, 29(15): 2092-2099. |
| [11] | 付铭源, 刘新颖, 于潇漪, 孔慜, 葛彩英. 北京市社区医生参与科普现状及培训需求的调查研究[J]. 中国全科医学, 2026, 29(13): 1739-1744. |
| [12] | 焦姝婷, 赵亚利. 社区老年慢性瘙痒服务现状的质性研究[J]. 中国全科医学, 2026, 29(13): 1682-1687. |
| [13] | 刘娟娟, 石国庆, 任菁菁. 教学反馈和反思性学习在全科专业住院医师规范化培训中的应用探讨[J]. 中国全科医学, 2026, 29(13): 1732-1738. |
| [14] | 张涵予, 顾洁, 林嬴男, 黄延焱. 基于人工智能技术构建模拟情景标准化病人在全科专业住院医师规范化培训教学中的应用研究[J]. 中国全科医学, 2026, 29(13): 1726-1731. |
| [15] | 杨蓉, 金花, 史玲, 易春涛, 侯进, 陈晨, 宦红梅, 倪衡如, 于德华. 糖尿病基层规范性管理质量调查研究[J]. 中国全科医学, 2026, 29(12): 1541-1547. |
| 阅读次数 | ||||||
|
全文 |
|
|||||
|
摘要 |
|
|||||


