
Chinese General Practice ›› 2026, Vol. 29 ›› Issue (07): 844-850.DOI: 10.12114/j.issn.1007-9572.2025.0328
• Chinese General Practice/Community Health Service • Previous Articles Next Articles
Received:2025-10-27
Revised:2025-12-21
Published:2026-03-05
Online:2026-02-13
Contact:
WANG Fang
通讯作者:
王芳
作者简介:作者贡献:
李丽清提出主要研究目标;刘文慧负责研究的构思、设计与实施,撰写论文,进行数据的收集与整理、统计学处理、图表的绘制与展示;刘文慧、杨嘉怡、王芳进行论文的修订;李丽清负责文章的质量控制与审查,对文章整体负责,监督管理。
基金资助:
Add to citation manager EndNote|Ris|BibTeX
URL: https://www.chinagp.net/EN/10.12114/j.issn.1007-9572.2025.0328
| 系统层 | 准则层 | 指标层 | 方向 |
|---|---|---|---|
| A:优质医疗资源 | A1:设施资源 | A11:三级医院密度指数 | + |
| B:经济 | B1:稳健发展 | B11:人均GDP | + |
| B2:结构优化 | B21:第二产业产值占比 | + | |
| B22:第三产业产值占比 | + | ||
| B3:协调创新 | B31:专利授权数 | + | |
| B32:D&R发展经费支出 | + | ||
| B4:开放共享 | B41:进出口贸易总额 | + | |
| C:社会 | C1:社会基础 | C11:人口规模 | + |
| C12:老年人口抚养比 | - | ||
| C2:社会保障 | C21:社会保障和就业支出 | + | |
| C22:教育经费支出 | + | ||
| C3:绿色环境 | C31:森林覆盖率 | + | |
| C32:生活垃圾无害化处理率 | + | ||
| C4:民生改善 | C41:人均消费支出 | + |
Table 1 Quality medical resources and economic and social evaluation index system
| 系统层 | 准则层 | 指标层 | 方向 |
|---|---|---|---|
| A:优质医疗资源 | A1:设施资源 | A11:三级医院密度指数 | + |
| B:经济 | B1:稳健发展 | B11:人均GDP | + |
| B2:结构优化 | B21:第二产业产值占比 | + | |
| B22:第三产业产值占比 | + | ||
| B3:协调创新 | B31:专利授权数 | + | |
| B32:D&R发展经费支出 | + | ||
| B4:开放共享 | B41:进出口贸易总额 | + | |
| C:社会 | C1:社会基础 | C11:人口规模 | + |
| C12:老年人口抚养比 | - | ||
| C2:社会保障 | C21:社会保障和就业支出 | + | |
| C22:教育经费支出 | + | ||
| C3:绿色环境 | C31:森林覆盖率 | + | |
| C32:生活垃圾无害化处理率 | + | ||
| C4:民生改善 | C41:人均消费支出 | + |
| 耦合协调阶段 | 耦合协调度 | 协调类型 |
|---|---|---|
| 低水平耦合阶段 | (0.0~0.1) | 极度失调 |
| [0.1~0.2) | 严重失调 | |
| [0.2~0.3) | 中度失调 | |
| 拮抗阶段 | [0.3~0.4) | 轻度失调 |
| [0.4~0.5) | 濒临失调 | |
| 磨合适应阶段 | [0.5~0.6) | 勉强协调 |
| [0.6~0.7) | 初级协调 | |
| [0.7~0.8) | 中级协调 | |
| 高水平耦合阶段 | [0.8~0.9) | 良好协调 |
| [0.9~1.0) | 优质协调 |
Table 2 Coupling level division
| 耦合协调阶段 | 耦合协调度 | 协调类型 |
|---|---|---|
| 低水平耦合阶段 | (0.0~0.1) | 极度失调 |
| [0.1~0.2) | 严重失调 | |
| [0.2~0.3) | 中度失调 | |
| 拮抗阶段 | [0.3~0.4) | 轻度失调 |
| [0.4~0.5) | 濒临失调 | |
| 磨合适应阶段 | [0.5~0.6) | 勉强协调 |
| [0.6~0.7) | 初级协调 | |
| [0.7~0.8) | 中级协调 | |
| 高水平耦合阶段 | [0.8~0.9) | 良好协调 |
| [0.9~1.0) | 优质协调 |
| 地区 | 2013年 | 2014年 | 2015年 | 2016年 | 2017年 | 2018年 | 2019年 | 2020年 | 2021年 | 2022年 | 2023年 |
|---|---|---|---|---|---|---|---|---|---|---|---|
| 山西省 | 0.001 | 0.004 | 0.006 | 0.012 | 0.019 | 0.033 | 0.055 | 0.089 | 0.153 | 0.268 | 0.444 |
| 安徽省 | 0.001 | 0.005 | 0.008 | 0.012 | 0.020 | 0.032 | 0.056 | 0.097 | 0.165 | 0.289 | 0.466 |
| 江西省 | 0.001 | 0.004 | 0.008 | 0.014 | 0.023 | 0.038 | 0.070 | 0.110 | 0.183 | 0.311 | 0.507 |
| 河南省 | 0.006 | 0.010 | 0.014 | 0.019 | 0.010 | 0.050 | 0.077 | 0.141 | 0.235 | 0.344 | 0.512 |
| 湖南省 | 0.001 | 0.007 | 0.010 | 0.015 | 0.024 | 0.040 | 0.069 | 0.114 | 0.184 | 0.303 | 0.467 |
| 湖北省 | 0.001 | 0.001 | 0.005 | 0.008 | 0.014 | 0.025 | 0.044 | 0.074 | 0.140 | 0.277 | 0.476 |
| 全国 | 0.001 | 0.007 | 0.012 | 0.018 | 0.030 | 0.050 | 0.079 | 0.122 | 0.197 | 0.309 | 0.465 |
Table 3 Coordination between quality medical resources and economic and social coupling in six central provinces (2013-2023)
| 地区 | 2013年 | 2014年 | 2015年 | 2016年 | 2017年 | 2018年 | 2019年 | 2020年 | 2021年 | 2022年 | 2023年 |
|---|---|---|---|---|---|---|---|---|---|---|---|
| 山西省 | 0.001 | 0.004 | 0.006 | 0.012 | 0.019 | 0.033 | 0.055 | 0.089 | 0.153 | 0.268 | 0.444 |
| 安徽省 | 0.001 | 0.005 | 0.008 | 0.012 | 0.020 | 0.032 | 0.056 | 0.097 | 0.165 | 0.289 | 0.466 |
| 江西省 | 0.001 | 0.004 | 0.008 | 0.014 | 0.023 | 0.038 | 0.070 | 0.110 | 0.183 | 0.311 | 0.507 |
| 河南省 | 0.006 | 0.010 | 0.014 | 0.019 | 0.010 | 0.050 | 0.077 | 0.141 | 0.235 | 0.344 | 0.512 |
| 湖南省 | 0.001 | 0.007 | 0.010 | 0.015 | 0.024 | 0.040 | 0.069 | 0.114 | 0.184 | 0.303 | 0.467 |
| 湖北省 | 0.001 | 0.001 | 0.005 | 0.008 | 0.014 | 0.025 | 0.044 | 0.074 | 0.140 | 0.277 | 0.476 |
| 全国 | 0.001 | 0.007 | 0.012 | 0.018 | 0.030 | 0.050 | 0.079 | 0.122 | 0.197 | 0.309 | 0.465 |
| 协调类型 | 2013年 | 2018年 | 2020年 | 2022年 | 2023年 |
|---|---|---|---|---|---|
| 极度失调 | 山西省、安徽省、江西省、河南省、湖南省、湖北省(6个) | 山西省、安徽省、江西省、河南省、湖南省、湖北省(6个) | 山西省、安徽省、湖北省(3个) | ||
| 严重失调 | 江西省、河南省、湖南省(3个) | ||||
| 中度失调 | 山西省、安徽省、湖北省(3个) | ||||
| 轻度失调 | 江西省、河南省、湖南省(3个) | ||||
| 濒临失调 | 山西省、安徽省、湖南省、湖北省(4个) | ||||
| 勉强协调 | 江西省、河南省(2个) |
Table 4 Spatial evolution of the level of coordination between high-quality medical resources and economic and social coupling in six central provinces (2013-2023)
| 协调类型 | 2013年 | 2018年 | 2020年 | 2022年 | 2023年 |
|---|---|---|---|---|---|
| 极度失调 | 山西省、安徽省、江西省、河南省、湖南省、湖北省(6个) | 山西省、安徽省、江西省、河南省、湖南省、湖北省(6个) | 山西省、安徽省、湖北省(3个) | ||
| 严重失调 | 江西省、河南省、湖南省(3个) | ||||
| 中度失调 | 山西省、安徽省、湖北省(3个) | ||||
| 轻度失调 | 江西省、河南省、湖南省(3个) | ||||
| 濒临失调 | 山西省、安徽省、湖南省、湖北省(4个) | ||||
| 勉强协调 | 江西省、河南省(2个) |
| 年份(年) | Moran's I | Z值 | P值 |
|---|---|---|---|
| 2013 | -0.225 | -0.598 | 0.550 |
| 2014 | 1.090 | 0.933 | 0.351 |
| 2015 | -0.294 | -1.104 | 0.270 |
| 2016 | 1.106 | 1.099 | 0.272 |
| 2017 | -0.176 | 0.246 | 0.805 |
| 2018 | 1.093 | 0.973 | 0.331 |
| 2019 | 1.137 | 1.449 | 0.149 |
| 2020 | 1.115 | 1.196 | 0.232 |
| 2021 | -0.300 | -1.210 | 0.226 |
| 2022 | -0.342 | -1.584 | 0.113 |
| 2023 | -0.332 | -1.310 | 0.190 |
Table 5 The global Moran index of the level of coordination between high-quality medical resources and economic and social coupling in six central provinces(2013-2023)
| 年份(年) | Moran's I | Z值 | P值 |
|---|---|---|---|
| 2013 | -0.225 | -0.598 | 0.550 |
| 2014 | 1.090 | 0.933 | 0.351 |
| 2015 | -0.294 | -1.104 | 0.270 |
| 2016 | 1.106 | 1.099 | 0.272 |
| 2017 | -0.176 | 0.246 | 0.805 |
| 2018 | 1.093 | 0.973 | 0.331 |
| 2019 | 1.137 | 1.449 | 0.149 |
| 2020 | 1.115 | 1.196 | 0.232 |
| 2021 | -0.300 | -1.210 | 0.226 |
| 2022 | -0.342 | -1.584 | 0.113 |
| 2023 | -0.332 | -1.310 | 0.190 |
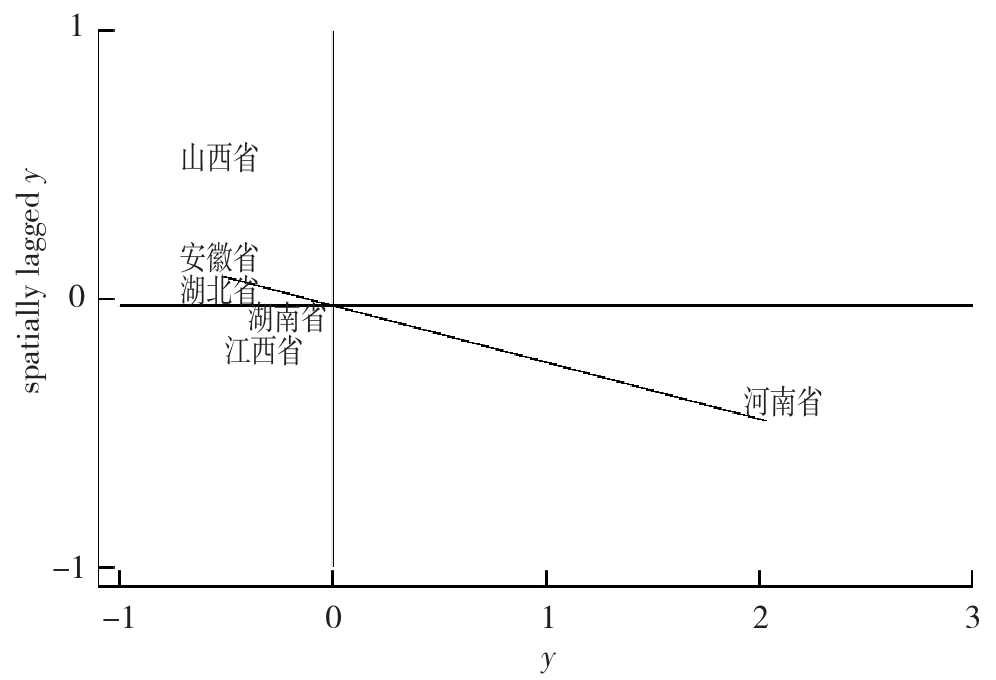
Figure 1 Spatial concentration of high-quality medical resources and economic and social coupling and coordination levels in six central provinces, 2013
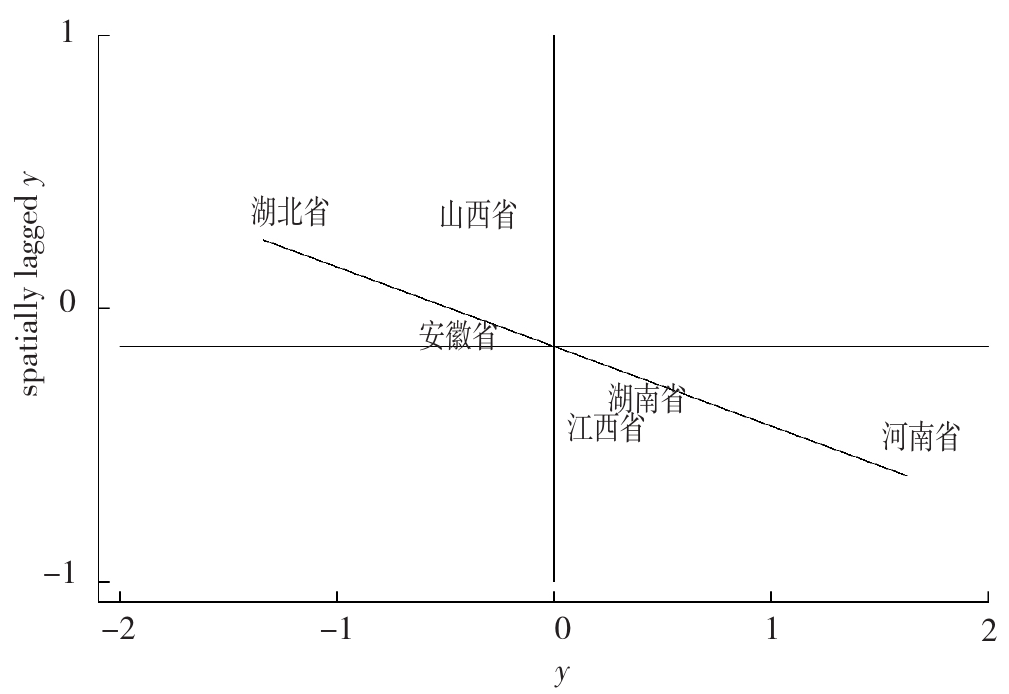
Figure 2 Spatial concentration of high-quality medical resources and economic and social coupling and coordination levels in six central provinces, 2018
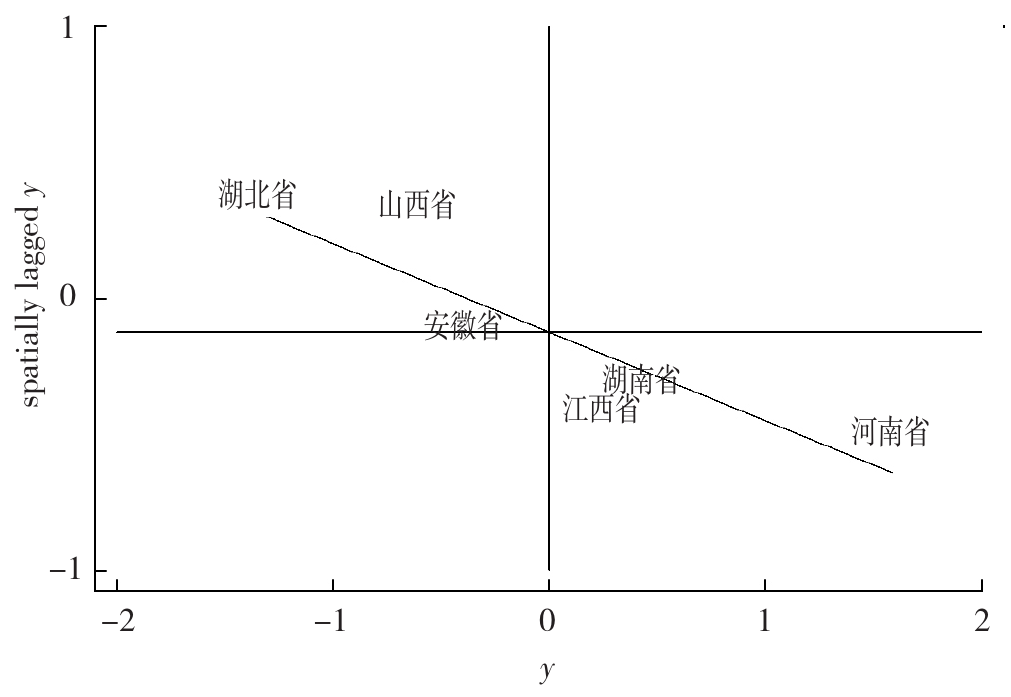
Figure 3 Spatial concentration of high-quality medical resources and economic and social coupling and coordination levels in six central provinces, 2020
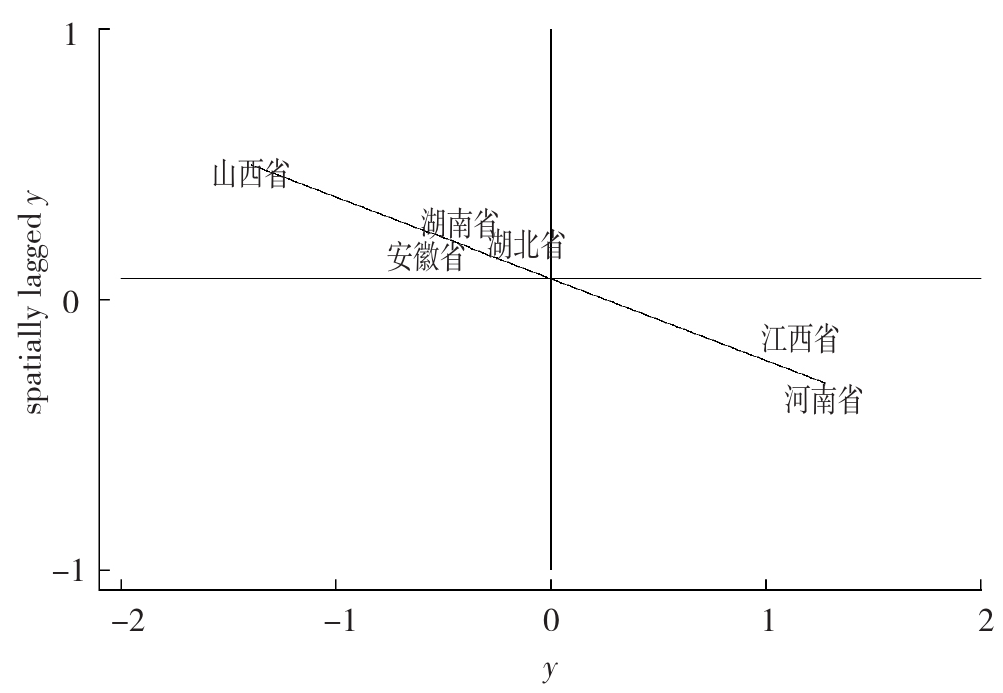
Figure 4 Spatial concentration of high-quality medical resources and economic and social coupling and coordination levels in six central provinces, 2023
| 省份 | 方差比C | P值 | 模型精度 | 耦合协调度预测值 | ||||
|---|---|---|---|---|---|---|---|---|
| 2024年 | 2025年 | 2026年 | 2027年 | 2028年 | ||||
| 山西省 | 0.269 | 1.00 | 优 | 0.548 | 0.923 | 1.000 | 1.000 | 1.000 |
| 安徽省 | 0.443 | 1.00 | 良 | 0.446 | 0.759 | 1.000 | 1.000 | 1.000 |
| 江西省 | 0.015 | 1.00 | 优 | 0.836 | 1.000 | 1.000 | 1.000 | 1.000 |
| 河南省 | 0.242 | 1.00 | 优 | 0.649 | 0.986 | 1.000 | 1.000 | 1.000 |
| 湖南省 | 0.098 | 1.00 | 优 | 0.700 | 0.964 | 1.000 | 1.000 | 1.000 |
| 湖北省 | 0.034 | 1.00 | 优 | 0.823 | 0.974 | 1.000 | 1.000 | 1.000 |
Table 6 Forecast results of the degree of coordination between healthcare resource allocation and economic and social coupling, 2022-2025
| 省份 | 方差比C | P值 | 模型精度 | 耦合协调度预测值 | ||||
|---|---|---|---|---|---|---|---|---|
| 2024年 | 2025年 | 2026年 | 2027年 | 2028年 | ||||
| 山西省 | 0.269 | 1.00 | 优 | 0.548 | 0.923 | 1.000 | 1.000 | 1.000 |
| 安徽省 | 0.443 | 1.00 | 良 | 0.446 | 0.759 | 1.000 | 1.000 | 1.000 |
| 江西省 | 0.015 | 1.00 | 优 | 0.836 | 1.000 | 1.000 | 1.000 | 1.000 |
| 河南省 | 0.242 | 1.00 | 优 | 0.649 | 0.986 | 1.000 | 1.000 | 1.000 |
| 湖南省 | 0.098 | 1.00 | 优 | 0.700 | 0.964 | 1.000 | 1.000 | 1.000 |
| 湖北省 | 0.034 | 1.00 | 优 | 0.823 | 0.974 | 1.000 | 1.000 | 1.000 |
| [1] |
李琦,李璐,周书铎,等. 数字技术赋能优质医疗资源扩容和区域均衡布局的作用机制研究[J]. 卫生经济研究, 2024, 41(11): 86-88, 92. DOI: 10.14055/j.cnki.33-1056/f.2024.11.019.
|
| [2] |
陈保启,靳福磊,赵一鸣. 我国医疗服务质量的地区差异及收敛性分析[J]. 统计与决策, 2023, 39(22): 78-82. DOI: 10.13546/j.cnki.tjyjc.2023.22.014.
|
| [3] |
王栋,刘小瑜. 我国中部地区经济发展质量测度及时空特征分析[J]. 统计与决策, 2023, 39(4): 111-114. DOI: 10.13546/j.cnki.tjyjc.2023.04.020.
|
| [4] | |
| [5] |
雷鹏,冯志昕,丁荆妮,等. 中国医疗资源配置与服务利用现状评价[J]. 卫生经济研究, 2019, 36(5): 50-55. DOI: 10.14055/j.cnki.33-1056/f.2019.05.014.
|
| [6] |
赵雪雁,王晓琪,刘江华,等. 基于不同尺度的中国优质医疗资源区域差异研究[J]. 经济地理, 2020, 40(7): 22-31. DOI: 10.15957/j.cnki.jjdl.2020.07.003.
|
| [7] |
李治国,李兆哲,高玮浓. 黄河流域城市群能源-经济-环境-科技耦合协调水平评价[J]. 统计与决策, 2023, 39(18): 88-91. DOI: 10.13546/j.cnki.tjyjc.2023.18.016.
|
| [8] |
韩之彬,穆怀中. 社会保障支出与居民劳动收入的耦合协调度与空间分布特征[J]. 统计与决策, 2022, 38(11): 74-77. DOI: 10.13546/j.cnki.tjyjc.2022.11.015.
|
| [9] |
陈弢. 区域旅游发展协调度的时空差异研究[J]. 地理研究, 2014, 33(3): 558-568.
|
| [10] |
王家明,丁浩,郑皓. 基于改进耦合协调模型的山东省城镇化协调发展研究[J]. 科技进步与对策, 2018, 35(24): 29-35.
|
| [11] |
张亮,胡宏伟. 中国医疗卫生服务与区域经济耦合协调度时空演变分析[J]. 地理科学进展, 2019, 38(6): 861-872.
|
| [12] |
张振华. 基于灰色GM(1, 1)模型的城市人口老龄化预测[J]. 统计与决策, 2015, 31(19): 76-79. DOI: 10.13546/j.cnki.tjyjc.2015.19.020.
|
| [13] |
李丽清,杨苏乐,陈振生. 医疗资源配置与经济、社会耦合协调发展的时空演化与趋势预测[J]. 中国卫生经济, 2025, 44(1): 40-46.
|
| [14] |
刘杨正,熊占路,陈庆,等. 医联体建设的实践探索与思考:以武汉协和医院西院为例[J]. 中国社会医学杂志, 2023, 40(4): 388-391. DOI: 10.3969/j.issn.1673-5625.2023.04.003.
|
| Viewed | ||||||
|
Full text |
|
|||||
|
Abstract |
|
|||||