
Chinese General Practice ›› 2025, Vol. 28 ›› Issue (18): 2212-2221.DOI: 10.12114/j.issn.1007-9572.2024.0062
Special Issue: 高血压最新文章合辑
• Article • Previous Articles Next Articles
Received:2024-02-20
Revised:2024-09-29
Published:2025-06-20
Online:2025-04-25
Contact:
WANG Zhijun
通讯作者:
王志军
作者简介:作者贡献:
王志军负责研究设计、撰写论文;张士博负责整理数据、协助撰写论文;刘杰、李东琦、郑美佳、周建芝负责资料收集、数据分析、结果解释;王志军负责文章的质量控制及审核校对,对文章整体负责;所有作者均确认了论文的终稿。
基金资助:CLC Number:
Add to citation manager EndNote|Ris|BibTeX
URL: https://www.chinagp.net/EN/10.12114/j.issn.1007-9572.2024.0062
| 组别 | 例数 | 年龄(岁) | 性别(男/女) | BMI[M(QR),kg/m2] | TG[M(QR),mmol/L] | FBG[M(QR),mmol/L] | TC[M(QR),mmol/L] | HDL-C[M(QR),mmol/L] | LDL-C[M(QR),mmol/L] | |
|---|---|---|---|---|---|---|---|---|---|---|
| Q1组 | 99 | 66.1±11.1 | 51/48 | 22.60(2.34) | 0.95(0.52) | 5.53(1.29) | 4.21(1.80) | 1.24(0.56) | 2.50(1.19) | |
| Q2组 | 99 | 63.0±9.0 | 48/51 | 25.22(2.04) | 1.27(0.72) | 5.87(1.87) | 4.53(1.57) | 1.18(0.41) | 2.88(1.41) | |
| Q3组 | 99 | 62.3±9.8 | 54/45 | 27.34(2.45) | 1.53(0.91) | 6.27(2.46) | 4.36(1.88) | 1.13(0.37) | 2.78(1.35) | |
| Q4组 | 99 | 58.3±12.1 | 52/47 | 30.86(3.57) | 2.25(1.72) | 6.43(3.61) | 5.01(1.79) | 1.11(0.34) | 3.18(1.31) | |
| 检验统计量值 | 9.013a | 0.759 | 278.076b | 142.108b | 28.777b | 18.510b | 11.352b | 22.128b | ||
| P值 | <0.001 | 0.859 | <0.001 | <0.001 | <0.001 | <0.001 | 0.010 | <0.001 | ||
| 组别 | 吸烟[例(%)] | 饮酒[例(%)] | 打鼾[例(%)] | 失眠[例(%)] | 焦虑状态[例(%)] | 受教育程度[例(%)] | 规律服用降压药[例(%)] | |||
| 初中以下 | 初中及以上 | |||||||||
| Q1组 | 27(27.3) | 30(30.3) | 32(32.3) | 27(27.3) | 32(32.3) | 14(14.1) | 85(85.9) | 66(66.7) | ||
| Q2组 | 35(35.4) | 35(35.4) | 41(41.4) | 28(28.3) | 37(37.4) | 17(17.2) | 82(82.8) | 78(78.8) | ||
| Q3组 | 40(40.4) | 36(36.4) | 50(50.5) | 34(34.3) | 39(39.4) | 16(16.2) | 83(83.8) | 80(80.8) | ||
| Q4组 | 38(38.4) | 41(41.4) | 39(39.4) | 25(25.2) | 37(37.4) | 14(14.1) | 85(85.9) | 72(72.7) | ||
| 检验统计量值 | 4.331 | 2.679 | 6.859 | 2.217 | 1.164 | 0.523 | 6.422 | |||
| P值 | 0.228 | 0.444 | 0.075 | 0.529 | 0.762 | 0.914 | 0.093 | |||
| 组别 | 服用降压药种类[例(%)] | 降脂药[例(%)] | 慢性心力衰竭[例(%)] | 冠心病[例(%)] | 脑卒中[例(%)] | 糖尿病[例(%)] | 高脂血症[例(%)] | |||
| RAAS抑制剂 | β受体阻滞剂 | CCB | 利尿剂 | |||||||
| Q1组 | 24(24.2) | 48(48.5) | 52(52.5) | 3(3.0) | 45(45.5) | 4(4.0) | 46(46.5) | 52(52.5) | 22(22.2) | 30(30.3) |
| Q2组 | 44(44.4) | 53(53.5) | 55(55.6) | 11(11.1) | 50(50.5) | 2(2.0) | 47(47.5) | 49(49.5) | 24(24.2) | 27(27.3) |
| Q3组 | 33(33.3) | 58(58.6) | 58(58.6) | 9(9.1) | 57(57.6) | 2(2.0) | 46(46.5) | 67(67.7) | 36(36.4) | 50(50.5) |
| Q4组 | 43(43.4) | 52(52.5) | 51(51.5) | 9(9.1) | 65(65.7) | 5(5.0) | 52(52.5) | 49(49.5) | 48(48.5) | 67(67.7) |
| 检验统计量值 | 11.611 | 2.059 | 1.222 | 4.896 | 9.247 | 2.147 | 1.001 | 9.084 | 19.926 | 43.016 |
| P值 | 0.009 | 0.560 | 0.748 | 0.180 | 0.026 | 0.542 | 0.801 | 0.028 | <0.001 | <0.001 |
Table 1 Comparison of baseline data of subjects in group Q1-Q4
| 组别 | 例数 | 年龄(岁) | 性别(男/女) | BMI[M(QR),kg/m2] | TG[M(QR),mmol/L] | FBG[M(QR),mmol/L] | TC[M(QR),mmol/L] | HDL-C[M(QR),mmol/L] | LDL-C[M(QR),mmol/L] | |
|---|---|---|---|---|---|---|---|---|---|---|
| Q1组 | 99 | 66.1±11.1 | 51/48 | 22.60(2.34) | 0.95(0.52) | 5.53(1.29) | 4.21(1.80) | 1.24(0.56) | 2.50(1.19) | |
| Q2组 | 99 | 63.0±9.0 | 48/51 | 25.22(2.04) | 1.27(0.72) | 5.87(1.87) | 4.53(1.57) | 1.18(0.41) | 2.88(1.41) | |
| Q3组 | 99 | 62.3±9.8 | 54/45 | 27.34(2.45) | 1.53(0.91) | 6.27(2.46) | 4.36(1.88) | 1.13(0.37) | 2.78(1.35) | |
| Q4组 | 99 | 58.3±12.1 | 52/47 | 30.86(3.57) | 2.25(1.72) | 6.43(3.61) | 5.01(1.79) | 1.11(0.34) | 3.18(1.31) | |
| 检验统计量值 | 9.013a | 0.759 | 278.076b | 142.108b | 28.777b | 18.510b | 11.352b | 22.128b | ||
| P值 | <0.001 | 0.859 | <0.001 | <0.001 | <0.001 | <0.001 | 0.010 | <0.001 | ||
| 组别 | 吸烟[例(%)] | 饮酒[例(%)] | 打鼾[例(%)] | 失眠[例(%)] | 焦虑状态[例(%)] | 受教育程度[例(%)] | 规律服用降压药[例(%)] | |||
| 初中以下 | 初中及以上 | |||||||||
| Q1组 | 27(27.3) | 30(30.3) | 32(32.3) | 27(27.3) | 32(32.3) | 14(14.1) | 85(85.9) | 66(66.7) | ||
| Q2组 | 35(35.4) | 35(35.4) | 41(41.4) | 28(28.3) | 37(37.4) | 17(17.2) | 82(82.8) | 78(78.8) | ||
| Q3组 | 40(40.4) | 36(36.4) | 50(50.5) | 34(34.3) | 39(39.4) | 16(16.2) | 83(83.8) | 80(80.8) | ||
| Q4组 | 38(38.4) | 41(41.4) | 39(39.4) | 25(25.2) | 37(37.4) | 14(14.1) | 85(85.9) | 72(72.7) | ||
| 检验统计量值 | 4.331 | 2.679 | 6.859 | 2.217 | 1.164 | 0.523 | 6.422 | |||
| P值 | 0.228 | 0.444 | 0.075 | 0.529 | 0.762 | 0.914 | 0.093 | |||
| 组别 | 服用降压药种类[例(%)] | 降脂药[例(%)] | 慢性心力衰竭[例(%)] | 冠心病[例(%)] | 脑卒中[例(%)] | 糖尿病[例(%)] | 高脂血症[例(%)] | |||
| RAAS抑制剂 | β受体阻滞剂 | CCB | 利尿剂 | |||||||
| Q1组 | 24(24.2) | 48(48.5) | 52(52.5) | 3(3.0) | 45(45.5) | 4(4.0) | 46(46.5) | 52(52.5) | 22(22.2) | 30(30.3) |
| Q2组 | 44(44.4) | 53(53.5) | 55(55.6) | 11(11.1) | 50(50.5) | 2(2.0) | 47(47.5) | 49(49.5) | 24(24.2) | 27(27.3) |
| Q3组 | 33(33.3) | 58(58.6) | 58(58.6) | 9(9.1) | 57(57.6) | 2(2.0) | 46(46.5) | 67(67.7) | 36(36.4) | 50(50.5) |
| Q4组 | 43(43.4) | 52(52.5) | 51(51.5) | 9(9.1) | 65(65.7) | 5(5.0) | 52(52.5) | 49(49.5) | 48(48.5) | 67(67.7) |
| 检验统计量值 | 11.611 | 2.059 | 1.222 | 4.896 | 9.247 | 2.147 | 1.001 | 9.084 | 19.926 | 43.016 |
| P值 | 0.009 | 0.560 | 0.748 | 0.180 | 0.026 | 0.542 | 0.801 | 0.028 | <0.001 | <0.001 |
| 组别 | 例数 | 全天平均收缩压(mmHg) | 全天平均舒张压(mmHg) | 日间平均收缩压(mmHg) | 日间平均舒张压(mmHg) | 夜间平均收缩压(mmHg) | 夜间平均舒张压(mmHg) | 夜间收缩压下降率(%) |
|---|---|---|---|---|---|---|---|---|
| Q1组 | 99 | 129(19) | 72(13) | 129(20) | 72(14) | 119(20) | 67(14) | 4.03(11.88) |
| Q2组 | 99 | 130(20) | 77(15) | 132(21) | 79(15) | 121(21) | 69(13) | 5.26(8.49) |
| Q3组 | 99 | 133(25) | 77(14) | 137(24) | 78(15) | 125(27) | 70(14) | 5.56(7.82) |
| Q4组 | 99 | 134(18) | 80(17) | 136(18) | 80(18) | 131(21) | 75(18) | 2.78(9.70) |
| H值 | 9.284 | 19.866 | 9.893 | 18.440 | 10.516 | 24.675 | 8.390 | |
| P值 | 0.026 | <0.001 | 0.019 | <0.001 | 0.015 | <0.001 | 0.039 | |
| 组别 | 夜间舒张压下降率(%) | 全天收缩压标准差(mmHg) | 全天舒张压标准差(mmHg) | 日间收缩压标准差(mmHg) | 日间舒张压标准差(mmHg) | 夜间收缩压标准差(mmHg) | 夜间舒张压标准差(mmHg) | |
| Q1组 | 6.45(11.29) | 14.79(6.04) | 10.83(5.37) | 13.85(5.95) | 10.56(5.86) | 10.30(5.46) | 8.36(3.86) | |
| Q2组 | 6.85(13.04) | 15.84(6.31) | 12.27(5.42) | 15.08(6.64) | 12.14(5.67) | 10.80(6.64) | 9.32(5.78) | |
| Q3组 | 7.06(10.81) | 15.41(6.55) | 12.33(5.99) | 15.44(6.59) | 11.54(6.11) | 11.89(6.72) | 9.85(4.03) | |
| Q4组 | 5.88(13.03) | 14.72(6.4) | 12.17(5.11) | 14.63(5.85) | 11.64(5.33) | 12.01(5.04) | 10.28(5.78) | |
| H值 | 2.777 | 4.844 | 7.592 | 4.119 | 6.015 | 13.208 | 16.336 | |
| P值 | 0.427 | 0.184 | 0.055 | 0.249 | 0.111 | 0.004 | 0.001 |
Table 2 24-hour ABPM parameters in different TyG-BMI groups
| 组别 | 例数 | 全天平均收缩压(mmHg) | 全天平均舒张压(mmHg) | 日间平均收缩压(mmHg) | 日间平均舒张压(mmHg) | 夜间平均收缩压(mmHg) | 夜间平均舒张压(mmHg) | 夜间收缩压下降率(%) |
|---|---|---|---|---|---|---|---|---|
| Q1组 | 99 | 129(19) | 72(13) | 129(20) | 72(14) | 119(20) | 67(14) | 4.03(11.88) |
| Q2组 | 99 | 130(20) | 77(15) | 132(21) | 79(15) | 121(21) | 69(13) | 5.26(8.49) |
| Q3组 | 99 | 133(25) | 77(14) | 137(24) | 78(15) | 125(27) | 70(14) | 5.56(7.82) |
| Q4组 | 99 | 134(18) | 80(17) | 136(18) | 80(18) | 131(21) | 75(18) | 2.78(9.70) |
| H值 | 9.284 | 19.866 | 9.893 | 18.440 | 10.516 | 24.675 | 8.390 | |
| P值 | 0.026 | <0.001 | 0.019 | <0.001 | 0.015 | <0.001 | 0.039 | |
| 组别 | 夜间舒张压下降率(%) | 全天收缩压标准差(mmHg) | 全天舒张压标准差(mmHg) | 日间收缩压标准差(mmHg) | 日间舒张压标准差(mmHg) | 夜间收缩压标准差(mmHg) | 夜间舒张压标准差(mmHg) | |
| Q1组 | 6.45(11.29) | 14.79(6.04) | 10.83(5.37) | 13.85(5.95) | 10.56(5.86) | 10.30(5.46) | 8.36(3.86) | |
| Q2组 | 6.85(13.04) | 15.84(6.31) | 12.27(5.42) | 15.08(6.64) | 12.14(5.67) | 10.80(6.64) | 9.32(5.78) | |
| Q3组 | 7.06(10.81) | 15.41(6.55) | 12.33(5.99) | 15.44(6.59) | 11.54(6.11) | 11.89(6.72) | 9.85(4.03) | |
| Q4组 | 5.88(13.03) | 14.72(6.4) | 12.17(5.11) | 14.63(5.85) | 11.64(5.33) | 12.01(5.04) | 10.28(5.78) | |
| H值 | 2.777 | 4.844 | 7.592 | 4.119 | 6.015 | 13.208 | 16.336 | |
| P值 | 0.427 | 0.184 | 0.055 | 0.249 | 0.111 | 0.004 | 0.001 |
| 参数 | 组别 | 模型1 | 模型2 | 模型3 | |||
|---|---|---|---|---|---|---|---|
| β(95%CI) | P值 | β(95%CI) | P值 | β(95%CI) | P值 | ||
| 夜间平均收缩压 | Q1组 | ||||||
| Q2组 | 2.616(-2.278~7.510) | 0.295 | 3.398(-1.477~8.273) | 0.172 | 0.576(-3.432~4.585) | 0.778 | |
| Q3组 | 4.162(-0.733~9.056) | 0.096 | 5.028(0.145~9.911) | 0.044 | 0.710(-3.368~4.788) | 0.733 | |
| Q4组 | 7.535(2.641~12.430) | 0.003 | 9.403(4.390~14.416) | <0.001 | 6.623(2.497~10.749) | 0.002 | |
| 夜间平均舒张压 | Q1组 | ||||||
| Q2组 | 4.717(1.667~7.767) | 0.002 | 3.914(1.067~6.760) | 0.007 | 3.026(0.359~5.694) | 0.026 | |
| Q3组 | 4.455(1.404~7.505) | 0.004 | 3.202(0.351~6.053) | 0.028 | 1.950(-0.764~4.664) | 0.159 | |
| Q4组 | 7.909(4.859~10.959) | <0.001 | 5.522(2.595~8.449) | <0.001 | 4.553(1.807~7.299) | 0.001 | |
Table 3 Generalized linear model analysis of the influence of TyG-BMI groups on nighttime ABPM parameters
| 参数 | 组别 | 模型1 | 模型2 | 模型3 | |||
|---|---|---|---|---|---|---|---|
| β(95%CI) | P值 | β(95%CI) | P值 | β(95%CI) | P值 | ||
| 夜间平均收缩压 | Q1组 | ||||||
| Q2组 | 2.616(-2.278~7.510) | 0.295 | 3.398(-1.477~8.273) | 0.172 | 0.576(-3.432~4.585) | 0.778 | |
| Q3组 | 4.162(-0.733~9.056) | 0.096 | 5.028(0.145~9.911) | 0.044 | 0.710(-3.368~4.788) | 0.733 | |
| Q4组 | 7.535(2.641~12.430) | 0.003 | 9.403(4.390~14.416) | <0.001 | 6.623(2.497~10.749) | 0.002 | |
| 夜间平均舒张压 | Q1组 | ||||||
| Q2组 | 4.717(1.667~7.767) | 0.002 | 3.914(1.067~6.760) | 0.007 | 3.026(0.359~5.694) | 0.026 | |
| Q3组 | 4.455(1.404~7.505) | 0.004 | 3.202(0.351~6.053) | 0.028 | 1.950(-0.764~4.664) | 0.159 | |
| Q4组 | 7.909(4.859~10.959) | <0.001 | 5.522(2.595~8.449) | <0.001 | 4.553(1.807~7.299) | 0.001 | |
| 参数 | 组别 | 模型1 | 模型2 | 模型3 | |||
|---|---|---|---|---|---|---|---|
| β(95%CI) | P值 | β(95%CI) | P值 | β(95%CI) | P值 | ||
| 夜间平均收缩压 | Q1组 | ||||||
| Q2组 | -2.067(-8.392~4.258) | 0.522 | -0.948(-7.327~5.431) | 0.771 | -3.505(-8.662~1.651) | 0.183 | |
| Q3组 | 3.696(-2.708~10.100) | 0.258 | 4.243(-2.134~10.620) | 0.192 | 0.568(-4.644~5.779) | 0.831 | |
| Q4组 | 6.817(0.440~13.193) | 0.036 | 8.859(2.202~15.517) | 0.009 | 4.604(-0.826~10.035) | 0.097 | |
| 夜间平均舒张压 | Q1组 | ||||||
| Q2组 | 1.239(-2.845~5.324) | 0.552 | -0.431(-4.219~3.356) | 0.823 | -1.351(-4.809~2.106) | 0.444 | |
| Q3组 | 2.645(-1.490~6.781) | 0.210 | 1.856(-1.930~5.643) | 0.337 | 0.571(-2.924~4.066) | 0.749 | |
| Q4组 | 7.017(2.899~11.134) | 0.001 | 3.863(-0.090~7.816) | 0.055 | 1.988(-1.654~5.629) | 0.285 | |
Table 4 Generalized linear model analysis of the impact of TyG-BMI grouping on nocturnal abpm parameters in subjects with hyperlipidemia or diabetes
| 参数 | 组别 | 模型1 | 模型2 | 模型3 | |||
|---|---|---|---|---|---|---|---|
| β(95%CI) | P值 | β(95%CI) | P值 | β(95%CI) | P值 | ||
| 夜间平均收缩压 | Q1组 | ||||||
| Q2组 | -2.067(-8.392~4.258) | 0.522 | -0.948(-7.327~5.431) | 0.771 | -3.505(-8.662~1.651) | 0.183 | |
| Q3组 | 3.696(-2.708~10.100) | 0.258 | 4.243(-2.134~10.620) | 0.192 | 0.568(-4.644~5.779) | 0.831 | |
| Q4组 | 6.817(0.440~13.193) | 0.036 | 8.859(2.202~15.517) | 0.009 | 4.604(-0.826~10.035) | 0.097 | |
| 夜间平均舒张压 | Q1组 | ||||||
| Q2组 | 1.239(-2.845~5.324) | 0.552 | -0.431(-4.219~3.356) | 0.823 | -1.351(-4.809~2.106) | 0.444 | |
| Q3组 | 2.645(-1.490~6.781) | 0.210 | 1.856(-1.930~5.643) | 0.337 | 0.571(-2.924~4.066) | 0.749 | |
| Q4组 | 7.017(2.899~11.134) | 0.001 | 3.863(-0.090~7.816) | 0.055 | 1.988(-1.654~5.629) | 0.285 | |
| 参数 | 组别 | 模型1 | 模型2 | 模型3 | |||
|---|---|---|---|---|---|---|---|
| β(95%CI) | P值 | β(95%CI) | P值 | β(95%CI) | P值 | ||
| 夜间平均收缩压 | Q1组 | ||||||
| Q2组 | 5.308(-2.156~12.771) | 0.163 | 6.149(-1.284~13.581) | 0.105 | 4.692(-1.744~11.128) | 0.153 | |
| Q3组 | 6.692(-0.771~14.156) | 0.079 | 7.296(-0.112~14.704) | 0.054 | 0.440(-5.973~6.853) | 0.893 | |
| Q4组 | 4.965(-2.547~12.477) | 0.195 | 6.856(-0.831~14.543) | 0.080 | 6.183(-0.194~12.559) | 0.057 | |
| 夜间平均舒张压 | Q1组 | ||||||
| Q2组 | 6.077(1.750~10.403) | 0.006 | 5.475(1.305~9.646) | 0.010 | 5.468(1.280~9.656) | 0.011 | |
| Q3组 | 7.333(3.007~11.660) | 0.001 | 6.846(2.690~11.003) | 0.001 | 5.277(1.105~9.450) | 0.013 | |
| Q4组 | 9.825(5.470~14.179) | <0.001 | 8.492(4.178~12.805) | <0.001 | 8.462(4.313~12.611) | <0.001 | |
Table 5 Generalized linear model analysis of the impact of TyG-BMI grouping on nocturnal abpm parameters in subjects without hyperlipidemia or diabetes
| 参数 | 组别 | 模型1 | 模型2 | 模型3 | |||
|---|---|---|---|---|---|---|---|
| β(95%CI) | P值 | β(95%CI) | P值 | β(95%CI) | P值 | ||
| 夜间平均收缩压 | Q1组 | ||||||
| Q2组 | 5.308(-2.156~12.771) | 0.163 | 6.149(-1.284~13.581) | 0.105 | 4.692(-1.744~11.128) | 0.153 | |
| Q3组 | 6.692(-0.771~14.156) | 0.079 | 7.296(-0.112~14.704) | 0.054 | 0.440(-5.973~6.853) | 0.893 | |
| Q4组 | 4.965(-2.547~12.477) | 0.195 | 6.856(-0.831~14.543) | 0.080 | 6.183(-0.194~12.559) | 0.057 | |
| 夜间平均舒张压 | Q1组 | ||||||
| Q2组 | 6.077(1.750~10.403) | 0.006 | 5.475(1.305~9.646) | 0.010 | 5.468(1.280~9.656) | 0.011 | |
| Q3组 | 7.333(3.007~11.660) | 0.001 | 6.846(2.690~11.003) | 0.001 | 5.277(1.105~9.450) | 0.013 | |
| Q4组 | 9.825(5.470~14.179) | <0.001 | 8.492(4.178~12.805) | <0.001 | 8.462(4.313~12.611) | <0.001 | |
| 指标 | 夜间平均收缩压 | 夜间平均舒张压 | ||
|---|---|---|---|---|
| rs值 | P值 | rs值 | P值 | |
| TG/HDL-C | 0.083 | 0.097 | 0.193 | <0.001 |
| TyG指数 | 0.081 | 0.110 | 0.145 | 0.004 |
| TyG-BMI指数 | 0.155 | 0.002 | 0.250 | <0.001 |
Table 6 Correlation analysis results of TyG-BMI,TyG,TG/HDL-C with mean nocturnal systolic blood pressure and mean nocturnal diastolic blood pressure
| 指标 | 夜间平均收缩压 | 夜间平均舒张压 | ||
|---|---|---|---|---|
| rs值 | P值 | rs值 | P值 | |
| TG/HDL-C | 0.083 | 0.097 | 0.193 | <0.001 |
| TyG指数 | 0.081 | 0.110 | 0.145 | 0.004 |
| TyG-BMI指数 | 0.155 | 0.002 | 0.250 | <0.001 |
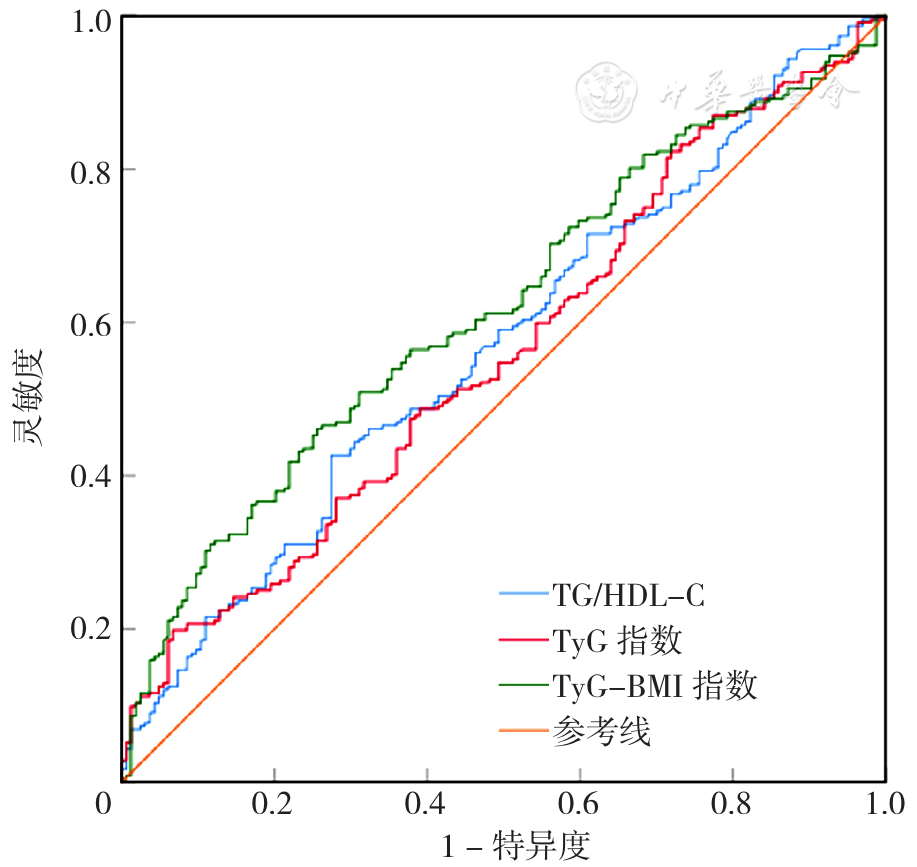
Figure 1 ROC curves for predicting nocturnal hypertension using TG/HDL-C,TyG index and TyG-BMI index
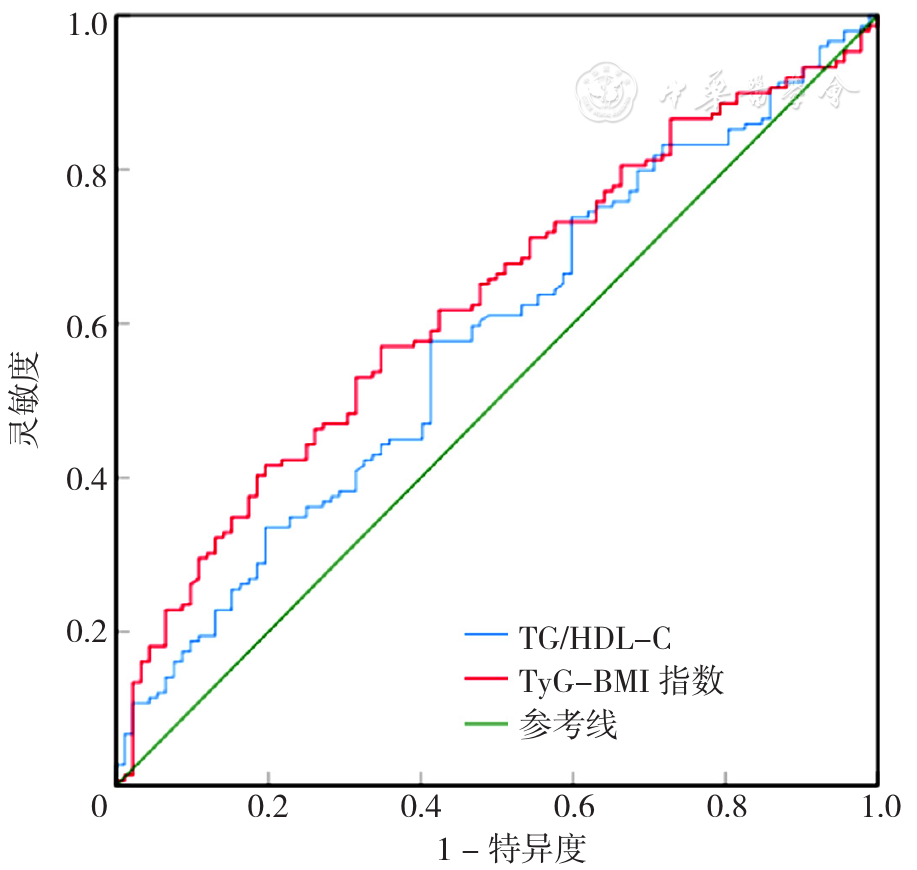
Figure 2 ROC curves for predicting nocturnal hypertension in subjects with hyperlipidemia or diabetes using TG/HDL-C and TyG-BMI index
| 指标 | AUC | 95%CI | 灵敏度 | 特异度 | 最佳截断值 | P值 |
|---|---|---|---|---|---|---|
| 所有研究对象 | ||||||
| TG/HDL-C | 0.570 | 0.513~0.627 | 0.427 | 0.726 | 1.539 | 0.017 |
| TyG指数 | 0.559 | 0.502~0.616 | 0.198 | 0.933 | 8.047 | 0.046 |
| TyG-BMI指数 | 0.618 | 0.563~0.673 | 0.461 | 0.744 | 202.086 | <0.001 |
| 患有高脂血症或糖尿病研究对象 | ||||||
| TG/HDL-C | 0.578 | 0.504~0.651 | 0.577 | 0.587 | 1.539 | 0.043 |
| TyG指数 | 0.569 | 0.497~0.642 | 0.302 | 0.880 | 8.056 | 0.070 |
| TyG-BMI指数 | 0.627 | 0.557~0.698 | 0.570 | 0.652 | 202.086 | 0.001 |
| 未患有高脂血症或糖尿病研究对象 | ||||||
| TG/HDL-C | 0.522 | 0.430~0.614 | 0.904 | 0.208 | 0.522 | 0.641 |
| TyG指数 | 0.521 | 0.428~0.614 | 0.759 | 0.375 | 6.726 | 0.654 |
| TyG-BMI指数 | 0.574 | 0.484~0.664 | 0.313 | 0.847 | 199.673 | 0.111 |
Table 7 The predictive value of TG/HDL-C,TyG,and TyG-BMI for nocturnal hypertension
| 指标 | AUC | 95%CI | 灵敏度 | 特异度 | 最佳截断值 | P值 |
|---|---|---|---|---|---|---|
| 所有研究对象 | ||||||
| TG/HDL-C | 0.570 | 0.513~0.627 | 0.427 | 0.726 | 1.539 | 0.017 |
| TyG指数 | 0.559 | 0.502~0.616 | 0.198 | 0.933 | 8.047 | 0.046 |
| TyG-BMI指数 | 0.618 | 0.563~0.673 | 0.461 | 0.744 | 202.086 | <0.001 |
| 患有高脂血症或糖尿病研究对象 | ||||||
| TG/HDL-C | 0.578 | 0.504~0.651 | 0.577 | 0.587 | 1.539 | 0.043 |
| TyG指数 | 0.569 | 0.497~0.642 | 0.302 | 0.880 | 8.056 | 0.070 |
| TyG-BMI指数 | 0.627 | 0.557~0.698 | 0.570 | 0.652 | 202.086 | 0.001 |
| 未患有高脂血症或糖尿病研究对象 | ||||||
| TG/HDL-C | 0.522 | 0.430~0.614 | 0.904 | 0.208 | 0.522 | 0.641 |
| TyG指数 | 0.521 | 0.428~0.614 | 0.759 | 0.375 | 6.726 | 0.654 |
| TyG-BMI指数 | 0.574 | 0.484~0.664 | 0.313 | 0.847 | 199.673 | 0.111 |
| [1] |
Joint Committee for Guideline Revision. 2018 Chinese guidelines for prevention and treatment of hypertension-a report of the revision committee of Chinese guidelines for prevention and treatment of hypertension[J]. J Geriatr Cardiol,2019,16(3):182-241. DOI:10.11909/j.issn.1671-5411.2019.03.014.
|
| [2] |
|
| [3] |
中国高血压联盟《夜间高血压管理中国专家共识》委员会,刘靖,李燕,等.夜间高血压管理中国专家共识[J].中华高血压杂志,2023,31(7):610-618. DOI:10.16439/j.isn.1673-7245.2023.07.003.
|
| [4] |
|
| [5] |
姚涛,王张锋,张艳,等. 老年诊室高血压人群夜间高血压的检出率和相关因素分析[J]. 中国煤炭工业医学杂志,2023,26(4):400-405. DOI:10.11723/mtgyyx1007-9564202304013.
|
| [6] |
|
| [7] |
|
| [8] |
中国高血压防治指南修订委员会,高血压联盟(中国,中华医学会心血管病学分会中国医师协会高血压专业委员会,等. 中国高血压防治指南(2018年修订版)[J]. 中国心血管杂志,2019,24(1):24-56. DOI:10.3969/j.issn.1007-5410.2019.01.002.
|
| [9] |
|
| [10] |
|
| [11] |
|
| [12] | |
| [13] |
中国成人血脂异常防治指南修订联合委员会. 中国成人血脂异常防治指南(2016年修订版)[J]. 中国循环杂志,2016,31(10):937-950. DOI:10.3969/j.issn.1000-3614.2016.10.001.
|
| [14] |
中华医学会心血管病学分会心力衰竭学组,中国医师协会心力衰竭专业委员会,中华心血管病杂志编辑委员会. 中国心力衰竭诊断和治疗指南2018[J]. 中华心血管病杂志,2018,46(10):760-789. DOI:10.3760/cma.j.issn.0253-3758.2018.10.004.
|
| [15] |
中国医师协会急诊医师分会,国家卫健委能力建设与继续教育中心急诊学专家委员会,中国医疗保健国际交流促进会急诊急救分会. 急性冠脉综合征急诊快速诊治指南(2019)[J]. 临床急诊杂志,2019,20(4):253-262. DOI:10.13201/j.issn.1009-5918.2019.04.001.
|
| [16] |
|
| [17] |
中华医学会神经病学分会,中华医学会神经病学分会脑血管病学组.中国急性缺血性脑卒中诊治指南2014[J].中华神经科杂志,2015,48(4):246-257. DOI:10.3760/cma.j.issn.1006-7876.2015.04.002.
|
| [18] |
中华医学会神经病学分会,中华医学会神经病学分会脑血管病学组.中国脑出血诊治指南(2019)[J]. 中华神经科杂志,2019,52(12):994-1005. DOI:10.3760/cma.j.issn.1006-7876.2019.12.003.
|
| [19] |
|
| [20] |
|
| [21] |
|
| [22] |
|
| [23] |
|
| [24] |
|
| [25] |
|
| [26] |
|
| [27] |
|
| [28] |
|
| [29] |
|
| [30] |
|
| [31] |
|
| [32] |
|
| [33] |
|
| [34] |
|
| [35] |
|
| [36] |
|
| [37] |
|
| [38] |
|
| [39] |
|
| [40] |
|
| [41] |
|
| [42] |
|
| [43] |
|
| [44] |
|
| [1] | ZHOU Xiaoya, WANG Weikai, LIU Qian, LI Jianhua, SUN Bo, WANG Yanxia. Study of the Interaction between Sleep Quality and Melatonin Receptor 1B Gene Polymorphism on Gestational Hypertension [J]. Chinese General Practice, 2026, 29(21): 2975-2981. |
| [2] | REYILAI· Maimaiti, ZHOU Yiran, WU Yun, LIU Zhencheng, LU Yaoqin, WU Haiyan. Association between Novel Obesity Indicators and Cardiovascular Disease Risk in Hypertensive Patients [J]. Chinese General Practice, 2026, 29(20): 2836-2845. |
| [3] | ZHANG Xiaojuan, LIU Yang, PENG Bo, YE Yuan, ZHU Kun. Study on the Prevention and Treatment of Hypertension and Diabetes Mellitus in Community Hospital [J]. Chinese General Practice, 2026, 29(19): 2614-2620. |
| [4] | MIAO Jingjie, ZHANG Jinwen, WU Qianhao, HAN Peipei. Research Advances on the Effects of Intermittent Fasting on Cardiometabolic Diseases [J]. Chinese General Practice, 2026, 29(18): 2538-2545. |
| [5] | XU Ping, MA Yan, HUANG Li, HE Meiliang, HOU Yunfeng, WANG Dewang, SUN Panpan, LIU Zheng, GUO Yanfang, XU Ying. Association between Weight-adjusted Waist Index and Comorbidity of Hypertension, Diabetes and Dyslipidemia in Community-dwelling Adults [J]. Chinese General Practice, 2026, 29(16): 2198-2204. |
| [6] | QIU Xinyu, ZHAO Qian, CHEN Yufei, JIAMULE· Maimaitiyiming, HAN Congcong, AIKEDAN· Aierken, LI Xiaomei, YANG Yining. Weight Status and Metabolic Characteristics on the Longitudinal Trajectory of Systolic Blood Pressure: a Cohort Study [J]. Chinese General Practice, 2026, 29(15): 2006-2013. |
| [7] | LIU Fan, CHEN Qiuyu, LI Jing. Development and Validation of a Nighttime Hypertension Screening Model for Subclinical High-risk Populations: a Single-center Cohort Study [J]. Chinese General Practice, 2026, 29(15): 1998-2005. |
| [8] | LIU Tianyuan, SANG Wanyue, PENG Jiping, CHENG Siyi, HUANG Yiyi, LI Ouwen, JIANG Hong, ZHOU Xiaoya. Correlation Analysis between Neurofilament Light Chain and the Risk of Left Ventricular Hypertrophy in Patients with Nocturnal Hypertension [J]. Chinese General Practice, 2026, 29(15): 2014-2021. |
| [9] | WANG Siman, ZHANG Mengchu, LI Wen, XU Ai, XU Jin, GUO Rui, YAN Haixia. Research on the Construction of a Risk Prediction Model for Primary Hypertension with Left Ventricular Hypertrophy Based on TCM Syndromes and Pulse Graph Parameters [J]. Chinese General Practice, 2026, 29(14): 1840-1848. |
| [10] | WU Chunxiang, TIAN Jie, GUO Yi, DENG Bo, YU Jie, CAI Ning, SHEN Li. Analysis of the 8-year Trajectories and Influencing Factors of Medical-help-seeking Behavior of Hypertensive Patients [J]. Chinese General Practice, 2026, 29(13): 1660-1665. |
| [11] | SONG Lu, WANG Liye, XIU Chunxia, FENG Baojing, FENG Liping, GAO Yansong, LI Meng, DAI Yan. The Correlation Study of Pulmonary Function and Blood Pressure Variability in Patients with Chronic Obstructive Pulmonary Disease and Hypertension [J]. Chinese General Practice, 2026, 29(10): 1311-1315. |
| [12] | JIAO Xitong, LIU Lu, GUO Jiayue, YOU Lili. Prospects for the Application of Digital Therapy Products for Hypertension at Home and Abroad and the Implications for China [J]. Chinese General Practice, 2026, 29(10): 1354-1360. |
| [13] | YANG Xu, FAN Jieting, SONG Hongyan, FENG Panpan, HAO Jingyu, YAO Mi. Risk Assessment and Communication Strategies for Cardiovascular Diseases in Primary Care [J]. Chinese General Practice, 2026, 29(10): 1294-1299. |
| [14] | YANG Ling, DU Xueping. Community Outpatient Teaching Practice in the Third Year of Standardized Training for General Practice Residents: PQRST Pain Assessment Method Combined with Cardiovascular Risk Assessment for the Diagnosis and Treatment of Atypical Acute Coronary Syndrome [J]. Chinese General Practice, 2026, 29(09): 1121-1128. |
| [15] | ZHANG Qiuyu, HU Xiaoyong, TANG Rui, LI Hongjian. Correlation between Chinese Visceral Adiposity Index and Nocturnal Hypertension in Young and Middle-aged People [J]. Chinese General Practice, 2026, 29(07): 872-878. |
| Viewed | ||||||
|
Full text |
|
|||||
|
Abstract |
|
|||||