
Chinese General Practice ›› 2025, Vol. 28 ›› Issue (18): 2205-2211.DOI: 10.12114/j.issn.1007-9572.2024.0540
Special Issue: 高血压最新文章合辑
• Article • Previous Articles Next Articles
Received:2024-11-11
Revised:2025-01-14
Published:2025-06-20
Online:2025-04-25
Contact:
LIU Tao, WANG Yiying
通讯作者:
刘涛, 王艺颖
作者简介:作者贡献:
梅景雁提出主要研究目标和研究理念,负责研究的构思与设计,撰写论文;陈敏、张列强进行数据的收集与整理,提供统计学方法的设计与思路;潘昀熙、王鑫负责统计学的处理及图表的绘制;赵小登、詹玮进行论文的修订;刘涛、王艺颖对研究进行了思路指导,负责文章的质量控制与审查、整体的监督管理,对文章负责。
基金资助:CLC Number:
Add to citation manager EndNote|Ris|BibTeX
URL: https://www.chinagp.net/EN/10.12114/j.issn.1007-9572.2024.0540
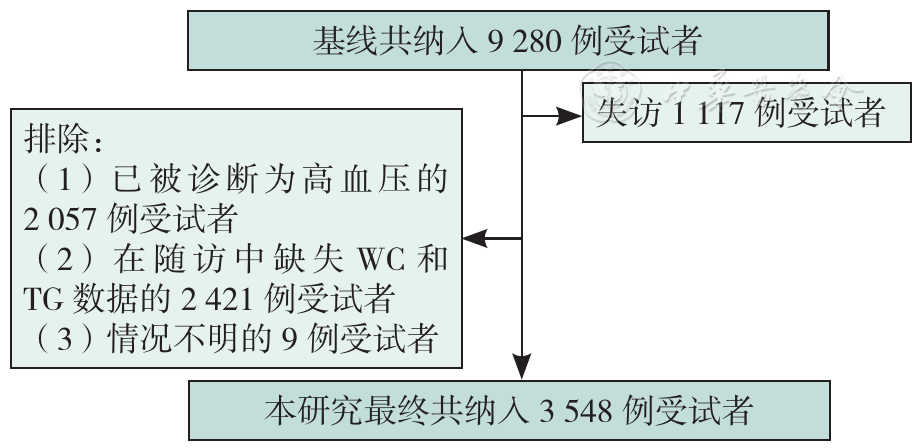
Figure 1 Inclusion process of research subjects
| 组别 | 例数 | 性别[例(%)] | 年龄(岁) | 居住地区[例(%)] | 婚姻状况[例(%)] | 受教育程度[例(%)] | ||||||
|---|---|---|---|---|---|---|---|---|---|---|---|---|
| 男 | 女 | 城市 | 乡村 | 未婚 | 已婚/同居 | 小学及以下 | 中学 | 高中及以上 | ||||
| 非高血压组 | 2 696 | 1 195(44.3) | 1 501(55.7) | 40.9±13.7 | 991(36.8) | 1 705(63.2) | 546(20.3) | 2 150(79.7) | 1 304(48.4) | 891(33.0) | 501(18.6) | |
| 高血压组 | 852 | 412(48.4) | 440(51.6) | 47.5±14.4 | 288(33.8) | 564(66.2) | 147(17.3) | 705(82.7) | 532(62.4) | 222(26.1) | 98(11.5) | |
| 检验统计量值 | 4.250 | 12.145a | 2.453 | 3.704 | 54.096 | |||||||
| P值 | 0.039 | 0.001 | 0.117 | 0.054 | 0.001 | |||||||
| 组别 | 体力活动[例(%)] | 吸烟[例(%)] | 饮酒[例(%)] | 高血压家族史[例(%)] | 血脂异常[例(%)] | |||||||
| 从不 | 多于每周1次 | 否 | 是 | 否 | 是 | 父或母有高血压 | 无 | 情况不明 | 否 | 是 | ||
| 非高血压组 | 329(12.2) | 2 367(87.8) | 2 157(80.0) | 539(20.0) | 2 642(98.0) | 54(2.0) | 326(12.1) | 1 714(63.6) | 656(24.3) | 1 223(45.4) | 1 473(54.6) | |
| 高血压组 | 99(11.6) | 753(88.4) | 662(77.7) | 190(22.3) | 830(97.4) | 22(2.6) | 72(8.5) | 541(52.9) | 239(28.1) | 401(47.1) | 451(52.9) | |
| 检验统计量值 | 0.208 | 2.112 | 1.036 | 11.203 | 0.756 | |||||||
| P值 | 0.648 | 0.146 | 0.309 | 0.004 | 0.385 | |||||||
| 组别 | 油摄入过量[例(%)] | 盐摄入过量[例(%)] | 谷物和淀粉摄入不足[例(%)] | 新鲜蔬菜摄入不足[例(%)] | 新鲜水果摄入不足[例(%)] | 红肉摄入过量[例(%)] | ||||||
| 否 | 是 | 否 | 是 | 否 | 是 | 否 | 是 | 否 | 是 | 否 | 是 | |
| 非高血压组 | 793(29.4) | 1 903(70.6) | 836(31.0) | 1 860(69.0) | 2 237(83.0) | 459(17.0) | 1 845(68.4) | 851(31.6) | 225(8.3) | 2 471(91.7) | 2 548(94.5) | 148(5.5) |
| 高血压组 | 217(25.5) | 635(74.5) | 224(26.3) | 628(73.7) | 699(82.0) | 153(18.0) | 574(67.4) | 278(32.6) | 50(5.9) | 802(94.1) | 811(95.2) | 41(4.8) |
| 检验统计量值 | 4.947 | 6.878 | 0.394 | 0.338 | 5.556 | 0.589 | ||||||
| P值 | 0.026 | 0.009 | 0.530 | 0.561 | 0.018 | 0.443 | ||||||
| 组别 | 缺乏睡眠[例(%)] | BMI[例(%)] | 收缩压(mmHg) | 舒张压(mmHg) | 空腹血糖(mmol/L) | 累积LAP[M(P25,P75)] | ||||||
| 否 | 是 | <18.5 kg/m2 | 18.5~23.9 kg/m2 | 24.0~27.9 kg/m2 | ≥28.0 kg/m2 | |||||||
| 非高血压组 | 2 609(96.8) | 87(3.2) | 166(6.2) | 1 793(66.5) | 608(22.6) | 166(4.7) | 115±12 | 73±8 | 5.21±1.14 | 31.69(19.61,49.69) | ||
| 高血压组 | 802(94.1) | 50(5.9) | 44(5.2) | 527(61.9) | 220(25.8) | 44(7.1) | 119±12 | 75±8 | 5.27±1.54 | 22.44(13.43,35.71) | ||
| 检验统计量值 | 12.169 | 13.004 | 0.666a | 4.366a | 5.618a | -11.638b | ||||||
| P值 | 0.001 | 0.005 | 0.415 | 0.037 | 0.018 | 0.001 | ||||||
Table 1 Baseline data of study subjects
| 组别 | 例数 | 性别[例(%)] | 年龄(岁) | 居住地区[例(%)] | 婚姻状况[例(%)] | 受教育程度[例(%)] | ||||||
|---|---|---|---|---|---|---|---|---|---|---|---|---|
| 男 | 女 | 城市 | 乡村 | 未婚 | 已婚/同居 | 小学及以下 | 中学 | 高中及以上 | ||||
| 非高血压组 | 2 696 | 1 195(44.3) | 1 501(55.7) | 40.9±13.7 | 991(36.8) | 1 705(63.2) | 546(20.3) | 2 150(79.7) | 1 304(48.4) | 891(33.0) | 501(18.6) | |
| 高血压组 | 852 | 412(48.4) | 440(51.6) | 47.5±14.4 | 288(33.8) | 564(66.2) | 147(17.3) | 705(82.7) | 532(62.4) | 222(26.1) | 98(11.5) | |
| 检验统计量值 | 4.250 | 12.145a | 2.453 | 3.704 | 54.096 | |||||||
| P值 | 0.039 | 0.001 | 0.117 | 0.054 | 0.001 | |||||||
| 组别 | 体力活动[例(%)] | 吸烟[例(%)] | 饮酒[例(%)] | 高血压家族史[例(%)] | 血脂异常[例(%)] | |||||||
| 从不 | 多于每周1次 | 否 | 是 | 否 | 是 | 父或母有高血压 | 无 | 情况不明 | 否 | 是 | ||
| 非高血压组 | 329(12.2) | 2 367(87.8) | 2 157(80.0) | 539(20.0) | 2 642(98.0) | 54(2.0) | 326(12.1) | 1 714(63.6) | 656(24.3) | 1 223(45.4) | 1 473(54.6) | |
| 高血压组 | 99(11.6) | 753(88.4) | 662(77.7) | 190(22.3) | 830(97.4) | 22(2.6) | 72(8.5) | 541(52.9) | 239(28.1) | 401(47.1) | 451(52.9) | |
| 检验统计量值 | 0.208 | 2.112 | 1.036 | 11.203 | 0.756 | |||||||
| P值 | 0.648 | 0.146 | 0.309 | 0.004 | 0.385 | |||||||
| 组别 | 油摄入过量[例(%)] | 盐摄入过量[例(%)] | 谷物和淀粉摄入不足[例(%)] | 新鲜蔬菜摄入不足[例(%)] | 新鲜水果摄入不足[例(%)] | 红肉摄入过量[例(%)] | ||||||
| 否 | 是 | 否 | 是 | 否 | 是 | 否 | 是 | 否 | 是 | 否 | 是 | |
| 非高血压组 | 793(29.4) | 1 903(70.6) | 836(31.0) | 1 860(69.0) | 2 237(83.0) | 459(17.0) | 1 845(68.4) | 851(31.6) | 225(8.3) | 2 471(91.7) | 2 548(94.5) | 148(5.5) |
| 高血压组 | 217(25.5) | 635(74.5) | 224(26.3) | 628(73.7) | 699(82.0) | 153(18.0) | 574(67.4) | 278(32.6) | 50(5.9) | 802(94.1) | 811(95.2) | 41(4.8) |
| 检验统计量值 | 4.947 | 6.878 | 0.394 | 0.338 | 5.556 | 0.589 | ||||||
| P值 | 0.026 | 0.009 | 0.530 | 0.561 | 0.018 | 0.443 | ||||||
| 组别 | 缺乏睡眠[例(%)] | BMI[例(%)] | 收缩压(mmHg) | 舒张压(mmHg) | 空腹血糖(mmol/L) | 累积LAP[M(P25,P75)] | ||||||
| 否 | 是 | <18.5 kg/m2 | 18.5~23.9 kg/m2 | 24.0~27.9 kg/m2 | ≥28.0 kg/m2 | |||||||
| 非高血压组 | 2 609(96.8) | 87(3.2) | 166(6.2) | 1 793(66.5) | 608(22.6) | 166(4.7) | 115±12 | 73±8 | 5.21±1.14 | 31.69(19.61,49.69) | ||
| 高血压组 | 802(94.1) | 50(5.9) | 44(5.2) | 527(61.9) | 220(25.8) | 44(7.1) | 119±12 | 75±8 | 5.27±1.54 | 22.44(13.43,35.71) | ||
| 检验统计量值 | 12.169 | 13.004 | 0.666a | 4.366a | 5.618a | -11.638b | ||||||
| P值 | 0.001 | 0.005 | 0.415 | 0.037 | 0.018 | 0.001 | ||||||
| 变量 | 模型1 | 模型2 | 模型3 | |||
|---|---|---|---|---|---|---|
| aHR(95%CI) | P值 | aHR(95%CI) | P值 | aHR(95%CI) | P值 | |
| Q1组 | 1 | 1 | 1 | |||
| Q2组 | 1.313(1.041~1.655) | 0.022 | 1.337(1.058~1.690) | 0.015 | 1.330(1.053~1.681) | 0.017 |
| Q3组 | 1.754(1.411~2.181) | <0.01 | 1.747(1.397~2.184) | <0.01 | 1.706(1.364~2.134) | <0.01 |
| Q4组 | 2.388(1.939~2.940) | <0.01 | 2.373(1.896~2.969) | <0.01 | 2.339(1.869~2.928) | <0.01 |
Table 2 Results of the Cox proportional regression model for the relationship between cumulative LAP and new-onset hypertension
| 变量 | 模型1 | 模型2 | 模型3 | |||
|---|---|---|---|---|---|---|
| aHR(95%CI) | P值 | aHR(95%CI) | P值 | aHR(95%CI) | P值 | |
| Q1组 | 1 | 1 | 1 | |||
| Q2组 | 1.313(1.041~1.655) | 0.022 | 1.337(1.058~1.690) | 0.015 | 1.330(1.053~1.681) | 0.017 |
| Q3组 | 1.754(1.411~2.181) | <0.01 | 1.747(1.397~2.184) | <0.01 | 1.706(1.364~2.134) | <0.01 |
| Q4组 | 2.388(1.939~2.940) | <0.01 | 2.373(1.896~2.969) | <0.01 | 2.339(1.869~2.928) | <0.01 |
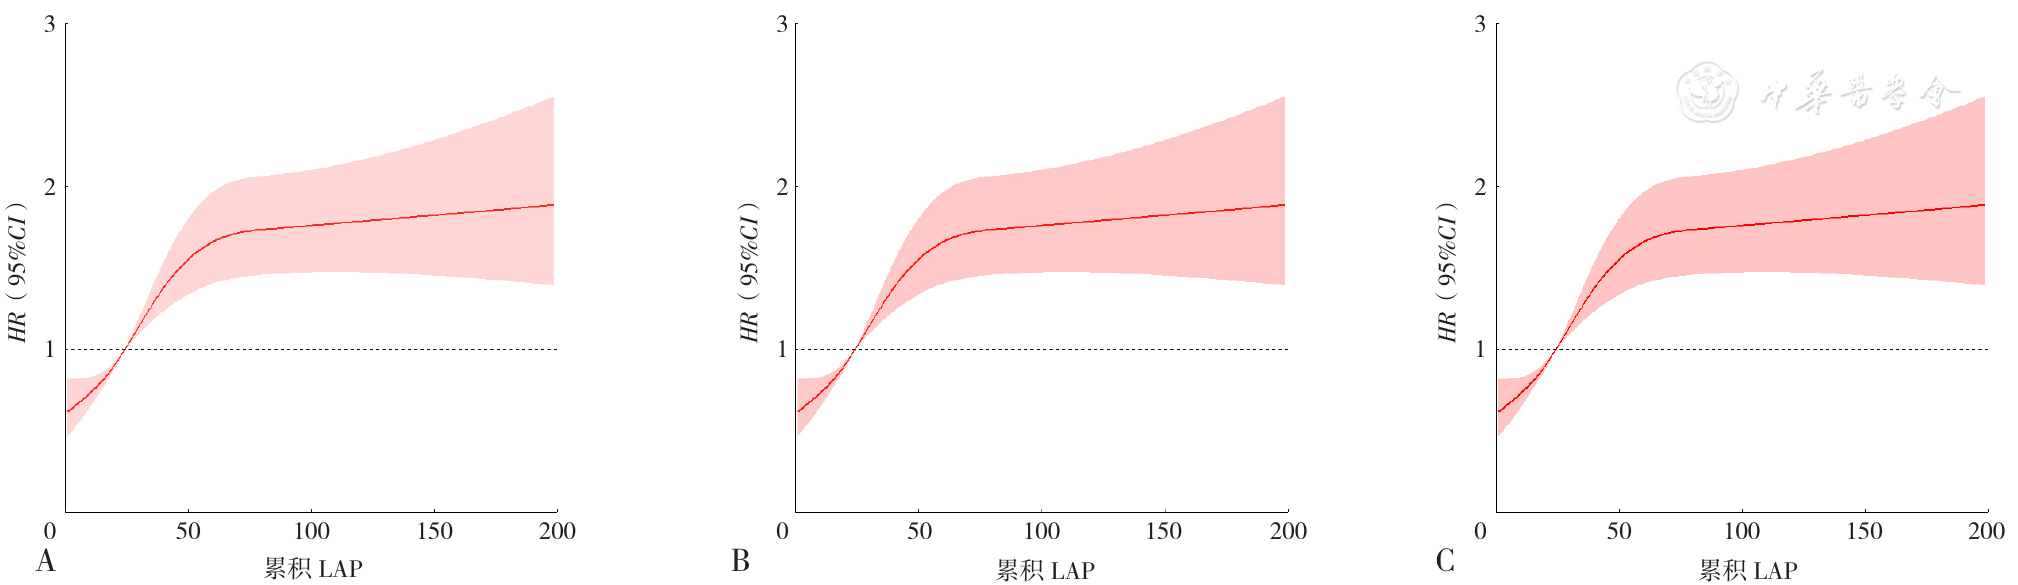
Figure 2 Restricted cubic spline plots of cumulative LAP and the risk of new-onset hypertension in different gender groups

Figure 3 Time-dependent ROC curve of cumulative LAP in predicting new-onset hypertension in different populations
| 暴露时间 | 最佳截断值 | 灵敏度 | 特异度 | 约登指数 | AUC | 95%CI |
|---|---|---|---|---|---|---|
| 总人群 | ||||||
| 暴露6年 | 16.470 | 0.469 | 0.278 | 0.191 | 0.617 | 0.578~0.656 |
| 暴露7年 | 29.295 | 0.454 | 0.286 | 0.167 | 0.590 | 0.546~0.603 |
| 暴露8年 | 29.295 | 0.453 | 0.271 | 0.182 | 0.603 | 0.550~0.611 |
| 暴露9年 | 43.345 | 0.634 | 0.397 | 0.237 | 0.634 | 0.553~0.642 |
| 性别 | ||||||
| 男性 | ||||||
| 暴露6年 | 39.090 | 0.412 | 0.245 | 0.167 | 0.600 | 0.543~0.658 |
| 暴露7年 | 29.190 | 0.372 | 0.247 | 0.125 | 0.561 | 0.509~0.592 |
| 暴露8年 | 29.295 | 0.390 | 0.242 | 0.147 | 0.571 | 0.512~0.601 |
| 暴露9年 | 9.183 | 0.430 | 0.307 | 0.123 | 0.558 | 0.483~0.609 |
| 女性 | ||||||
| 暴露6年 | 16.839 | 0.670 | 0.426 | 0.243 | 0.638 | 0.689~0.658 |
| 暴露7年 | 10.255 | 0.532 | 0.324 | 0.208 | 0.629 | 0.642~0.592 |
| 暴露8年 | 6.845 | 0.642 | 0.414 | 0.228 | 0.647 | 0.652~0.601 |
| 暴露9年 | 12.775 | 0.825 | 0.476 | 0.349 | 0.711 | 0.708~0.609 |
| 居住地区 | ||||||
| 城市 | ||||||
| 暴露6年 | 58.925 | 0.493 | 0.298 | 0.195 | 0.596 | 0.529~0.663 |
| 暴露7年 | 75.925 | 0.499 | 0.331 | 0.168 | 0.565 | 0.505~0.611 |
| 暴露8年 | 64.655 | 0.379 | 0.189 | 0.190 | 0.602 | 0.506~0.635 |
| 暴露9年 | 112.474 | 0.739 | 0.507 | 0.231 | 0.621 | 0.490~0.654 |
| 乡村 | ||||||
| 暴露6年 | 9.468 | 0.649 | 0.438 | 0.211 | 0.629 | 0.581~0.676 |
| 暴露7年 | 19.408 | 0.424 | 0.274 | 0.15 | 0.592 | 0.542~0.611 |
| 暴露8年 | 19.408 | 0.422 | 0.264 | 0.157 | 0.594 | 0.540~0.611 |
| 暴露9年 | 27.305 | 0.627 | 0.395 | 0.232 | 0.635 | 0.556~0.661 |
Table 3 Predictive value of cumulative LAP for new-onset hypertension in different populations
| 暴露时间 | 最佳截断值 | 灵敏度 | 特异度 | 约登指数 | AUC | 95%CI |
|---|---|---|---|---|---|---|
| 总人群 | ||||||
| 暴露6年 | 16.470 | 0.469 | 0.278 | 0.191 | 0.617 | 0.578~0.656 |
| 暴露7年 | 29.295 | 0.454 | 0.286 | 0.167 | 0.590 | 0.546~0.603 |
| 暴露8年 | 29.295 | 0.453 | 0.271 | 0.182 | 0.603 | 0.550~0.611 |
| 暴露9年 | 43.345 | 0.634 | 0.397 | 0.237 | 0.634 | 0.553~0.642 |
| 性别 | ||||||
| 男性 | ||||||
| 暴露6年 | 39.090 | 0.412 | 0.245 | 0.167 | 0.600 | 0.543~0.658 |
| 暴露7年 | 29.190 | 0.372 | 0.247 | 0.125 | 0.561 | 0.509~0.592 |
| 暴露8年 | 29.295 | 0.390 | 0.242 | 0.147 | 0.571 | 0.512~0.601 |
| 暴露9年 | 9.183 | 0.430 | 0.307 | 0.123 | 0.558 | 0.483~0.609 |
| 女性 | ||||||
| 暴露6年 | 16.839 | 0.670 | 0.426 | 0.243 | 0.638 | 0.689~0.658 |
| 暴露7年 | 10.255 | 0.532 | 0.324 | 0.208 | 0.629 | 0.642~0.592 |
| 暴露8年 | 6.845 | 0.642 | 0.414 | 0.228 | 0.647 | 0.652~0.601 |
| 暴露9年 | 12.775 | 0.825 | 0.476 | 0.349 | 0.711 | 0.708~0.609 |
| 居住地区 | ||||||
| 城市 | ||||||
| 暴露6年 | 58.925 | 0.493 | 0.298 | 0.195 | 0.596 | 0.529~0.663 |
| 暴露7年 | 75.925 | 0.499 | 0.331 | 0.168 | 0.565 | 0.505~0.611 |
| 暴露8年 | 64.655 | 0.379 | 0.189 | 0.190 | 0.602 | 0.506~0.635 |
| 暴露9年 | 112.474 | 0.739 | 0.507 | 0.231 | 0.621 | 0.490~0.654 |
| 乡村 | ||||||
| 暴露6年 | 9.468 | 0.649 | 0.438 | 0.211 | 0.629 | 0.581~0.676 |
| 暴露7年 | 19.408 | 0.424 | 0.274 | 0.15 | 0.592 | 0.542~0.611 |
| 暴露8年 | 19.408 | 0.422 | 0.264 | 0.157 | 0.594 | 0.540~0.611 |
| 暴露9年 | 27.305 | 0.627 | 0.395 | 0.232 | 0.635 | 0.556~0.661 |
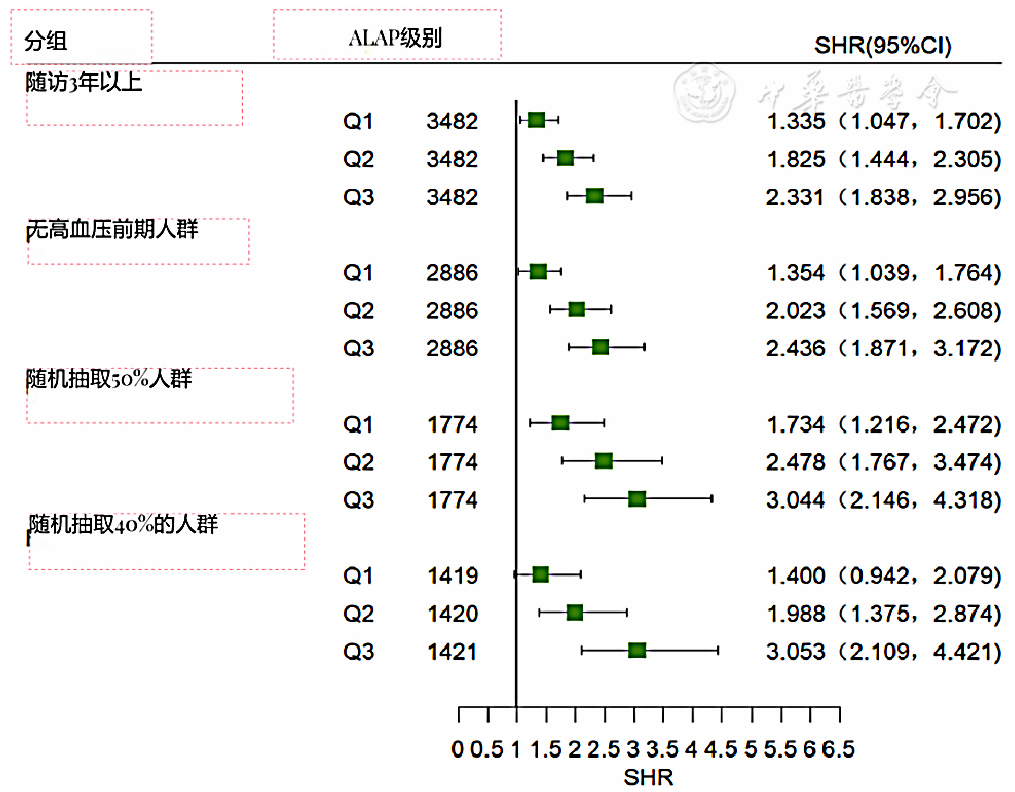
Figure 4 TSensitivity analysis of cumulative LAP on the risk of incident hypertension
| [1] |
|
| [2] |
|
| [3] |
|
| [4] |
|
| [5] |
|
| [6] |
|
| [7] |
|
| [8] |
|
| [9] |
|
| [10] |
申元媛. 中国成人脂质蓄积指数与高血压、糖尿病及心血管疾病的关系[D]. 北京:北京协和医学院,2017.
|
| [11] |
刘娜. 冠心病患者腹部内脏脂肪与胰岛素抵抗的相关性研究[D]. 石家庄:河北医科大学,2012.
|
| [12] |
|
| [13] |
|
| [14] |
|
| [15] |
陈冯梅,郭志荣,海波,等. 体质指数、腰围、腰臀比和腰高比对高血压发病影响前瞻性队列研究[J]. 中国公共卫生,2021,37(12):1774-1777. DOI:10.11847/zgggws1128795.
|
| [16] |
|
| [17] | |
| [18] |
李园,翟凤英,王惠君,等. 中国成年人体质指数和腰围与高血压关系的四年随访研究[J]. 卫生研究,2007,36(4):478-480. DOI:10.3969/j.issn.1000-8020.2007.04.020.
|
| [19] |
|
| [20] |
|
| [21] |
|
| [22] |
|
| [23] |
|
| [24] |
|
| [25] |
|
| [26] |
|
| [1] | ZHOU Xiaoya, WANG Weikai, LIU Qian, LI Jianhua, SUN Bo, WANG Yanxia. Study of the Interaction between Sleep Quality and Melatonin Receptor 1B Gene Polymorphism on Gestational Hypertension [J]. Chinese General Practice, 2026, 29(21): 2975-2981. |
| [2] | CHAI Zhihao, ZHANG Weisen, LUO Jiaoling, ZHU Feng, ZHU Tong, JIN Yali, PAN Jing, LU Yingjun, JIANG Chaoqiang. The Mediation Effect of Socioeconomic Status in Childhood Parental Literacy and Cognitive Function in Middle-aged and Older People: Based on Guangzhou Biobank Cohort Study [J]. Chinese General Practice, 2026, 29(21): 2959-2966. |
| [3] | HAN Congcong, QIU Xinyu, SHAN Chunfang, SONG Ning, CHEN Qingjie, MULADILI· Abudureheman, LI Xiaomei, YANG Yining, ZHAO Qian. Impact of Metabolic Obesity Phenotype on Long-term Prognosis after Percutaneous Coronary Intervention in Patients with Acute Coronary Syndrome [J]. Chinese General Practice, 2026, 29(21): 2950-2958. |
| [4] | LIU Shuai, YUAN Shizhao, LIU Yan, JIA Shuoxian, ZHAO Yan, WANG Ziyi, ZHOU Chunhua, YU Jing. Evaluation of the Efficacy, Safetyand Economy of Different Amphotericin B Formulationsin Invasive Fungal Disease: a Retrospective Cohort Study [J]. Chinese General Practice, 2026, 29(21): 2967-2974. |
| [5] | REYILAI· Maimaiti, ZHOU Yiran, WU Yun, LIU Zhencheng, LU Yaoqin, WU Haiyan. Association between Novel Obesity Indicators and Cardiovascular Disease Risk in Hypertensive Patients [J]. Chinese General Practice, 2026, 29(20): 2836-2845. |
| [6] | ZHANG Xiaojuan, LIU Yang, PENG Bo, YE Yuan, ZHU Kun. Study on the Prevention and Treatment of Hypertension and Diabetes Mellitus in Community Hospital [J]. Chinese General Practice, 2026, 29(19): 2614-2620. |
| [7] | MIAO Jingjie, ZHANG Jinwen, WU Qianhao, HAN Peipei. Research Advances on the Effects of Intermittent Fasting on Cardiometabolic Diseases [J]. Chinese General Practice, 2026, 29(18): 2538-2545. |
| [8] | XU Ping, MA Yan, HUANG Li, HE Meiliang, HOU Yunfeng, WANG Dewang, SUN Panpan, LIU Zheng, GUO Yanfang, XU Ying. Association between Weight-adjusted Waist Index and Comorbidity of Hypertension, Diabetes and Dyslipidemia in Community-dwelling Adults [J]. Chinese General Practice, 2026, 29(16): 2198-2204. |
| [9] | QIU Xinyu, ZHAO Qian, CHEN Yufei, JIAMULE· Maimaitiyiming, HAN Congcong, AIKEDAN· Aierken, LI Xiaomei, YANG Yining. Weight Status and Metabolic Characteristics on the Longitudinal Trajectory of Systolic Blood Pressure: a Cohort Study [J]. Chinese General Practice, 2026, 29(15): 2006-2013. |
| [10] | LIU Fan, CHEN Qiuyu, LI Jing. Development and Validation of a Nighttime Hypertension Screening Model for Subclinical High-risk Populations: a Single-center Cohort Study [J]. Chinese General Practice, 2026, 29(15): 1998-2005. |
| [11] | LIU Tianyuan, SANG Wanyue, PENG Jiping, CHENG Siyi, HUANG Yiyi, LI Ouwen, JIANG Hong, ZHOU Xiaoya. Correlation Analysis between Neurofilament Light Chain and the Risk of Left Ventricular Hypertrophy in Patients with Nocturnal Hypertension [J]. Chinese General Practice, 2026, 29(15): 2014-2021. |
| [12] | WANG Siman, ZHANG Mengchu, LI Wen, XU Ai, XU Jin, GUO Rui, YAN Haixia. Research on the Construction of a Risk Prediction Model for Primary Hypertension with Left Ventricular Hypertrophy Based on TCM Syndromes and Pulse Graph Parameters [J]. Chinese General Practice, 2026, 29(14): 1840-1848. |
| [13] | WU Chunxiang, TIAN Jie, GUO Yi, DENG Bo, YU Jie, CAI Ning, SHEN Li. Analysis of the 8-year Trajectories and Influencing Factors of Medical-help-seeking Behavior of Hypertensive Patients [J]. Chinese General Practice, 2026, 29(13): 1660-1665. |
| [14] | LIU Xiang, CHEN Hong, CUI Rui, GUO Zhichao, LI Panpan, CAO Zilong, JI Yiqing, YU Wenya. Consistencies and Differences in Early Childhood Development Characteristics in Megacities: a Retrospective Cohort Study [J]. Chinese General Practice, 2026, 29(11): 1411-1421. |
| [15] | SONG Lu, WANG Liye, XIU Chunxia, FENG Baojing, FENG Liping, GAO Yansong, LI Meng, DAI Yan. The Correlation Study of Pulmonary Function and Blood Pressure Variability in Patients with Chronic Obstructive Pulmonary Disease and Hypertension [J]. Chinese General Practice, 2026, 29(10): 1311-1315. |
| Viewed | ||||||
|
Full text |
|
|||||
|
Abstract |
|
|||||